Mattrix Auto Refresh

Mattrix Auto Refresh


Short Description

Keeps custom symbol charts up to date. Forces periodic candle recalculation without Journal spam.
Essential for any synthetic or custom symbol chart in MT5.

Full Description

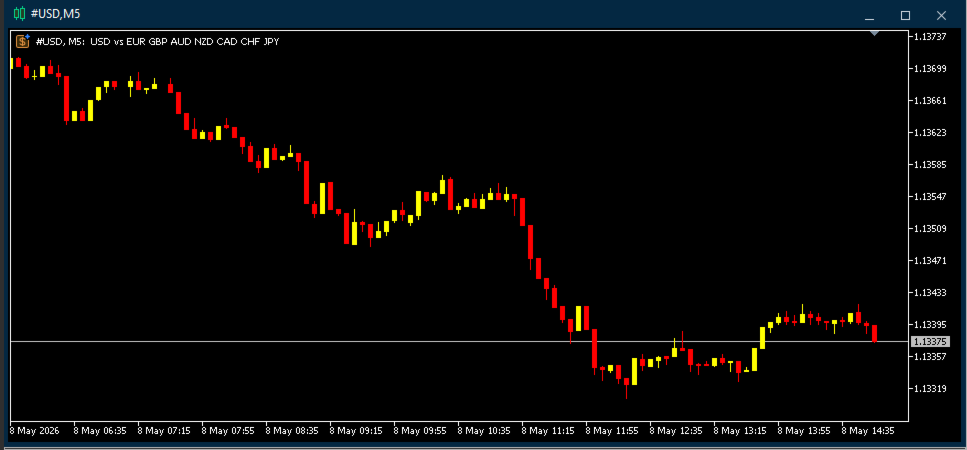
Custom symbols in MetaTrader 5 do not receive broker ticks. Their charts often show outdated or incomplete candles, especially on lower timeframes.
This lightweight indicator solves the problem.
Drop it on any custom symbol chart. It forces a periodic full bar recalculation by returning zero from OnCalculate, which resets the calculation state and redraws all candles cleanly.
Unlike other refresh methods, this approach does not trigger a full history reprocess and does not spam the Journal tab.
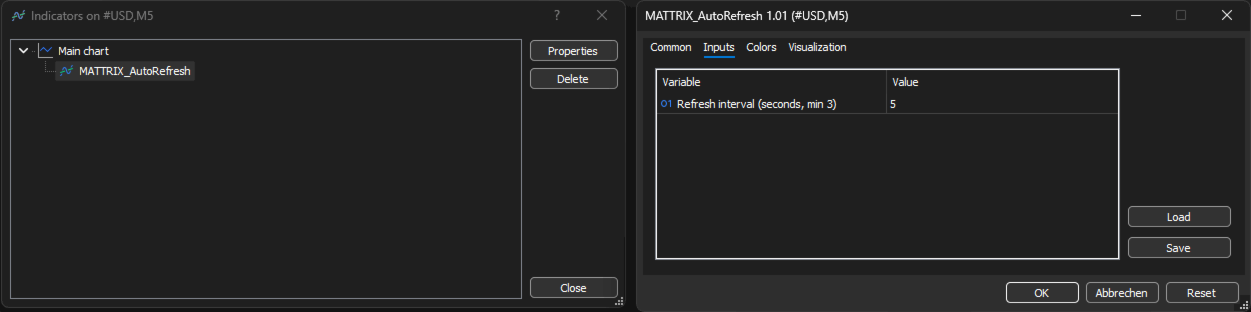
The refresh interval is configurable. Default is 5 seconds. Minimum is 3 seconds. On higher timeframes like H1 or D1, you can increase it to 15 or 30 seconds to reduce CPU usage.
This indicator has zero visual footprint. No lines, no labels, no buffers. It simply keeps your chart alive.
Works with any custom symbol created by any EA or script. Particularly useful for synthetic currency basket charts, index composites, or any formula-based custom symbol.

Input parameters:

Refresh interval in seconds (default 5, minimum 3).
This free helper keeps your MATTRIX custom symbol charts up to date. It works alongside the full MATTRIX 8x family:

### THE MATTRIX 8x FAMILY ON MQL5

FOUNDATION (free):
- Synthetic Chart - creates the 11 custom symbols every basket tool needs
- Day Levels - Yesterday H/L, Today H/L and ADR% on any chart
ANALYSIS:
- Basket Viewer - live 8-currency strength dashboard
- Basket Strength - on-chart strength breakdown per basket
- Position Monitor - 8x8 matrix of all open positions
- Risk Meter - Risk-On / Risk-Off sentiment indicator
EXECUTION:
- One Click Basket Trade - one-click basket entry & management
Full ecosystem: mattrix8x.com

(c) 2026 Matthias Scholz | mattrix8x.com
おすすめのプロダクト
Haven Volume Profileは、取引量の分布に基づいて重要な価格レベルを識別するための多機能なボリュームプロファイル分析インジケーターです。市場をより深く理解し、重要なエントリーポイントとエグジットポイントを特定したいプロのトレーダー向けに設計されています。 その他の製品 ->  こちら 主な機能: Point of Control (POC) 計算 - 最大の取引活動が行われるレベルで、最も流動性の高いレベルを特定するのに役立ちます Value Area(高い活動の領域)の定義とカスタマイズ可能な取引量の割合で、取引範囲をより正確に評価できます ティックボリュームと実際の取引量の両方に対応し、さまざまな市場タイプや取引戦略に対応しています 計算期間(日数)の柔軟な設定により、任意の時間枠にツールを適応させることができます ターミナルのライトテーマとダークテーマに自動的に適応し、ユーザーインターフェースの視覚的な体験を向上させます レベルの視覚化が明確で、スタイルや色をカスタマイズでき、グラフ分析と迅速な意思決定を支援します このインジケーターは、重要な価格レベルや統合ゾー
FREE
The indicator displays the orders book, as well as increases its depth, remembering the location of orders that have gone beyond the current "window" view. Indicator capability Display the levels of open positions. Simulation of placing/cancelling/editing pending orders directly in the displayed orders book. Indicator features The orders book display works only on those trading symbols for which it is broadcast by the broker. To reset the information about the rows that were recorded in the Sm
FREE
This indicator calculates the volume profile and places labels that correspond to the VAH, VAL and POC levels, for each candle individually. Indicator operation features The indicator works on the timeframes from M3 to MN, but it uses the history data of smaller periods: M1 - for periods from M3 to H1, M5 - for periods from H2 to H12, M30 - for the D1 period, H4 - for the W1 period, D1 - for the MN period. The color and location of the VAL, VAH and POC labels on the current candle are considere
FREE
Aggression Volume Profile
Edson Cavalca Junior
4.55 (11)
This indicator plots the volume profile by Price on the chart There are 5 ways to view it: By Total Volume Traded (Premium Version); Volume Ticks(Forex) Separated by Buyers and Sellers (Premium Version); Buyers Only (Premium Version); Sellers Only (Premium Version); Business balance (Buyers - Sellers) (Premium Version); . It is possible to select how many days the profiles will be calculated.( Premium Version) On the current day it recalculates the histogram data for each new candlestick.
FREE
Enhanced Volume Profile: The Ultimate Order Flow & Liquidity Analysis Tool Overview Enhanced Volume Profile is an indicator for MetaTrader 5 that displays the traded volume at specific price levels over a defined period. It separates the total volume into buy and sell components, presenting them as a side-by-side histogram on the chart. This allows users to observe the volume distribution and the proportion of buy and sell volumes at each price level. Graphics Rendering The indicator uses the
FREE
Value Chart Candlesticks
Flavio Javier Jarabeck
4.57 (14)
The idea of a Value Chart indicator was presented in the very good book I read back in 2020 , " Dynamic Trading Indicators: Winning with Value Charts and Price Action Profile ", from the authors Mark Helweg and David Stendahl. The idea is simple and the result is pure genius: Present candlestick Price analysis in a detrended way! HOW TO READ THIS INDICATOR Look for Overbought and Oversold levels. Of course, you will need to test the settings a lot to find the "correct" one for your approach. It
FREE
The Mirror Chart MT5 is a overlay indicator specifically designed to project a second financial instrument directly onto the main chart window. This tool is invaluable for traders who rely on correlation analysis, as it visualizes the price movements of two different instruments in real time. Unlike traditional overlays, this indicator utilizes intelligent, dynamic centering and scaling logic. It continuously analyzes the visible price range in the current window for both symbols and calculates
FREE
About the indicator: DALA Forecast is a universal tool for predicting the dynamics of time series of any nature. For prediction, modified methods of nonlinear dynamics analysis are used, on the basis of which a predictive model is built using machine learning methods.  To get the trial version of the indicator, you can contact me in private messages. How to use the indicator: Apply the indicator to your chosen financial instrument or indicator with the settings you need. The prediction will be
FREE
Here   our more valuable tools SMC Trend Trading   ,  Easy SMC Trading  ,  Institutional SMC Architect Volume Analysis Tools  ,  Volume flow Profile  ,  Market volume profile  , FVG with Volume  , Liquidity Heatmap Profile  ,  Volume Spread Analysis A professional spike pattern indicator built for synthetic traders who scalp and swing Crash 500/300/1000 with precision.  This indicator: Detects powerful 3-candle spike formations (Spike → Pullback → Spike) Automatically draws a clean box a
FREE
Market Profile 3 ForexArby com
Hussien Abdeltwab Hussien Ryad
4 (15)
Market Profile 3 MetaTrader 5 indicator  version 4.70— is a classic Market Profile implementation that can show the price density over time, outlining the most important price levels, value area, and control value of a given trading session. This indicator can be attached to timeframes between M1 and D1 and will show the Market Profile for daily, weekly, monthly, or even intraday sessions. Lower timeframes offer higher precision. Higher timeframes are recommended for better visibility. It is als
FREE
Volume profile CVD Frato
Francisco Felipe Alves Da Silva Rocha
5 (2)
Frato Volume Profile Pro v7.5 Frato Academy開発 このインジケーターは、MetaTrader 5用の価格ボリュームプロファイルを表示します。設定可能な期間における価格レベルごとの取引量の分布を計算し、その結果をメインチャートに直接表示します。 特徴: カラーグラデーションによるボリュームプロファイル このインジケーターは、価格帯を複数のレベルに分割し、各レベルに対応するボリュームを割り当てます。各レベルの色は、ボリュームに応じて連続的なグラデーションで変化します。ボリュームの少ないレベルは寒色系(濃い青)、ボリュームの多いレベルは暖色系(黄色)で表示されます。最もボリュームの多いレベルは、ポイント・オブ・コントロール(POC)と呼ばれ、視覚的に強調表示されます。 参照線:POC、VAH、VAL このインジケーターは、以下の3本の水平線を自動的にプロットします。 - POC(ポイント・オブ・コントロール):最高出来高レベル - VAH(バリューエリア高値):バリューエリアの上限 - VAL(バリューエリア安値):バリューエリアの下限
FREE
Here   our more valuable tools SMC Trend Trading   ,  Easy SMC Trading  ,  Institutional SMC Architect Volume Analysis Tools  ,  Volume flow Profile  ,  Market volume profile  , FVG with Volume  , Liquidity Heatmap Profile  ,  Volume Spread Analysis Automatically detects major swing points not internal noise Generates buy/sell signals at key Fibonacci levels Displays professional GUI panel with real-time analysis Marks major swings with visual indicators Trading Strategy BUY at 38.2%-61.8% Fib
FREE
GARCH(1,1) Volatility Estimator This indicator provides a computational implementation of the Generalized Autoregressive Conditional Heteroskedasticity (GARCH) model of order (1,1). It is designed to estimate the current volatility of a financial asset by factoring in both past shocks and previous variance estimates. Unlike standard moving averages, this model accounts for "volatility clustering"—the phenomenon where large price changes tend to be followed by further large changes. It's basicall
FREE
The indicator analyzes the volume scale and splits it into two components - seller volumes and buyer volumes, and also calculates the delta and cumulative delta. The indicator does not flicker or redraw, its calculation and plotting are performed fairly quickly, while using the data from the smaller (relative to the current) periods. The indicator operation modes can be switched using the Mode input variable: Buy - display only the buyer volumes. Sell - display only the seller volumes. BuySell -
FREE
This indicator will mirror the assets in use in another metatrader, being able to choose the timeframe and a template. This is the Metatrader 5 Client, it needs the Metatrader 4 or 5 Server versions: Metatrader 4 Mirror Chart Server:   https://www.mql5.com/en/market/product/88644 Metatrader 5 Mirror Chart Server: https://www.mql5.com/en/market/product/88652 Details of how it works in the video.
FREE
Core Purpose ​ A permanent crosshair indicator designed exclusively for MetaTrader 5 (MT5). It addresses key limitations of MT5's default crosshair, including the need for manual activation, automatic disappearance on click, and solid lines obscuring price bars. This indicator optimizes chart analysis by delivering a smooth, professional-grade crosshair experience on MT5. ​ Key Features ​ Automatic activation: Enabled immediately after loading, replacing the default Ctrl+F function. The crossha
FREE
Here   our more valuable tools SMC Trend Trading   ,  Easy SMC Trading  ,  Institutional SMC Architect Volume Analysis Tools  ,  Volume flow Profile  ,  Market volume profile  , FVG with Volume  , Liquidity Heatmap Profile  ,  Volume Spread Analysis Automatic Professional Theme:   Instantly applies a high-contrast "Color on White" theme with DeepSkyBlue bull candles and Black bear candles for maximum clarity. Interactive Timeframe Panel:   21 vertical buttons on the left side allow for one-clic
FREE
AP Session Boxes — Asian / London / NY Range Overlay (MT5 Indicator) Clean session boxes on your chart. This lightweight indicator draws the   Asian ,   London , and   New York   time windows directly on the chart, including each box’s   high   and   low   as dashed lines. It’s perfect for quick context, breakout planning, and clean screenshots. Instant structure:   See where the market ranged during key sessions. Breakout prep:   Use the hi/lo lines as reference for pending orders or alerts fr
FREE
概要 このインジケーターは、クラシックな ドンチャンチャネル を強化したバージョンで、実践的なトレード機能を追加しています。 標準の3本線(上限、下限、中央線)に加え、 ブレイクアウト を検出し、チャート上に矢印で視覚的に表示します。また、チャートを見やすくするために、 現在のトレンド方向と逆側のラインのみを表示 します。 インジケーターの機能: 視覚的シグナル :ブレイクアウト時にカラフルな矢印を表示 自動通知 :ポップアップ、プッシュ通知、Eメール RSIフィルター :市場の相対的な強弱に基づいてシグナルを検証 カスタマイズ可能 :色、ラインの太さ、矢印コード、RSI閾値など 動作原理 ドンチャンチャネルは次のように計算します: 上限線 :直近N本のクローズ済みローソク足の最高値 下限線 :直近N本のクローズ済みローソク足の最安値 中央線 :最高値と最安値の平均値 上方ブレイクアウト は終値が上限線を超えたときに発生し、 下方ブレイクアウト は終値が下限線を下回ったときに発生します。 インジケーターは以下を行います: 3本のドンチャンラインを描画 方向転換後の最初のブレイクアウト
FREE
High Low Open Close
Alexandre Borela
4.98 (44)
このプロジェクトが好きなら、5つ星レビューを残してください。 このインジケータは、指定されたためのオープン、ハイ、ロー、クローズ価格を描画します 特定のタイムゾーンの期間と調整が可能です。 これらは、多くの機関や専門家によって見られた重要なレベルです トレーダーは、彼らがより多くのかもしれない場所を知るために有用であり、 アクティブ。 利用可能な期間は次のとおりです。 前の日。 前週。 前の月。 前の四半期。 前年。 または: 現在の日。 現在の週。 現在の月。 現在の四半期。 現年。
FREE
Stonehill Forexでは、2025年3月にStonehill Forexのウェブサイトで紹介した、初の自社開発インジケーターを公開します。オリジナルバージョンはMetaTrader 4 (MT4) 用に開発され、その後、コミュニティの関心の高さを踏まえてMT5とTradingView向けにも開発されました。このインジケーターは無料で提供され、私たちのライブラリーの第一弾となります。 これは2本の線でクロス価格を表示するオーバーレイで、2本の加重移動平均線を非常に洗練されたフィルターに通して表示します。その結果、非常に正確なシグナルが読み出されます。3年間にわたってテストを行い、その結果はブログ(こちら)でご覧いただけます。さらに、使い方を説明したテクニカル分析ビデオもご用意しています。ビデオはブログに埋め込まれているので、分かりやすく便利です。 設定は2つあります。 StartLen:データの収集を開始する開始点。デフォルト値は2です。 「StartLen」の設定に関して、2つの注意点があります。 「StartLen」設定変数は0未満にしないでください。 「St
FREE
AvgVolumes
Marco Montemari
5 (1)
This indicator is based on Volumes standard indicator, calculates the average of Volumes based on the last N bars set by users, and if the value of the volume is bigger then a set % respect the average a different color will be used. The indicator is shown in a separate indicator window. This version has now a limitation in setting the % about the threshold. If you are interested to set threshold consider to buy the PRO version ( https://www.mql5.com/en/market/product/35925 ) If you want to use
FREE
AP VWAP Bands Pro (MT5) Volume-weighted average price with ±σ bands for clear intraday bias, mean-reversion zones, and dynamic support/resistance. Works on crypto (incl. BTC) , FX , indices , and metals . Uses tick-volume when real volume isn’t available. What it shows VWAP line (volume-weighted mean price). Two envelopes around VWAP (default ±1σ and ±2σ) to highlight balance vs. extension. Reset modes : Day , Week , or Anchor Time (HH:MM) to start VWAP where you need it (e.g., exchange open).
FREE
The Candle Countdown Timer for MetaTrader 4 (also available for MT5) is a vital indicator designed to help you manage your trading time effectively. It keeps you updated about market open and close times by displaying the remaining time before the current candle closes and a new one forms. This powerful tool enables you to make well-informed trading decisions. Key Features: Asia Range: Comes with an option to extend the range. Broker Time, New York, London Time: Displays the current broker time
FREE
Easy Correlations Indicator The Easy Correlations Indicator is designed to help traders analyze the relationship between two correlated instruments. By monitoring the distance between their Relative Strength Index (RSI) values, the indicator highlights situations where one instrument has moved significantly further than the other. This creates potential trading opportunities: Sell the stronger instrument (overstretched RSI) Buy the weaker instrument (lagging RSI) Because the positions are opened
FREE
MSX SuperTrend Visual Indicator Overview MSX SuperTrend Visual Indicator is a MetaTrader 5 indicator designed to display trend direction and market structure using a SuperTrend-based calculation with optional filtering components. The indicator combines trend visualization, volatility measurement and optional EMA-based filtering to provide a clear graphical representation of market conditions. Features • SuperTrend-based trend visualization • ATR-based volatility calculation • Optional Heikin A
FREE
概要 RainbowVolumeProfile は、指定したバー数の範囲における 価格帯別のティック出来高(Volume Profile) を表示するインジケーターです。 主要な出来高集中帯(POC)を上位5つまで自動検出し、 カラフルなヒストグラム として描画します。 計算は非常に軽量で、リアルタイム更新にも対応しています。 主な特徴 上位5つのPOC(Point of Control)を自動検出・色分け表示 チャート右端に水平ヒストグラムとして描画 時間足を指定して分析(M1〜H4など自由) 新しいバーの出現に応じて自動更新 描画オブジェクトは自動管理(再描画・削除処理付き) 軽量なアルゴリズム構成でスムーズに動作 ️ パラメータ設定 パラメータ名 説明 デフォルト値 CaluculationBars 計算対象とするバー数 120 PriceResolution 価格分割数(ヒストグラム解像度) 25 VolumeProfileWidth プロファイル描画幅(ピクセル) 180 VolumeColor 通常のボリュームカラー WhiteSmoke VolumeColo
FREE
Rolling vwap atr market panel
Florian Alain Bernard Jean-paul Pierre Cuiset
Rolling VWAP + ATR Bands + Market Panel — powerful visual tool for scalping, extensions detection and intraday market structure analysis. Rolling VWAP + Panel Rolling VWAP + Panel is a professional MetaTrader 5 indicator designed to analyze market structure using a Rolling Volume Weighted Average Price (VWAP) combined with ATR-based volatility bands , a real-time market analysis panel , and an integrated candle countdown timer . This indicator provides a clear and structured view of price beha
FREE
MultiTimeAnchor MA は、市場をよりスマートで簡単に分析するための新しい味方です!この無料インジケーターは、 3つの異なる移動平均線 を表示し、それぞれが独自の時間軸に調整されています。これにより、 短期、中期、長期 の市場の動きを一度に見ることができ、チャートを切り替える必要はありません。 シンプル移動平均、指数平滑移動平均、平滑移動平均、加重移動平均など、いくつかの異なる移動平均の種類を選択できます。さらに、計算に使用する価格( 始値、高値、安値、または終値 )を選択できます。この柔軟性により、より詳細で正確な市場の把握が可能になり、トレンドやエントリーポイント、エグジットポイントを特定するのに役立ちます。効率的に賢い取引判断をしたい方に最適です!
FREE
Deriv Synthetic HTF Candle Projection GMT2 Higher Timeframe Candle Projection & Previous Levels Tool for Deriv Synthetic Indices (MT5) Overview Deriv Synthetic HTF Candle Projection GMT2 is a professional MetaTrader 5 indicator built specifically for Deriv Synthetic indices . It projects the current forming Higher Timeframe (HTF) candle onto the chart and automatically draws key reference levels from previous candles. This indicator is designed to help traders maintain higher timeframe context
FREE
このプロダクトを購入した人は以下も購入しています
Neuro Poseidon is a new indicator by Daria Rezueva. It combines precise trading signals with adaptive TP/SL levels - creating best possible trades as a result! Message me and get  Neuro Poseidon Assistant  as a gift to automize your trading process! What makes it stand out? 1. Proven profitability on all assets and timeframes 2. Only confirmed BUY and SELL signals present on the chart 3. Adaptive TP & SL levels generated by the software for each trade 4. Easy to understand - suitable for al
SuperScalp Pro
Van Minh Nguyen
4.68 (28)
SuperScalp Pro – プロフェッショナル多層コンフルエンス・スキャルピングシステム SuperScalp Proは、インテリジェントなマルチファクター確認システムを通じて高確率の取引機会を特定するために設計された、プロフェッショナルなマルチレイヤー・コンフルエンストレーディングシステムです。Supertrend、VWAP、EMA、RSI、ADX、出来高分析、ボリンジャーバンド、およびMACDダイバージェンスを統合することで、低品質なセットアップを排除し、ダマシのブレイクアウトシグナルを減らし、エントリー精度を向上させます。 XAUUSD、BTCUSD、および主要なForex通貨ペア向けに特別に最適化されたSuperScalp Proは、ATRベースのボラティリティロジックとルールベースのシグナル検証を通じて市場環境の変化に適応し、M1からH4までの複数時間足で一貫性と客観性のある取引確認を提供します。 内蔵されたスマートコントロールパネルにより、リアルタイムで完全なカスタマイズが可能です。トレーダーは個別の確認フィルターを有効または無効にし、市場環境、取引スタイル、リスク許
M1 Quantum を使用したライブトレードシグナル : シグナル 価格プラン: 現在価格: $149 (早期購入者向けオファー) 次回予定価格: $169 予定小売価格: $299 開発者からのお知らせ: ご購入後、 最新の推奨設定ファイル(Set File) 、運用アドバイス、および他の M1 Quantum ユーザーと交流できる VIPサポートグループ への招待をご希望の場合は、お気軽にご連絡ください。 M1 Quantum は、M1専用のプロフェッショナルトレーディングシステムであり、ストップロス、テイクプロフィット、スマートな資金管理を内蔵した、迅速かつ正確な取引シグナルを提供します。 M1 Quantum は、 連続勝利 に重点を置いて口座を素早く成長させるために設計されたプロフェッショナルな資金管理を備えています。 M1 Quantum インジケーター の主な特徴 M1時間足 およびすべての 主要通貨ペア 向けに設計 すべての取引にストップロスとテイクプロフィットを設定 資金管理 を実装し、トレーダーが簡単に取引できるようサポート 高い勝率と高い 連続勝利 リペイント
まず正直に言いましょう。 どんなインジケーターも、それ単体であなたを利益化させることはできません。もしそう言う人がいるなら、それは夢を売っているだけです。完璧な売買シグナル(矢印)を表示するインジケーターは、いくらでも“完璧に見せる”ことができます。正しい過去の区間を拡大して、勝ちトレードだけを切り取ればいいだけです。私たちはそれをしません。 SMC Intraday Formula はツールです。 市場構造を読み取り、最も高い確率の価格ゾーンを特定し、今この瞬間のスマートマネーの痕跡をシンプルな言葉で正確に示します。最終判断はあなたが行います。トレードを実行するのもあなたです。しかし今は「希望」ではなく「精度」でエントリーできます。 私たちはこのインジケーターを、ゴールド(XAUUSD)および主要FX通貨ペアで約3年間、日々のスキャルピングに使用してきました。M1、M5、M15、M30の主要ツールです。これは未来を予測しようとするのではなく、今まさに形成されている高確率セットアップを示し、その理由を説明します。 他のすべてのインジケーターと何が違うのか? ほとんどのトレーディングイ
Gold Entry Sniper – ゴールドスキャルピング&スイングトレード用プロフェッショナル多時間足ATRダッシュボード Gold Entry Sniper は、XAUUSDや他の銘柄向けに正確な 売買シグナル を提供する、MetaTrader 5用の高度なインジケーターです。 ATRトレーリングストップロジック と 多時間足分析ダッシュボード を搭載し、スキャルピングからスイングトレードまで対応します。 主な特徴と利点 多時間足シグナル分析 – M1、M5、M15 のトレンドを同時表示。 ATRベースのトレーリングストップ – ボラティリティに応じて動的に調整。 プロ仕様のチャートダッシュボード – シグナル状況、ATRレベル、回帰線、売買方向を表示。 明確な売買マーカー – 自動矢印とテキストラベル。 エグジットアラートとトレード管理 – 利益確定のための自動検出。 完全カスタマイズ可能 – パネル位置、色、フォント、ATR/回帰設定を調整可能。 ゴールド(XAUUSD)に最適化 – M1〜M15のスキャルピングに最適、FXや指数、暗号資産にも対応。 Gold Entry
Entry In The Zone and SMC Multi Timeframe is a real-time 2-in-1 market analysis tool that combines market structure analysis and a No Repaint BUY / SELL signal system into a single indicator, built on Smart Money Concepts (SMC) — a widely adopted framework used by professional traders to understand market structure. This indicator helps you see the market more clearly, make decisions based on structure rather than guesswork, and focus on high-probability zones where price is more likely to react
この製品は 2026 年の市場向けに更新され、最新の MT5 ビルドに最適化されています。 価格更新のお知らせ: Smart Trend Trading System は現在 $99 で提供されています。 次の 30 件の購入 後、価格は $199 に上がります。 特別オファー: Smart Trend Trading System を購入後、私にプライベートメッセージを送ることで、 Smart Universal EA を無料 で受け取り、Smart Trend のシグナルを自動売買に変えることができます。 Smart Trend Trading System は、リペイントなし、再描画なし、遅延なしの完全なトレーディングシステムです。よりクリーンなシグナル、より明確なトレンド方向、そしてより整理された取引方法を求めるトレーダー向けに作られています。 Online course , manual and [download presets] . このシステムは、トレンド検出、反転ゾーン、Smart Cloud、トレーリングストップロジック、サポートとレジスタンス、ローソク足の色分け
このインジケーターを購入された方には、以下の特典を 無料 で提供しています: 各トレードを自動で管理し、ストップロスとテイクプロフィットを設定し、戦略ルールに基づいてポジションを決済する補助ツール 「Bomber Utility」 様々な銘柄に合わせたインジケーターの設定ファイル(セットファイル) 「最小リスク」、「バランスリスク」、「待機戦略」 の3つのモードで使用できる Bomber Utility 用の設定ファイル このトレーディング戦略をすぐに導入・設定・開始できる ステップバイステップのビデオマニュアル ご注意: 上記の特典を受け取るには、MQL5のプライベートメッセージシステムを通じて販売者にご連絡ください。 オリジナルのカスタムインジケーター 「Divergence Bomber(ダイバージェンス・ボンバー)」 をご紹介します。これは、MACDのダイバージェンス(乖離)戦略に基づいた 「オールインワン」型のトレーディングシステム です。 このテクニカルインジケーターの主な目的は、価格とMACDインジケーターの間に発生するダイバージェンスを検出 し、将来の価格の動きを示す
Trend Sniper X
Sarvarbek Abduvoxobov
5 (2)
Trend Sniper X は、MetaTrader 5 用のマルチタイムフレーム・トレンドフォロー・インジケーターです。トレーダーがトレンドの方向性と反転ポイントを明確かつ正確に特定できるよう支援します。 価格情報: 現在の価格はキャンペーン価格であり、今後のアップデートや新機能のリリースに伴い変更される可能性があります。 Code2Profit チャンネル   マルチタイムフレーム分析で市場をマスターしよう!   Trend Sniper X:体系的な市場分析とアップデート   技術仕様 プラットフォーム MetaTrader 5 インジケータータイプ マルチタイムフレーム・トレンドインジケーター 操作タイムフレーム あらゆるチャートタイムフレームに対応。個別に選択可能な上位タイムフレーム (M1–MN1) を搭載 主要銘柄 FX、ゴールド (XAUUSD)、およびその他のCFD 推奨口座 あらゆる口座タイプに対応 視覚化 色分けされたトレンドローソク足 (買い/売り/弱気/変化) + 買い/売り矢印 追加モジュール セッション市場ボックス (シドニー、東京、ロンドン、ニューヨー
Gann Made Easy   は、ミスター・ギャンの理論を使用した取引の最良の原則に基づいた、プロフェッショナルで使いやすい外国為替取引システムです。 W・D・ガン。このインジケーターは、ストップロスとテイクプロフィットレベルを含む正確な買いと売りのシグナルを提供します。 PUSH通知を利用して外出先でも取引可能です。 ご購入後、取引方法の説明と優れた追加インジケーターを無料で入手するには、私にご連絡ください! おそらく、ギャンの取引手法についてはすでに何度も聞いたことがあるでしょう。通常、ギャンの理論は初心者のトレーダーだけでなく、すでにある程度の取引経験がある人にとっても非常に複雑なものです。なぜなら、ギャンの取引手法は理論的にはそれほど簡単に適用できるものではないからです。私はその知識を磨き、最良の原則を私の外国為替インジケーターに組み込むために数年を費やしました。 このインジケーターは非常に簡単に適用できます。必要なのは、それをチャートに添付し、簡単な取引推奨事項に従うだけです。このインジケーターは常に市場分析の仕事を行い、取引の機会を探します。適切なエントリーポイントを検
Power Candles V3 - 自己最適化型強弱インジケーター Power Candles V3は 、通貨や銘柄の強さを、適用されたすべてのチャート上で実行可能なトレードプランに変換します。単にローソク足を色分けするだけでなく、バックグラウンドでリアルタイムの自動最適化を実行し、目の前の銘柄に対して最適なストップロス、テイクプロフィット、およびシグナルの閾値を提示します。ワンクリックで実取引に適用でき、エントリーポイント、ストップロス、テイクプロフィットのラインが正確な価格位置にチャート上に表示され、方向性を示すアラートがリアルタイムで発動します。 このツールは、Stein Investmentsのエコシステムの一部です。  18種類以上のツールをすべて閲覧し、AIを活用したセットアップの推奨事項を入手し、  https://stein.investments でコミュニティに参加しましょう クローズしたバーごとに3,000回以上のトレードシミュレーション。9つの強さの状態。2つの戦略を並行してテスト。勝率の高い設定をワンクリックで適用。 なぜこれが必要なのか ほとんどの強
トレンドキャッチャーインジケーター トレンドキャッチャーインジケーターは、開発者独自の適応型トレンド分析指標を組み合わせることで、市場価格の動きを分析します。短期的なノイズを除去し、根底にあるモメンタムの強さ、ボラティリティの拡大、価格構造の挙動に焦点を当てることで、真の市場方向性を特定します。また、移動平均線、RSI、ボラティリティフィルターなどの平滑化およびトレンドフィルタリング機能を備えたカスタマイズ指標も使用します。 実際の運用状況のモニタリングやその他の製品については、こちらをご覧ください: https://www.mql5.com/en/users/mechanic/seller ご注意ください。私はTelegramでEAや設定を販売していません。詐欺です。すべての設定はブログで無料で公開しています。 重要!ご購入後すぐにご連絡ください。手順とボーナスをお送りします!
UZFX {SSS} スキャルピング・スマートシグナル v4.0 MT5は、変動の激しい市場において正確かつリアルタイムのシグナルを求めるスキャルパー、デイトレーダー、スイングトレーダー向けに設計された、リペイントのない高性能な取引インジケーターです。(UZFX-LABS)によって開発されたこのインジケーターは、価格行動分析、トレンド確認、スマートフィルタリングを組み合わせることで、すべての通貨ペアおよび時間軸において、高確率の売買シグナル、警告シグナル、トレンド継続の機会を生成します。 トレードの判断に迷うのはもうやめましょう。明確さ、正確さ、そして規律ある市場執行を求めるトレーダーのために設計された、体系的なシグナルシステムに従い始めましょう。 私のおすすめ* 最適な時間足:15分足以上。 {H1} が私のお気に入りです。そして、その成果は驚異的です…!! 主な機能の更新 • 自動売買シグナル検出 • 高度な反転認識ロジック • 市場反転の可能性に先立つ早期警告シグナル • トレンド継続確認シグナル • エントリー、ストップロス、TP1、TP2、TP3レベルを備えた組み込み型
このインジケーターは、市場で 関心が示されたゾーン をハイライトし、その後に 注文の蓄積ゾーン を表示します。 これは、大規模な**板情報(オーダーブック)**のように機能します。 これは、 巨大な資金 のためのインジケーターです。その性能は卓越しています。 市場にどんな関心が存在していても、 必ず目に見えるようになります 。 (これは 完全に再設計され、自動化されたバージョン です。もはや手動分析は必要ありません。) トランザクションスピード(取引速度) は新しい概念のインジケーターで、市場で大口注文が どこに・いつ 集中しているかを示し、それに基づいたチャンスを提供します。 トレンドの変化を 非常に早い段階 で察知することができます。 FXでは「出来高」と呼ばれているものは誤解されています。実際には、これは 時間あたりの価格変動量 です。したがって、正しい名称は トランザクションスピード です。 考え方・行動・分析の仕方すべてが問われます。 分析パラダイムの転換は非常に重要です。 このインジケーターは、FXにおける出来高の考え方を 根本から再定義 し、論理的な形で正確に活用する、
GEM Signal Pro GEM Signal Pro は、MetaTrader 5 向けのトレンドフォロー型インジケーターです。より明確なシグナル、より整理されたトレードセットアップ、そして実用的なリスク管理をチャート上で確認したいトレーダーのために設計されています。 単純な矢印だけを表示するのではなく、GEM Signal Pro はトレード全体の考え方を、より見やすく分かりやすい形で表示します。条件が確認されると、インジケーターはエントリー価格、ストップロス、利確目標をチャート上に表示し、トレードセットアップをより効率的に確認できるようにします。 動作の仕組み このインジケーターは、まず内部ロジックに基づいて有効なシードシグナルを検出します。 確認条件が満たされると、GEM Signal Pro はチャート上に完全なセットアップを表示します。これにより、トレーダーはトレード構造をより明確に把握し、手作業による分析を減らすことができます。 チャート上のトレードレベル 確認済みシグナルに対して、GEM Signal Pro は以下を表示できます。 エントリー価格 ストップロス テ
AXIOM MATRIX MT5 ローンチ価格:$99 Axiom Matrix はローンチ価格 $99 でご利用いただけます。 最初の30件の購入後、価格は $199 に上がります。 Axiom Matrix は、MetaTrader 5 用のプロフェッショナルなマルチシンボル・マルチタイムフレーム市場スキャナー兼意思決定ダッシュボードです。 Market Watch をスキャンし、複数の時間足を分析し、複数のエビデンスエンジンを読み取り、最も強いチャンスを比較し、1つのクリーンなマトリックスダッシュボード内で最適な BUY、SELL、WAIT、またはブロック状態を表示します。 私が Axiom Matrix を作った理由は、市場スキャンという重い作業を代わりに行ってくれる1つのツールが欲しかったからです。 RSI だけを確認したくありませんでした。 次に MACD だけ。 次に移動平均線。 次に出来高。 次にボラティリティ。 次にサポートとレジスタンス。 そして、1つのトレードアイデアを作るためだけに、銘柄と時間足を手動で切り替えることもしたくありませんでした。 私は、市場をスキャ
この製品は 2026 年の市場向けに更新され、最新の MT5 ビルドに最適化されています。 価格更新のお知らせ: Atomic Analyst は現在 $99 で提供されています。 次の 30 件の購入 後、価格は $199 に上がります。 特別オファー: Atomic Analyst を購入後、私にプライベートメッセージを送ることで、 Smart Universal EA を無料 で受け取り、Atomic Analyst のシグナルを自動売買に変えることができます。 Atomic Analyst は、リペイントなし、再描画なし、遅延なしの Price Action トレーディングインジケーターで、手動取引、シグナルの明確化、EA 自動化のために設計されています。 User manual: settings, inputs and strategy.   &   User Manual PDF . 価格行動、強さ、モメンタム、マルチタイムフレーム方向、高度なフィルターを分析し、トレーダーがノイズを減らし、弱いセットアップを避け、より構造化された取引判断を行えるようにします。 このイ
ご紹介     Quantum Breakout PRO は 、ブレイクアウト ゾーンの取引方法を変革する画期的な MQL5 インジケーターです。 13年以上の取引経験を持つ経験豊富なトレーダーのチームによって開発されました。     クォンタム ブレイクアウト プロ   は、革新的でダイナミックなブレイクアウト ゾーン戦略により、あなたのトレーディングの旅を新たな高みに押し上げるように設計されています。 クォンタム ブレイクアウト インジケーターは、5 つの利益ターゲット ゾーンを備えたブレイクアウト ゾーン上のシグナル矢印と、ブレイクアウト ボックスに基づいたストップロスの提案を提供します。 初心者トレーダーにもプロのトレーダーにも適しています。 量子EAチャネル:       ここをクリック 重要!購入後、インストールマニュアルを受け取るためにプライベートメッセージを送ってください。 推奨事項: 時間枠: M15 通貨ペア: GBPJPY、EURJPY、USDJPY、NZDUSD、XAUUSD アカウントの種類: ECN、Raw、またはスプレッドが非常に低い R
ARIPoint
Temirlan Kdyrkhan
1 (1)
ARIPoint is a powerful trading companion designed to generate high-probability entry signals with dynamic TP/SL/DP levels based on volatility. Built-in performance tracking shows win/loss stats, PP1/PP2 hits, and success rates all updated live. Key Features: Buy/Sell signals with adaptive volatility bands Real-time TP/SL/DP levels based on ATR Built-in MA Filter with optional ATR/StdDev volatility Performance stats panel (Success, Profit/Loss, PP1/PP2) Alerts via popup, sound, push, or email Cu
The Oracle Pro:MT5向け合成マルチタイムフレーム・バイアスエンジン ️ サマー・ローンチ・オファー — The Oracle Pro を 199 USD で(早期購入者向け)。価格は普及に応じて上昇します。最終価格 399 USD。 The Oracle Pro は、要求の高いプロのトレーダーのために作られた MetaTrader 5 向けのプレミアム・マルチタイムフレーム バイアスエンジン です。ひとつの問いに規律をもって答えます。すなわち、各タイムフレームの現在の方向バイアスは何か、その強さはどれほどか、そしてタイムフレーム同士はどれだけ一致しているか。すべては確定足のみで計算され、リペイントはありません。 The Oracle Pro はマルチファクター・コンセンサス・システムです。独自のインジケーターと最適化されたアルゴリズムを単一の高度なコンセンサス・ベクトルに統合し、それを単一のインジケーター・インスタンス内で現在足と上位足のスタックにわたって読み取ります。複数のチャートにばらばらのツールを積み重ねる代わりに、です。 これは Oracle コンセンサス手法
Quantum TrendPulse を ご紹介します。これは、   SuperTrend   、   RSI   、および Stochastic のパワーを 1 つの包括的なインジケーターに組み合わせて、取引の可能性を最大限に引き出す究極の取引ツールです。精度と効率を求めるトレーダー向けに設計されたこのインジケーターは、市場のトレンド、勢いの変化、最適なエントリー ポイントとエグジット ポイントを自信を持って特定するのに役立ちます。 主な特徴: SuperTrend 統合: 現在の市場動向に簡単に追従し、収益性の波に乗ることができます。 RSI精度: 買われすぎと売られすぎのレベルを検出し、市場の反転のタイミングに最適で、SuperTrendのフィルターとして使用されます。 確率的精度: 確率的振動を活用して、変動の激しい市場で隠れたチャンスを見つけます。SuperTrend のフィルターとして使用されます。 マルチタイムフレーム分析:   M5 から H1 または H4 まで、さまざまなタイムフレームで市場を常に把握します。 カスタマイズ可能なアラート: カスタム取引条件が満たされ
FX Trend NG:次世代マルチマーケット・トレンドインテリジェンス 概要 FX Trend NG は、複数の時間足に対応したプロフェッショナル向けトレンド分析およびマーケット監視ツールです。 市場全体の構造を数秒で把握することができます。 複数のチャートを切り替える必要はありません。どの銘柄がトレンド中なのか、どこでモメンタムが弱まっているのか、そしてどの時間足で強い整合性があるのかを瞬時に確認できます。 ローンチ特別オファー – FX Trend NG を $30(6ヶ月) または $80 永久ライセンス でご利用いただけます。 すでに Stein Investments のユーザーですか? -> メッセージを送信 して、プライベートグループへアクセスしてください。 セットアップや詳細情報が必要ですか? -> Stein Investments 公式ページ をご覧ください。 1. FX Trend NG が他と異なる理由 3ステート・トレンドロジック ― Buy と Sell だけではない • 多くのインジケーターは Buy または Sell の2状態のみを表示します。
FX Power: 通貨の強弱を分析して、より賢い取引を実現 概要 FX Power は主要通貨と金の実際の強弱をあらゆる市場状況で理解するための必須ツールです。強い通貨を買い、弱い通貨を売ることで、 FX Power は取引の意思決定を簡素化し、高い確率の取引機会を見出します。トレンドを追従する場合でも、極端なデルタ値を使用して反転を予測する場合でも、このツールはあなたの取引スタイルに完全に適応します。ただ取引するだけではなく、 FX Power で賢く取引をしましょう。 1. なぜ FX Power がトレーダーにとって非常に有益なのか 通貨と金のリアルタイム強弱分析 • FX Power は主要通貨と金の相対的な強弱を計算し、マーケットダイナミクスに関する明確な洞察を提供します。 • どの資産がリードしているか、または後れを取っているかを監視して、取引するペアを賢く選びましょう。 マルチタイムフレームの包括的なビュー • 短期、中期、長期のタイムフレームで通貨と金の強弱を追跡し、マーケットトレンドに基づいて取引戦略を調整できます。 • スキャルピングからスイングトレード
Current event:  https://c.mql5.com/1/326/A2SR2025_NoMusic.gif MT5向けA2SR インジケーター:自動実需給(S/R)。 + 取引商品。 Product description in English here. --   Guidance   : -- at   https://www.mql5.com/en/blogs/post/734748/page4#comment_16532516 -- and  https://www.mql5.com/en/users/yohana/blog 強力で信頼性が高く、時間を節約。よりスマートな取引判断を実現。 + EA互換オブジェクト。 主な利点 先行する実SRレベル(遅延やリペイントなし) 2014年以来、MT4で長年にわたり信頼性が実証されてきたA2SRが 、MetaTrader 5でも利用可能になりました。 価格がサポートレベルとレジスタンスレベルに到達する前に、実際のサポートレベルとレジスタンスレベルを特定できる、リペイントなしの先行インジケーターにより、トレー
GoldenX Entryは、MT5向けのインジケーターであり、適応型Smart Entry Trendアルゴリズム、シグナルスコアリングシステム、マーケットレジーム検出機能、およびボラティリティフィルターを備えています。各シグナルには、計算されたエントリーレベル、3つのテイクプロフィット(TP1、TP2、TP3)、およびストップロスレベルが含まれます。本インジケーターは、異なる市場環境に適応するために設計された複数の分析レイヤー上に構築されており、マルチレイヤー分析システムと内蔵オプティマイザーおよび統計トラッキングシステムを組み合わせています。リスク・リワード(RR)指標および過去のトレード履歴に基づく定量分析を提供します。 使い始めは簡単です — 選択した時間足でオプティマイザーを実行し、そのままチャート上でインジケーターを使用します。 コア機能 GoldenX Entryは、シグナルエンジンとトレード管理機能、そして過去統計トラッキングを1つのチャートに統合しています: - 内蔵オプティマイザー: オプティマイザーはチャート上でワンクリックで実行できます。200通りのパラメー
Azimuth Pro
Ottaviano De Cicco
5 (7)
Azimuth Pro V2:MT5向けシンセティック・フラクタル構造分析と確認済みエントリー 概要 Azimuth Pro は Merkava Labs によるマルチレベルスイング構造インジケーターです。4つのネストされたスイングレイヤー、スイングアンカーVWAP、ABCパターン検出、3タイムフレーム構造フィルタリング、そして確定バーでの確認済みエントリー — 1つのチャートで、ミクロスイングからマクロサイクルまでを網羅するワークフロー。 これはブラインドシグナル製品ではありません。ロケーション、コンテキスト、タイミングを重視するトレーダーのための構造ファーストワークフローです。 ️ サマーセール — 夏至とThe Oracle Proの発売を記念して、Azimuth Proが30%オフ。現在279 USD(通常399 USD)。期間限定の夏季オファー。 1. V2での変更点 シンセティック・マルチタイムフレームエンジン 上位タイムフレーム分析をMeridian Proと同じ独自のシンセティックアーキテクチャで一から再構築。よりクリーンなHTFコンテキスト、安定したライブ動作、
BTMM State Engine Pro is a MetaTrader 5 indicator for traders who use the Beat The Market Maker approach: Asian session context, kill zone timing, level progression, peak formation detection, and a multi-pair scanner from a single chart. It combines cycle state logic with a built-in scanner dashboard so you do not need the same tool on many charts at once. What it does Draws the Asian session range; session times can follow broker server offset or be set in inputs. Tracks level progression (L
Quant Direction は、3次元の市場分析ツールです。完全に客観的なアルゴリズムベースの市場分析を提供し、様々なパラメータにわたる正確なパーセンテージ偏差を同時に算出します。高度なAI搭載モデリングツールで開発され、厳密なテストを経て開発されたこのアルゴリズムは、かつてない精度で市場を分析するように設計されています。プラットフォーム上では、あらゆる通貨ペアや金融商品を分析できます。 短期取引、デイトレード、スイングトレードなど、どのような取引スタイルに も、Quant Directionは最適な選択肢です。 オペレーターの本当の利点 Quant Directionの真の利点は、感情、眼精疲労、過剰分析を完全に排除できる点にあります。方向性を探るために何十ものチャートを手作業で精査したり、自分の好みを常に疑ったりする必要がなくなります。このシステムは、8つの時間間隔(5ヶ月から月単位まで)をミリ秒単位で処理します。あらゆる瞬間に市場を支配している主体を正確に明らかにし、常に成功確率が最も高い方向で取引できるようにします。 市場分析の3つの側面 このアルゴリズムは市場を3つの
この製品は 2026 年の市場向けに更新され、最新の MT5 ビルドに最適化されています。 価格更新のお知らせ: Smart Price Action Concepts は現在 $200 で提供されています。 次の 30 件の購入 後、価格は $299 に上がります。 特別オファー: 購入後、私にプライベートメッセージを送ることで、 無料ボーナス + ギフト を受け取ることができます。 まず、このトレーディングツールはリペイントなし、再描画なし、遅延なしのインジケーターであり、プロフェッショナルな取引に最適であることを強調しておきます。 Online course , and manual Smart Price Action Concepts Indicator は、初心者から経験豊富なトレーダーまで使える非常に強力なツールです。20 種類以上の便利なインジケーターを 1 つにまとめ、Inner Circle Trader Analysis や Smart Money Concepts Trading Strategies などの高度な取引アイデアを組み合わせています。このインジケ
Reversion King Indicator
Eugen-alexandru Zibileanu
5 (5)
新たな王者が登場 - インジケーター + 注文管理表示(TP1 + TP2 + TP3)+ オプションのTelegramシグナル送信機能付き(無料) (完全なトレード&シグナルシステム) ゴールド向け最高のEA: Gold Slayer このインジケーターには、高度な戦略、カスタマイズ可能な注文管理システム、そしてエンベロープ拡張を組み合わせた平均回帰システムが搭載されています。さらに、RSIなど複数のインテリジェントな確認フィルターによって、高確率の反転エントリーをBUY・SELLシグナルとして検出します。 単にトレードを学ぶだけでなく、複数ポジションを効果的に管理し、過去に利益を出しているオープンポジションで損失トレードをカバーする方法も学べます。 M5向けに構築・最適化されており、流動性が高くシグナルの精度が安定しているBTCUSDとXAUUSDで優れたパフォーマンスを発揮します。 このインジケーターは、ATRを基に自動計算されたエントリー、ストップロス、テイクプロフィットレベルを備えた明確なLong・Shortシグナルを提供するため、リスク管理が最初から組み込まれています。 マ
作者のその他のプロダクト
Short Description Yesterday H/L, Today H/L and ADR% on any chart. Color-coded gradient signals overextension at a glance. Full Description Mattrix Day Levels is a clean, lightweight indicator that displays the four key reference levels every day trader needs: Yesterday High and Low (YH, YL) Today High and Low (TH, TL) Average Daily Range percentage (ADR%) Drawn directly on the chart, the indicator marks the current trading day's progression against its historical range. The today range is shown
FREE
MATTRIX Synthetic Charts creates 11 fully functional Custom Symbols from the 28 Forex major pairs available on any standard MT5 broker. CREATED SYMBOLS: Currency Indices (geometric mean of 7 pairs each):   #EUR  #GBP  #AUD  #NZD  #USD  #CAD  #CHF  #JPY Risk Baskets (geometric mean of 8 pairs each):   #RON    "Risk-On"  basket   #ROFF   "Risk-Off" basket (visually flipped) Diversification Basket:   #FIX   Combined long-bias index of all 28 majors USAGE: 1. Attach the EA to any active major pai
FREE
Mattrix Basket Viewer Mattrix Basket Viewer creates 8 synthetic currency index charts directly in MetaTrader 5 using geometric mean calculation.  It analyzes all 28 major forex pairs and groups them into 8 currency baskets, one for each major currency. Instead of watching 28 individual pairs, you see 8 clean basket charts that reveal the true strength of each currency.  A compact dashboard shows real-time pip sums, coherence and direction for each basket.  Click any basket name to open its char
Short Description On-chart strength analysis for synthetic currency baskets. Shows pair breakdown, coherence, pip sum and signal label directly on basket charts. Full Description Mattrix Basket Strength is an on-chart indicator designed for synthetic currency basket charts. It displays real-time strength analysis directly on the chart of any of the 8 major currency baskets (EUR, GBP, AUD, NZD, USD, CAD, CHF, JPY). What it shows When attached to a basket chart such as #USD, the indicator breaks
MATTRIX Position Monitor An 8x8 currency matrix dashboard that gives you a live overview of all  your open positions across the 28 Forex majors in one compact panel.  Designed for traders who manage multiple currency exposures and want  to see direction, hedging, profit, and risk at a glance. WHAT YOU SEE: The 8x8 matrix is organized by the Big8 currency hierarchy: EUR, GBP, AUD, NZD, USD, CAD, CHF, JPY. - Lower triangle (28 cells): one cell per Forex major pair   Cell color = direction:    
Mattrix Risk Meter A risk sentiment indicator that visualizes the Risk-On / Risk-Off sentiment in the Forex market by comparing two synthetic currency baskets. Designed for traders who want to understand the broader market mood beyond individual pair movements. WHAT IT SHOWS: The indicator plots two normalized lines in a separate window:   RON  (white line)  — Risk-On basket of 8 high-beta currency pairs   ROFF (red line)    — Risk-Off basket of 8 safe-haven pairs (inverted) When the lines mov
Mattrix One Click Basket Trade A one-click trade panel for Forex basket trading on MetaTrader 5. Open, manage, and close baskets of currency pairs with a single click — built for traders who manage multiple currency exposures at once instead of single pairs. WHAT MAKES IT DIFFERENT: Standard one-click panels trade only the current chart symbol. This panel extends one-click execution to four basket modes: - PAIR mode: trade the chart symbol (any of 28 Forex majors) - BIG8 mode: trade 7 pairs o
Mattrix Cockpit — read market structure at a glance A multi-timeframe navigation panel for one chart and any symbol. It shows where price sits inside its range, the risk-reward of trading either direction, the trend on every timeframe, and a single weighted directional bias — so you can read the situation in seconds and make your own call. What it shows Range box over the last N candles, drawn from candle bodies so wicks stand out as rejections Upper and lower
フィルタ:
レビューなし
レビューに返信