SuperTrend with TP snd TSL

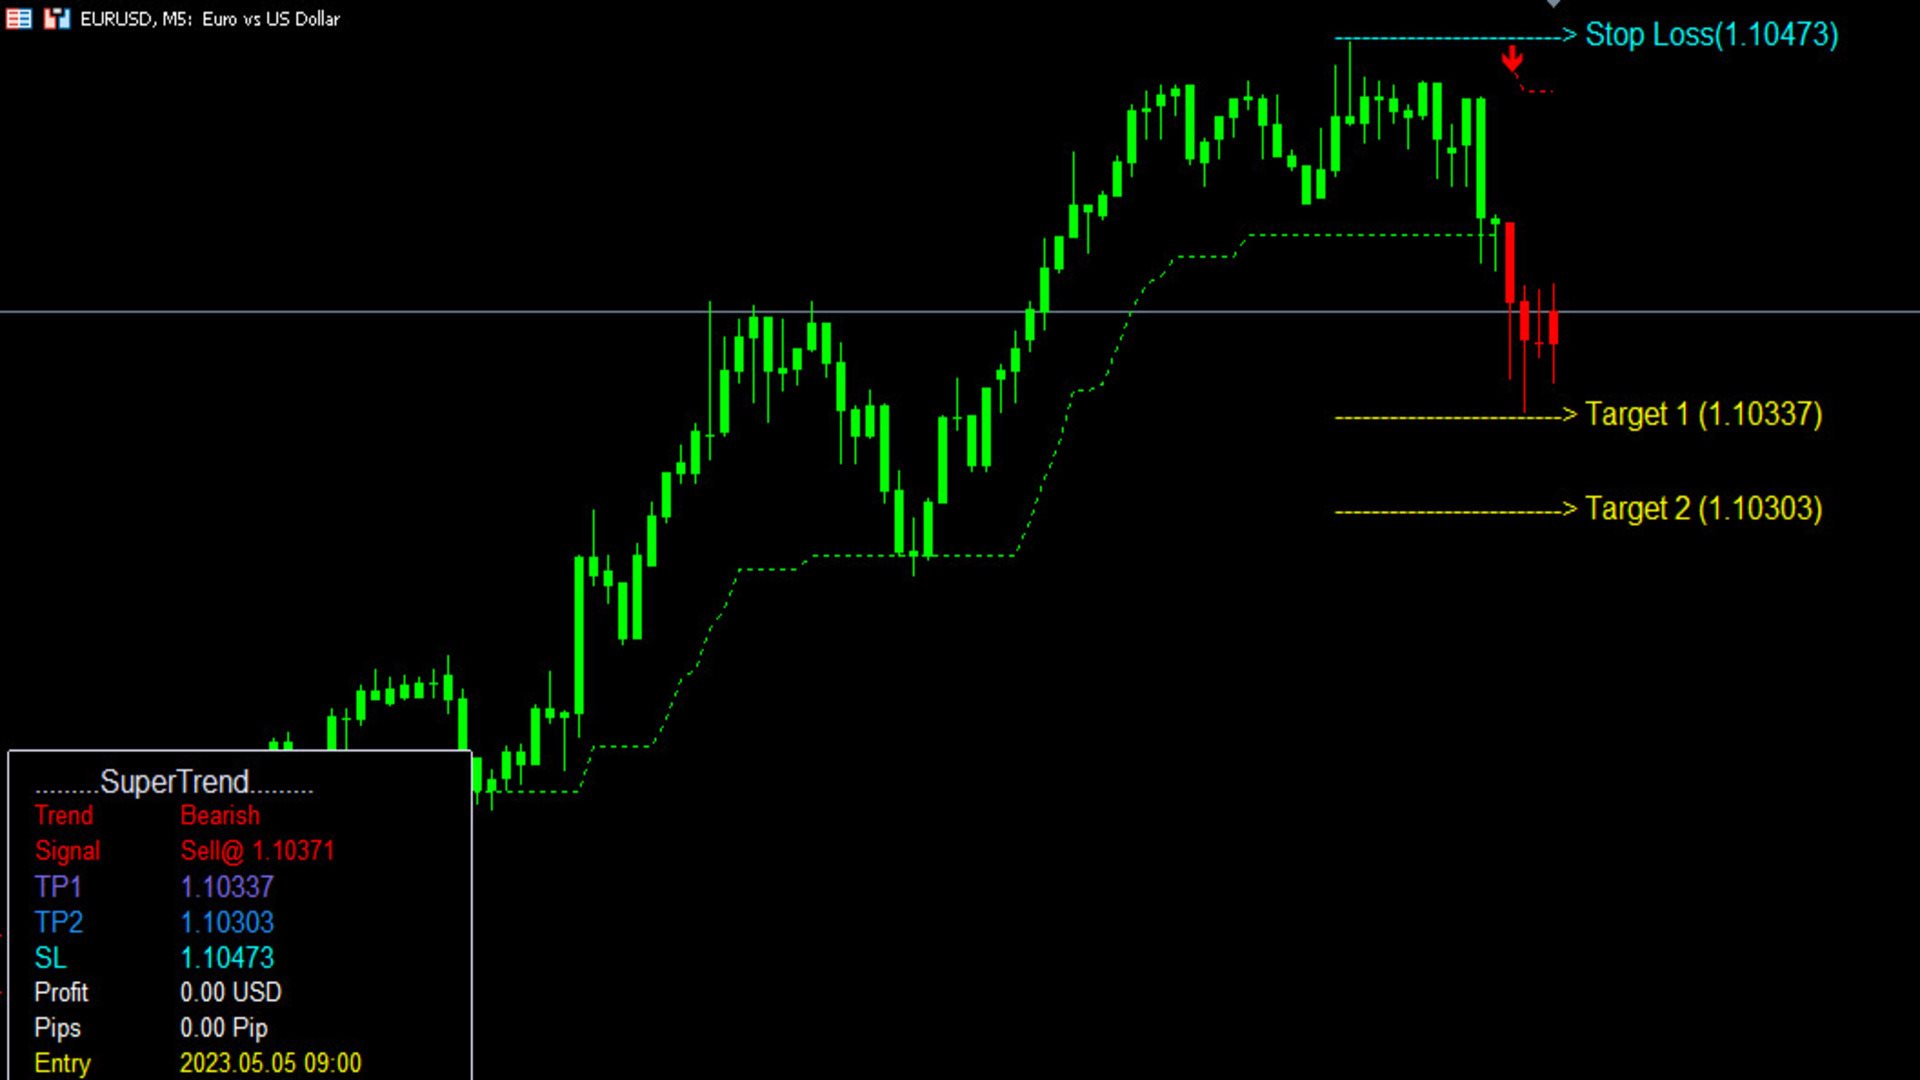
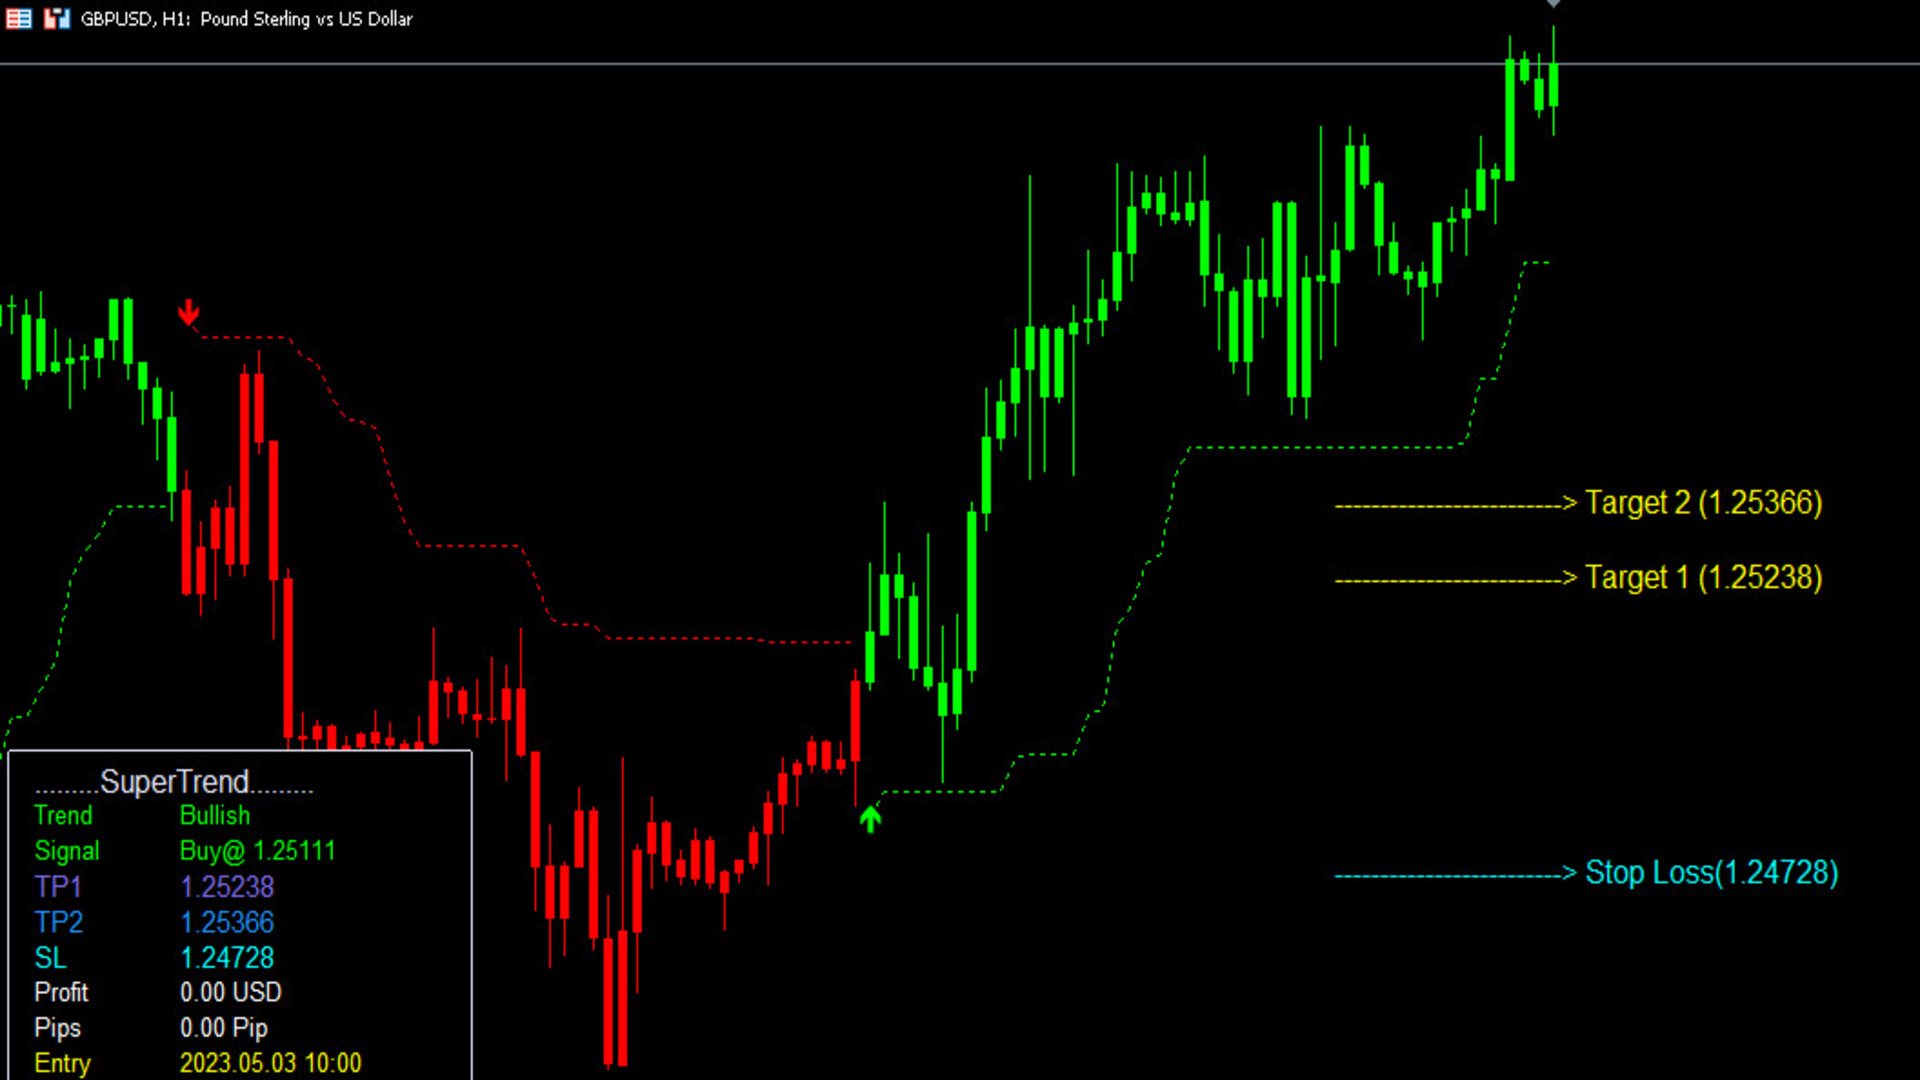
The Super Trend is one of the best trend-following indicator for MT5 platforms. It's working fine for real-time trend alerts and accurate signals and it help to identify the best market entry and exit positions.
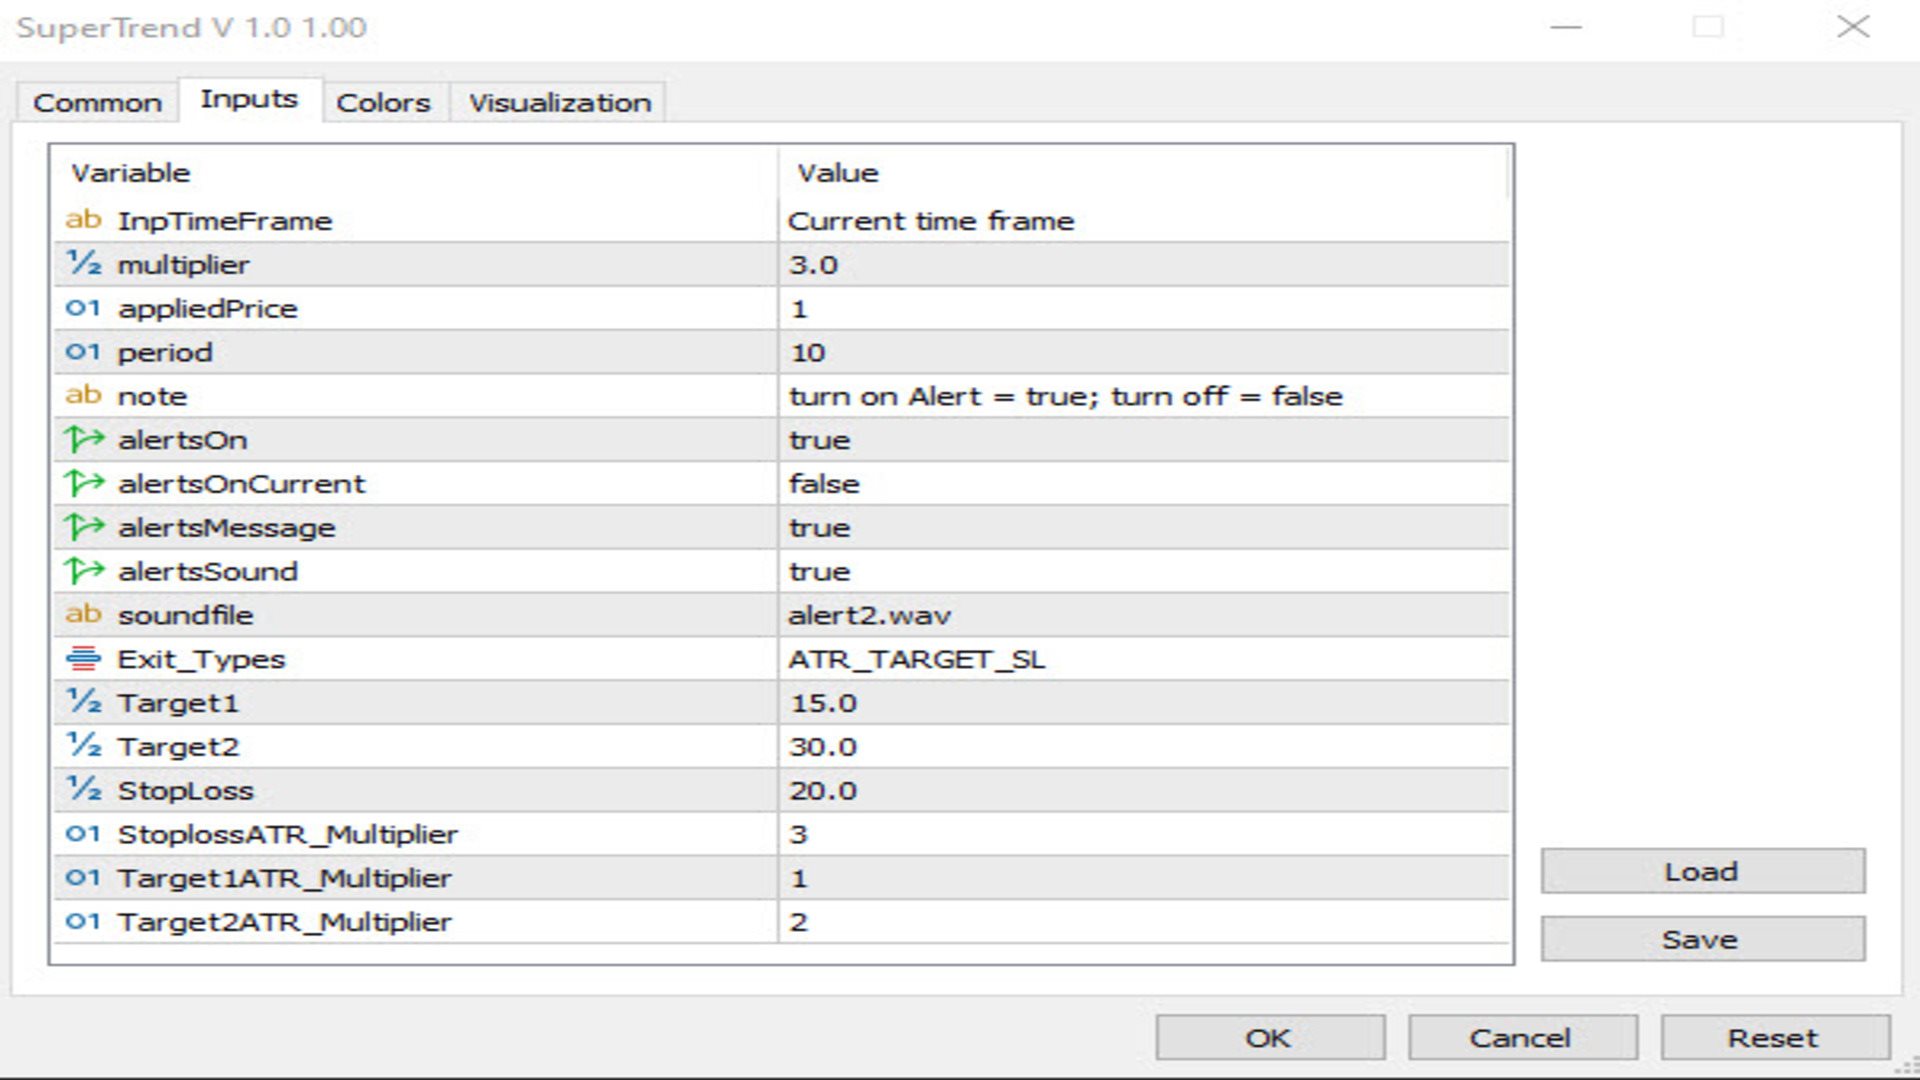
 This indicator is the tool you can  refers to a trend following overlays. It contains two major parameters: the period and the multiplier. Besides, traders should consider default values that include 10 for every true range aтd 3 for the multiplier.
2 Types TP SL you set in input

  • Points based
  • ATR based inputs

おすすめのプロダクト
この情報インジケーターは、アカウントの現在の状況を常に把握したい人にとって役立ちます。 VERSION MT 4 -   More useful indicators このインジケーターには、ポイント、パーセンテージ、通貨での利益、現在のペアのスプレッド、現在の時間枠でバーが閉じるまでの時間などのデータが表示されます。 チャート上に情報線を配置するには、いくつかのオプションがあります。 価格の右側 (価格の後ろにあります)。 コメントとして (グラフの左上隅に); 画面の選択した隅。 情報区切り記号を選択することもできます。 | / \ # このインジケーターは使いやすく、非常に有益です。設定で不要な情報項目を無効にすることも可能です。 設定 外観の種類     - 情報行の表示タイプ。次の 3 つのオプションがあります。 価格に従ってください     - 価格に従う。 コメントとして     - コメントとして; 画面の選択した隅に     - 画面の選択した隅にあります。 添付用グラフコーナー     - 表示タイプを選択した場合 画面の選択されたコーナーでは、この項目を使用して
FREE
平均方向性指数(ADX)マルチカレンシースキャナー MT5 は、複数の通貨ペアを同時に分析するために設計された高度なトレーディングインジケーターです。これは、平均方向性指数に基づくリアルタイムのシグナルを提供することで、意思決定プロセスを強化したいトレーダーに利益をもたらし、効率的な市場トレンド分析を可能にします。 このツールは、トレンドの強さと方向の動きを簡単に特定できるようにし、ADXに基づく戦略を採用するトレーダーにとって不可欠な資産となっています。リアルタイムのアラートとユーザーフレンドリーなダッシュボードを備え、トレーダーは市場の状況を迅速に評価し、情報に基づいた取引選択を行うことができます。 MQL製品のインストールガイド | MT4/MT5で購入したMQL製品の更新 | 一般的なトラブルシューティングガイド | インジケーター設定 / ガイド 主な機能 バッファ統合: インジケーターの値をアクセス可能なバッファとして公開し、Expert Advisorが自動取引のためにシグナルデータを利用できるようにします。 視覚的矢印シグナル: シグナルキャンドルのチャート上に明確なB
Price Magnet — Price Density and Attraction Levels Indicator Price Magnet is a professional analytical tool designed to identify key support and resistance levels based on statistical Price Density. The indicator analyzes a specified historical period and detects price levels where the market spent the most time. These zones act as “magnets,” attracting price action or forming a structural base for potential reversals. Unlike traditional Volume Profile tools, Price Magnet focuses on price-time d
Recomended broker: https://tinyurl.com/5ftaha7c Indicator used to monitor price fluctuations in the market and discover possible reversals through reversal points or divergences in the indicator. All assets and all timeframes.   SEE OUR RESULTS ON INSTAGRAM:  https://www.instagram.com/diogo.cansi/   TELEGRAM GROUP =  https://t.me/robosdsc More information by email dscinvestimentos@gmail.com or by Whatsapp 55-991372299
FREE
Order Book, known also as Market Book, market depth, Level 2, - is a dynamically updated table with current volumes of orders to buy and to sell specific financial instument at price levels near Bid and Ask. MetaTrader 5 provides the means for receiving market book from your broker, but in real time only, without access to its history. The indicator OrderBook Cumulative Indicator accumulates market book data online and visualizes them on the chart. In addition, the indicator can show the market
Aggression Volume Profile
Edson Cavalca Junior
4.55 (11)
This indicator plots the volume profile by Price on the chart There are 5 ways to view it: By Total Volume Traded (Premium Version); Volume Ticks(Forex) Separated by Buyers and Sellers (Premium Version); Buyers Only (Premium Version); Sellers Only (Premium Version); Business balance (Buyers - Sellers) (Premium Version); . It is possible to select how many days the profiles will be calculated.( Premium Version) On the current day it recalculates the histogram data for each new candlestick.
FREE
This indicator can be considered as a trading system. It offers a different view to see the currency pair: full timeless indicator, can be used for manual trading or for automatized trading with some expert advisor. When the price reaches a threshold a new block is created according to the set mode. The indicator beside the Renko bars, shows also 3 moving averages. Features renko mode median renko custom median renko 3 moving averages wicks datetime indicator for each block custom notification
Trade Sentiment or trade assistant is a MT5 Indicatior. That show buy or sell signal of different indicator to assist to take trades. That will help you to take right trades or to get confirmation for your trade. You don't need to have this indicators. Including indicators like  RSI , STOCH , CCI. And the signals are Based on different Timeframes like 5M , 15H , 1H and 4H.
FREE
Statistical Arbitrage Spread Generator for Cointegration [MT5] What is Pair Trading? Pair trading is a market-neutral strategy that looks to exploit the relative price movement between two correlated assets — instead of betting on the direction of the market. The idea? When two assets that usually move together diverge beyond a statistically significant threshold, one is likely mispriced. You sell the expensive one, buy the cheap one , and profit when they converge again. It’s a statistica
FREE
Dynamic Supply and Demand indicator automatically identifies and displays Supply and Demand Zones on your chart based on price action patterns and market structure.  These zones represent areas where institutional buying or selling pressure has historically occurred, making them key levels for potential price reactions. This form of indicator takes inspiration from ICT as well as traditional Support & Resistance formation. **For the first 50 candles (number depends on LookBackCandles) when indic
FREE
概要 Candle Timer Countdown Pro は、現在のローソク足が終了するまでの残り時間を、滑らかで正確なカウントダウンとして表示します。さらに、円形のプログレスアーク(進行表示)を組み合わせることで、残り時間を瞬時に視覚的に把握できます。 ティック間で停止したり、時間がずれてしまう他のタイマーとは異なり、本インジケーターはサーバー時間の補間(Server Time Interpolation)を使用し、M1 から MN まであらゆる時間足で途切れのないスムーズなカウントダウンを実現します。 1分足でのスキャルピングでも、H4でのスイングトレードでも、現在のローソク足が正確にいつ確定するのかを把握することで、エントリータイミングの最適化、ローソク足パターンの確認、そして早すぎる判断の回避に役立ちます。 このタイマーが他と違う理由 多くの MT5 用キャンドルタイマーは TimeCurrent() のみに依存しており、新しいティックが到着したときにしか更新されません。低ボラティリティ時や上位時間足では、ティックの間隔が数秒空くことがあり、その間タイマーが停止し、その後突
Indicator and Expert Adviser  EA Available in the comments section of this product. Download with Indicator must have indicator installed for EA to work. Mt5 indicator alerts for bollinger band and envelope extremes occurring at the same time. Buy signal alerts occur when A bullish candle has formed below both the lower bollinger band and the lower envelope  Bar must open and close below both these indicators. Sell signal occur when A bear bar is formed above the upper bollinger band and upper
FREE
インジケーター   Haven FVG   は、市場を分析するためのツールで、チャート上で非効率性の領域(Fair Value Gaps、FVG)を特定することができ、トレーダーに価格分析と取引決定のための主要なレベルを提供します。 他の製品 ->  ココ 主な特徴: 個別のカラー設定: ブルFVGの色   (Bullish FVG Color)。 ベアFVGの色   (Bearish FVG Color)。 柔軟なFVGの視覚化: FVGを検索するための最大ローソク足数。 FVGゾーンの追加延長(特定のバー数)。 FVGの塗りつぶしを有効にするオプション。 中央線(Middle Line): 線の色とスタイルの選択(例:点線)。 線の太さの調整。 一般設定: FVGを現在のバーまで拡張。 塗りつぶしのある歴史的なFVGを除外し、最新のデータに焦点を当てる。 チャート上の非効率性の領域を分析し、根拠のある取引決定を行う簡単で効果的な方法。
FREE
The Zigzag Price Arrow indicator is an enhanced version of the classic Zigzag indicator, combining the traditional zigzag pattern with advanced visual features. It not only identifies major market turning points but also provides clear trading signals through: • Directional arrows: Displays colored arrows (green for buy, magenta for sell) indicating potential trend directions. • Price labels: Shows the exact price values at each pivot point directly on the chart. • Improved visual clarity: Make
FREE
RBreaker Gold Indicatorsは、金先物の短期日内取引戦略であり、トレンドフォローと日内反転の2つの取引手法を組み合わせたものです。トレンド相場での利益を捉えるだけでなく、相場が反転した際には迅速に利確し、その流れに沿ってポジションを反転させることができます。 この戦略は、アメリカの雑誌『Futures Truth』において、15年連続で最も収益性の高い取引戦略トップ10に選ばれた実績を持ち、非常に長いライフサイクルを誇り、現在も国内外で広く使用・研究されています。 本インディケーターは、2026年の金先物の値動きに対応し、14日間のATR指標に基づいて、ブレイクアウト係数A、観察係数B、リバーサル係数Rをより合理的な値で定義しています。非常に優れたインディケーターであり、安定的な年間収益を実現しています。ぜひおすすめします〜
This indicator will help you track performance of your trades, even scalping trades.  You can use it with the Arab, and many other traders.  This indicator displays essential trading account information directly on your chart. It positions itself in one of the four corners of the screen and showcases details such as: Symbol: The symbol of the asset currently displayed on the chart. Profit/Loss: The total profit or loss in dollars for the current symbol. Pips: The total number of pips gained or
FREE
Visual Dolphin Indicator
AL MOOSAWI ABDULLAH JAFFER BAQER
Visual Dolphin Indicator Unlock the rhythm of the market with the Visual Dolphin Indicator, your ultimate tool for identifying and capitalizing on market trends with clarity and confidence. Designed for both novice and experienced traders, this indicator eliminates the noise and guesswork, providing crystal-clear buy and sell signals directly on your chart. The Logic Behind the Waves The core of the Visual Dolphin Indicator is a sophisticated yet intuitive dual-wave system based on moving avera
A new generation progressive indicator from INFINITY. Predictor PRO uses its own entry and exit calculation strategy. Indicator without redrawing signals! This is very important for real trading. The indicator can be used for any currency pairs, metals, cryptocurrencies or indices. The best time of the H1 chart. Unlike other indicators, Predictor PRO shows shows the Buy/Sell entry point and the Close exit point. Calculating the profit of all signals in points on the panel helps to choose the
FREE
https://www.mql5.com/en/users/gedeegi/seller    The GEN indicator is a multifunctional technical analysis tool for the MetaTrader 5 (MT5) platform. It is designed to automatically identify and display key Support and Resistance (S&R) levels and detect False Breakout signals, providing clear and visual trading cues directly on your chart. Its primary goal is to help traders identify potential price reversal points and avoid market traps when the price fails to decisively break through key levels
FREE
Donchian Channel DC is the indicator of Donchian Channels, that plots maximum and minimum values of a specific period, besides mean value line. It´s possible to configure simple period for analysis and the indicator will plot all three values. You can trade with this indicator as trend or reversal, according to each strategy. Do not let to test others indicators as soon as others expert advisors.
CCI「FIXED DUAL」とは **CCI「FIXED DUAL」**は、以下を高精度で識別するために設計された プロフェッショナル向けトレンド方向フィルター です。 市場の 支配的な方向 価格変動の 構造的な質 メイントレンドと加速フェーズの 整合性 これは エントリー用インジケーターではありません 。 従来型のオシレーターでもありません 。 本インジケーターは、 **「いつ取引すべきか」「いつ取引すべきでないか」**を判断するための コンテキスト分析ツール であり、 マーケットノイズや誤解釈を大幅に低減します。 CCI「FIXED DUAL」の設計思想 CCI「FIXED DUAL」の根幹となる考え方は、非常にシンプルかつ強力です。 市場構造と一致しないシグナルには価値がない。 そのため本インジケーターは、 単一の数値に依存せず 価格に衝動的に反応せず 無理に反転ポイントを探そうとしません 代わりに、以下を基にした 階層的なトレンド解析 を構築します。 Typical Price を用いた CCI 異なる速度を持つ LWMA(線形加重移動平均) 短期・中期・長
ICT Silver Bullet MT5
Haidar Lionel Haj Ali
5 (21)
ICT Silver Bullet If you are searching for a reliable indicator to trade the ICT Silver Bullet concept, or ICT concepts, Smart Money Concepts, or SMC, this indicator will respond to your need!  Before version 2.2, this indicator was focused only on ICT Silver Bullet, but moving forward, we will include the different elements for smart money concept trading. This indicator will help you identify the following: FVG - fair value gaps Market structure: BOS and CHOCH. It is based on swing high and l
Trading Sessions by Mahefa R is an indicator for MetaTrader 5 that visually identifies the four main trading sessions: New York, London, Tokyo, and Sydney . Designed to provide a clean, intuitive, and professional market view, it highlights the most active periods of the Forex market using smart visualization of session ranges , session-specific candle colors , and daily separators . Main Features: Automatic detection of the 4 major sessions New York London Tokyo Sydney Each session is fully c
FREE
VWAP Volume And Price is the indicator for Volume Weighted Average Price, designed according to regular calculation. The average price is calculated using typical price - (high + low + close) / 3 - and weighted by volume for each candle. So, the indicator can be used to trend trades, balanced with volume. Try other products and expert advisors too. Any doubt, PM.
概要 このインジケーターは、クラシックな ドンチャンチャネル を強化したバージョンで、実践的なトレード機能を追加しています。 標準の3本線(上限、下限、中央線)に加え、 ブレイクアウト を検出し、チャート上に矢印で視覚的に表示します。また、チャートを見やすくするために、 現在のトレンド方向と逆側のラインのみを表示 します。 インジケーターの機能: 視覚的シグナル :ブレイクアウト時にカラフルな矢印を表示 自動通知 :ポップアップ、プッシュ通知、Eメール RSIフィルター :市場の相対的な強弱に基づいてシグナルを検証 カスタマイズ可能 :色、ラインの太さ、矢印コード、RSI閾値など 動作原理 ドンチャンチャネルは次のように計算します: 上限線 :直近N本のクローズ済みローソク足の最高値 下限線 :直近N本のクローズ済みローソク足の最安値 中央線 :最高値と最安値の平均値 上方ブレイクアウト は終値が上限線を超えたときに発生し、 下方ブレイクアウト は終値が下限線を下回ったときに発生します。 インジケーターは以下を行います: 3本のドンチャンラインを描画 方向転換後の最初のブレイクアウト
FREE
About the indicator: DALA Forecast is a universal tool for predicting the dynamics of time series of any nature. For prediction, modified methods of nonlinear dynamics analysis are used, on the basis of which a predictive model is built using machine learning methods.  To get the trial version of the indicator, you can contact me in private messages. How to use the indicator: Apply the indicator to your chosen financial instrument or indicator with the settings you need. The prediction will be
FREE
StrongXpert
Steve Rosenstock
5 (1)
すべての無料商品を見るにはここをクリック StrongXpert は、世界の通貨市場における リアルタイム強弱を正確に監視するツール です。 このツールは、 資金が実際にどこへ流れ込んでいるのか - そしてどこから市場を離れているのか を示すために開発されました。 このインジケーターは 主要8通貨(USD, EUR, GBP, JPY, AUD, CAD, CHF, NZD)の相対的な強さ を測定し、 複雑な価格変動をシンプルで読みやすいビジュアルパネルへと変換します - しかもチャート上に直接表示されます。 最強通貨と最弱通貨を数秒で識別できます - セットアップの確認、 トレンド方向のフィルタリング、反転ポイントの判断に最適です。  推測も憶測も不要 - 必要なのはリアルタイムの明確な市場構造だけです。  多くの強弱系インジケーターが単純計算や遅延値のみを表示するのに対し、  StrongXpert は 連続リアルタイム分析 を採用し、市場フェーズに応じて動的に適応します。 毎秒更新される正確な通貨間の強弱バランスが表示され - 遅延なし、 リペイントなし、妥協なし。 市場の動
FREE
インディケータは現在のクオートを作成し、これを過去のものと比較して、これに基づいて価格変動予測を行います。インジケータには、目的の日付にすばやく移動するためのテキスト フィールドがあります。 オプション: シンボル - インジケーターが表示するシンボルの選択; SymbolPeriod - 指標がデータを取る期間の選択; IndicatorColor - インジケータの色; HorisontalShift - 指定されたバー数だけインディケータによって描画されたクオートのシフト; Inverse - true は引用符を逆にします。false - 元のビュー。 ChartVerticalShiftStep - チャートを垂直方向にシフトします (キーボードの上下矢印)。 次は日付を入力できるテキストフィールドの設定で、「Enter」を押すとすぐにジャンプできます。
Multi-Mode Gann Angles Indicator (MT5) Multi-Mode Gann Angles インジケーターは、チャート上で選択したローソク足をクリックすると、トレンドラインの扇形構造を描画します。視覚的な構造はクラシックなガンアングルに類似しており、市場構造の手動分析を目的としています。 角度のスケールは複数の方法で設定できます。固定値を使用することも、指定した本数の過去バーに基づいて算出される平均価格変動を使用することも可能です。これにより、分析対象の銘柄や時間足の特性に合わせて角度の構築を調整できます。 インジケーターは各時間足で独立して動作します。トレンドラインは作成された時間足でのみ表示されます。各インスタンスは、IndicatorId と現在の時間足を含む一意のオブジェクト接頭辞を使用します。削除操作は、現在のインスタンスによって作成されたラインのみに適用されます。 計算モード (MethodInput) fixedScaleMode — FixedScale パラメータで定義された固定値を使用します。 alternativeOpenClose
Tops & Bottoms Indicator FREE   Tops abd Bottoms:   An effective indicator for your trades The tops and bottoms indicator helps you to find  ascending and descending channel formations with indications of ascending and/or descending tops and bottoms. In addition, it  show possibles  opportunities with a small yellow circle when the indicator encounters an impulse formation. This indicator provide to you  more security and speed in making entry decisions. Also test our FREE advisor indicator:  
FREE
このプロダクトを購入した人は以下も購入しています
SuperScalp Pro — 高度なマルチフィルター対応スキャルピングインジケーターシステム SuperScalp Pro は、クラシックな Supertrend と複数のインテリジェントな確認フィルターを組み合わせた高度なスキャルピング用インジケーターシステムです。M1〜H4 のすべての時間足で効率的に機能し、特に XAUUSD、BTCUSD、および主要なFX通貨ペアに適しています。単体のシステムとして、また既存の取引戦略へ柔軟に統合して使用できます。 本インジケーターは 11 以上のフィルターを統合しており、短期・長期の EMA、トレンド判定に用いる 3 本の EMA、EMA スロープ(EMA slope)、RSI、ADX、出来高、VWAP、ボリンジャーバンドのブレイクアウト、MACD ダイバージェンスフィルターなどを含みます。スマートキャンドルフィルターはローソク足の終値を確認して弱いシグナルを排除し、3 本の EMA と MACD ダイバージェンスを組み合わせたトレンド認識メカニズムにより勝率の高いシグナルの選別を支援します。 SuperScalp Pro は ATR に基
このインジケーターを購入された方には、以下の特典を 無料 で提供しています: 各トレードを自動で管理し、ストップロスとテイクプロフィットを設定し、戦略ルールに基づいてポジションを決済する補助ツール 「Bomber Utility」 様々な銘柄に合わせたインジケーターの設定ファイル(セットファイル) 「最小リスク」、「バランスリスク」、「待機戦略」 の3つのモードで使用できる Bomber Utility 用の設定ファイル このトレーディング戦略をすぐに導入・設定・開始できる ステップバイステップのビデオマニュアル ご注意: 上記の特典を受け取るには、MQL5のプライベートメッセージシステムを通じて販売者にご連絡ください。 オリジナルのカスタムインジケーター 「Divergence Bomber(ダイバージェンス・ボンバー)」 をご紹介します。これは、MACDのダイバージェンス(乖離)戦略に基づいた 「オールインワン」型のトレーディングシステム です。 このテクニカルインジケーターの主な目的は、価格とMACDインジケーターの間に発生するダイバージェンスを検出 し、将来の価格の動きを示す
Entry In The Zone and SMC Multi Timeframe is a real-time market analysis tool developed based on Smart Money Concepts (SMC). It is designed to analyze market structure, price direction, reversal points, and key zones across multiple timeframes in a systematic way. The system displays Points of Interest (POI) and real-time No Repaint signals, with instant alerts when price reaches key zones or when signals occur within those zones. It functions as both an Indicator and a Signal System (2-in-1), c
Azimuth Pro
Ottaviano De Cicco
5 (4)
発売プロモーション Azimuth Proは先着100名様限定で 299ドル でご提供します。最終価格は 499ドル となります。 リテールとインスティテューショナルのエントリーの違いはインジケーターではなく、ロケーションにあります。 多くのトレーダーは、モメンタムを追いかけたり、遅行シグナルに反応して、任意の価格レベルでエントリーします。機関投資家は、需給が実際にシフトする構造的なレベルに価格が到達するのを待ちます。 Azimuth Proはこれらのレベルを自動的にマッピングします:スイングアンカーVWAP、マルチタイムフレーム構造ライン、高確率ロケーションにのみ出現するABCパターン。 Azimuth Proは、構造分析とインテリジェントな自動化の両方を求めるプロフェッショナルトレーダー向けに構築されています。 Azimuthが外科的精度で市場構造をマッピングする一方、Azimuth Proはインテリジェンスレイヤーを追加します:トレーディングスタイルの自動検出、スマート設定された移動平均線、20年のデータでバックテストされた最適化パラメータ。その結果、お使いの銘柄と
このインジケーターを購入すると、プロ仕様のトレードマネージャーを無料で差し上げます。 まず第一に、このトレーディングシステムがノンリペイント、ノンリドロー、ノンラグのインジケーターであることを強調する価値がある。これにより、手動取引とロボット取引の両方に理想的なものになっています。 オンラインコース、マニュアル、プリセットのダウンロード。 「スマートトレンドトレーディングシステム MT5」は、新規および経験豊富なトレーダー向けにカスタマイズされた包括的なトレーディングソリューションです。10以上のプレミアムインジケーターを組み合わせ、7つ以上の堅実なトレーディング戦略を備えており、多様な市場状況に対応する多目的な選択肢となっています。 トレンドフォロー戦略:トレンドを効果的に乗り越えるための正確なエントリーとストップロス管理を提供します。 リバーサル戦略:潜在的なトレンドの反転を特定し、トレーダーがレンジ相場を活用できるようにします。 スキャルピング戦略:高速で正確なデイトレードおよび短期取引のために設計されています。 安定性:すべてのインジケーターはノンリペイント、ノンリドロー、ノ
FX Trend NG:次世代マルチマーケット・トレンドインテリジェンス 概要 FX Trend NG は、複数の時間足に対応したプロフェッショナル向けトレンド分析およびマーケット監視ツールです。 市場全体の構造を数秒で把握することができます。 複数のチャートを切り替える必要はありません。どの銘柄がトレンド中なのか、どこでモメンタムが弱まっているのか、そしてどの時間足で強い整合性があるのかを瞬時に確認できます。 ローンチ特別オファー – FX Trend NG を $30(6ヶ月) または $80 永久ライセンス でご利用いただけます。 すでに Stein Investments のユーザーですか? -> メッセージを送信 して、プライベートグループへアクセスしてください。 セットアップや詳細情報が必要ですか? -> Stein Investments 公式ページ をご覧ください。 1. FX Trend NG が他と異なる理由 3ステート・トレンドロジック ― Buy と Sell だけではない • 多くのインジケーターは Buy または Sell の2状態のみを表示します。
トレンド スクリーナー インジケーターでトレンド取引の力を解き放ちます。ファジー ロジックと複数通貨システムを活用した究極のトレンド取引ソリューションです。 ファジー ロジックを活用した革新的なトレンド インジケーターである Trend Screener を使用して、トレンド取引を向上させます。 これは、13 を超えるプレミアム ツールと機能、および 3 つの取引戦略を組み合わせた強力なトレンド追跡インジケーターであり、Metatrader をトレンド アナライザーにする多用途の選択肢となります。 期間限定オファー : トレンド スクリーナー インジケーターは、わずか 100 ドルで生涯ご利用いただけます。 (元の価格 50$ ) (オファー延長) Trend Screener の 100% 非再描画精度の揺るぎない精度を体験して、取引の決定が過去の価格変動の影響を受けないようにしてください。 マルチタイムフレームおよびマルチ通貨機能の多用途性を解放し、比類のない自信を持って外国為替、商品、暗号通貨、インデックスの世界を取引できるようにします。 Trend Screener の包括的な
優れたテクニカルインジケーター「Grabber」をご紹介します。これは、すぐに使える「オールインワン」トレーディング戦略として機能します。 ひとつのコードに、市場のテクニカル分析ツール、取引シグナル(矢印)、アラート機能、プッシュ通知が強力に統合されています。 このインジケーターを購入された方には、以下の特典を無料で提供します: Grabberユーティリティ:オープンポジションを自動で管理するツール ステップバイステップのビデオマニュアル:インジケーターのインストール、設定、取引方法を解説 カスタムセットファイル:インジケーターをすばやく自動設定し、最大限の成果を出すための設定ファイル 他の戦略はもう忘れてください!Grabberだけが、あなたを新たなトレードの高みへと導いてくれるのです。 Grabber戦略の主な特徴: 推奨タイムフレーム:M5〜H4 対応通貨ペア・資産:どれでも使用可能ですが、私が実際に検証した以下を推奨します(GBPUSD、GBPCAD、GBPCHF、AUDCAD、AUDUSD、AUDSGD、AUDCHF、NZDUSD、NZDCAD、EURCAD、EURUSD、E
AriX
Temirlan Kdyrkhan
1 (4)
AriX Indicator for MT5 A powerful trend-following and signal-evaluation tool AriX is a custom MT5 indicator that combines Moving Averages and ATR-based risk/reward logic to generate clear buy/sell signals. It visualizes dynamic SL/TP levels, evaluates past trade outcomes, and displays win/loss statistics in a clean on-chart panel. Key features include: Buy/Sell signals based on MA crossovers ATR-based SL/TP1/TP2/TP3 levels with visual lines and labels Signal outcome tracking with real-time stat
まず第一に、この取引インジケーターは再描画されず、再描画されず、遅延しないことを強調する価値があります。これにより、手動取引とロボット取引の両方に理想的なものになります。 ユーザーマニュアル:設定、入力、戦略。 アトミックアナリストは、価格の強さとモメンタムを利用して市場でより良いエッジを見つけるためのPA価格アクションインジケーターです。ノイズや誤ったシグナルを除去し、取引ポテンシャルを高めるための高度なフィルターを備えています。複雑なインジケーターの複数のレイヤーを使用して、アトミックアナリストはチャートをスキャンし、複雑な数学的計算をシンプルなシグナルと色に変換します。これにより、どのような初心者トレーダーでも理解して使用し、一貫した取引の決定を行うことができます。 「アトミックアナリスト」は、新規および経験豊富なトレーダー向けにカスタマイズされた包括的な取引ソリューションです。プレミアムインジケーターとトップノッチの機能を1つの取引戦略に組み合わせ、すべてのタイプのトレーダーにとって汎用性のある選択肢にします。 デイリートレーディングとスキャルピング戦略:高速で正確なデイ
FX Power: 通貨の強弱を分析して、より賢い取引を実現 概要 FX Power は主要通貨と金の実際の強弱をあらゆる市場状況で理解するための必須ツールです。強い通貨を買い、弱い通貨を売ることで、 FX Power は取引の意思決定を簡素化し、高い確率の取引機会を見出します。トレンドを追従する場合でも、極端なデルタ値を使用して反転を予測する場合でも、このツールはあなたの取引スタイルに完全に適応します。ただ取引するだけではなく、 FX Power で賢く取引をしましょう。 1. なぜ FX Power がトレーダーにとって非常に有益なのか 通貨と金のリアルタイム強弱分析 • FX Power は主要通貨と金の相対的な強弱を計算し、マーケットダイナミクスに関する明確な洞察を提供します。 • どの資産がリードしているか、または後れを取っているかを監視して、取引するペアを賢く選びましょう。 マルチタイムフレームの包括的なビュー • 短期、中期、長期のタイムフレームで通貨と金の強弱を追跡し、マーケットトレンドに基づいて取引戦略を調整できます。 • スキャルピングからスイングトレード
OmniSync Projection
Antonio-alin Teculescu
5 (1)
Chronos Fractal Engine is an innovative price projection indicator for MetaTrader 5, designed to transform your technical analysis by intelligently identifying and projecting historical price patterns. Built upon an advanced correlation algorithm and the fractal principles of the market, this powerful tool visualizes potential future price movements, giving you a unique edge in your trading decisions. What is Chronos Fractal Engine? At its core, the Chronos Fractal Engine employs a sophisticat
このインジケーターは、反転ポイントと価格戻りゾーンを正確に表示します。     主要プレーヤー 。新たなトレンドが形成される場所を把握し、最大限の精度で意思決定を行い、すべての取引をコントロールします。 TREND LINES PRO インジケーターと組み合わせることで、その潜在能力を最大限に発揮します。 VERSION MT4 インジケーターが示す内容: 新しいトレンドの始まりに活性化する反転構造と反転レベル。 リスクと報酬の比率を最小限に抑えた利益 確定 と 損失停止の レベルの表示     RR 1:2   。 インテリジェントな削減ロジックによるストップロス。 指定されたインジケーターから 2 つのトレンド タイプの反転パターンを表示します。 指標: トレンドを追う   TREND LINES PRO   (世界的なトレンドの変化) TREND PRO   (クイックトレンド変更) シンプルで効果的   スキャナー   リアルタイムトレンド(新機能)。 マルチタイムフレームのインストゥルメント フィルタリング。 画面   利益     LOGIC AI信号の後。 当日プラス方
まず第一に、この取引ツールはノンリペイント、ノンリドロー、ノンラグの指標であり、プロの取引に理想的ですことを強調する価値があります。 オンラインコース、ユーザーマニュアル、デモ。 スマートプライスアクションコンセプトインジケーターは、新米から経験豊富なトレーダーまで、非常 に強力なツールです。Inner Circle Trader AnalysisやSmart Money Concepts Trading Strategiesなど、20以上の有用な指標を1つに組み合わせています。このインジケーターはスマートマネーコンセプトに焦点を当て、大手機関の取引方法を提供し、彼らの動きを予測するのに役立ちます。 特に、流動性分析に優れており、機関がどのように取引しているかを理解しやすくしています。市場のトレンドを予測し、価格の動きを慎重に分析するのに優れています。機関の戦略とトレードを合わせることで、市場の動向についてより正確な予測ができます。このインジケーターは多目的であり、市場構造を分析し、重要な注文ブロックを特定し、さまざまなパターンを認識するのに優れています。 このインジケーター
ご紹介     Quantum Breakout PRO は 、ブレイクアウト ゾーンの取引方法を変革する画期的な MQL5 インジケーターです。 13年以上の取引経験を持つ経験豊富なトレーダーのチームによって開発されました。     クォンタム ブレイクアウト プロ   は、革新的でダイナミックなブレイクアウト ゾーン戦略により、あなたのトレーディングの旅を新たな高みに押し上げるように設計されています。 クォンタム ブレイクアウト インジケーターは、5 つの利益ターゲット ゾーンを備えたブレイクアウト ゾーン上のシグナル矢印と、ブレイクアウト ボックスに基づいたストップロスの提案を提供します。 初心者トレーダーにもプロのトレーダーにも適しています。 量子EAチャネル:       ここをクリック 重要!購入後、インストールマニュアルを受け取るためにプライベートメッセージを送ってください。 推奨事項: 時間枠: M15 通貨ペア: GBPJPY、EURJPY、USDJPY、NZDUSD、XAUUSD アカウントの種類: ECN、Raw、またはスプレッドが非常に低い R
ARIPoint is a powerful trading companion designed to generate high-probability entry signals with dynamic TP/SL/DP levels based on volatility. Built-in performance tracking shows win/loss stats, PP1/PP2 hits, and success rates all updated live. Key Features: Buy/Sell signals with adaptive volatility bands Real-time TP/SL/DP levels based on ATR Built-in MA Filter with optional ATR/StdDev volatility Performance stats panel (Success, Profit/Loss, PP1/PP2) Alerts via popup, sound, push, or email Cu
Trend Ai indicatorは、トレンドの識別と実用的なエントリポイントと反転アラートを組み合わせることで、トレーダーの市場分析を強化する優れたツールです。 この指標は、ユーザーが自信と正確さで外国為替市場の複雑さをナビゲートすることを可能にします トレンドAiインジケーターは、主要なシグナル以外にも、プルバックやリトレースメント中に発生するセカンダリエントリポイントを識別し、トレーダーが確立されたトレンド内の価格修正を活用できるようにします。 重要な利点: *MT4およびMT5の仕事 *明確な買いまたは売りシグナル *再描画しません ·すべての資産で動作します 私はeaやセットをtelegram it詐欺で販売しないように注意してください。 すべての設定はここでブログで無料です。  重要! 指示とボーナスを得るために購入後すぐに私に連絡してください! 私の他のプロダクトと同様、実質操作の監視はここに見つけることができます: https://www.mql5.com/en/users/mechanic/seller&nbsp ; 設定および入力: すべての
RelicusRoad Pro: 定量的市場オペレーティングシステム 【期間限定】無制限アクセス 70% OFF - 2,000人超のトレーダーと共に なぜ多くのトレーダーは「完璧な」インジケーターを使っても失敗するのでしょうか? それは、文脈を無視して 単一の概念 だけでトレードしているからです。文脈のないシグナルは単なるギャンブルです。勝ち続けるには、 根拠の重なり(コンフルエンス) が必要です。 RelicusRoad Proは単なる矢印インジケーターではありません。完全な 定量的市場エコシステム です。独自のボラティリティモデリングを用いて、価格が推移する「適正価値の道(Fair Value Road)」をマッピングし、ノイズと真の構造的ブレイクを判別します。 推測はやめましょう。機関投資家レベルの「ロード・ロジック」でトレードを。 コアエンジン:「Road」アルゴリズム システムの中心となる Road Algo は、市場環境にリアルタイムで適応するダイナミックなボラティリティチャネルです。 安全ライン(平衡点) と、価格が数学的に反転しやすい 拡張レベル を投影します。 Si
Quantum TrendPulse を ご紹介します。これは、   SuperTrend   、   RSI   、および Stochastic のパワーを 1 つの包括的なインジケーターに組み合わせて、取引の可能性を最大限に引き出す究極の取引ツールです。精度と効率を求めるトレーダー向けに設計されたこのインジケーターは、市場のトレンド、勢いの変化、最適なエントリー ポイントとエグジット ポイントを自信を持って特定するのに役立ちます。 主な特徴: SuperTrend 統合: 現在の市場動向に簡単に追従し、収益性の波に乗ることができます。 RSI精度: 買われすぎと売られすぎのレベルを検出し、市場の反転のタイミングに最適で、SuperTrendのフィルターとして使用されます。 確率的精度: 確率的振動を活用して、変動の激しい市場で隠れたチャンスを見つけます。SuperTrend のフィルターとして使用されます。 マルチタイムフレーム分析:   M5 から H1 または H4 まで、さまざまなタイムフレームで市場を常に把握します。 カスタマイズ可能なアラート: カスタム取引条件が満たされ
Crystal Heikin Ashi Signals - Professional Trend & Signal Detection Indicator Advanced Heikin Ashi Visualization with Intelligent Signal System for Manual & Automated Trading Final Price: $149 ---------> Price goes up $10 after every 10 sales . Limited slots available — act fast . Overview Crystal Heikin Ashi Signals is a professional-grade MetaTrader 5 indicator that combines pure Heikin Ashi candle visualization with an advanced momentum-shift detection system. Designed for both manual traders
Gold Sniper Scalper Pro は、XAUUSD における ダマシブレイクアウト(false breakout)パターンの検出に特化した MetaTrader 5 用インジケーターです。価格がレンジの境界を突破してブレイクアウトトレーダーを誘い込み、その後反転してレンジ内に戻る4本バーのトラップ構造を識別します。インジケーターは各セットアップを17の品質要素で採点し、4層コンフルエンスパイプラインで評価し、7タイムフレームトレンドコンセンサスエンジンで検証し、ゴールドボラティリティレジーム分類器でフィルタリングします。すべてシグナルがチャートに表示される前に完了します。 詳細なユーザーガイドは、著者の   MQL5 ブログ   で入手できます。追加の更新は、著者の   MQL5 チャンネル   を通じて入手可能です。 現在のサポートポリシーに基づき、購入者は著者が開発した選定コンパニオンツールへの追加アクセスを受けることができます。 Forex通貨ペア、インデックス、暗号資産でも動作しますが、検出パラメーター、ボラティリティ処理、フィルターロジックはXAUUSD
トレンドラインプロ   市場の真の方向転換点を理解するのに役立ちます。この指標は、真のトレンド反転と主要プレーヤーが再び参入するポイントを示します。 分かりますか     BOSライン   複雑な設定や不要なノイズなしに、より長い時間足でのトレンドの変化と重要なレベルを把握できます。シグナルは再描画されず、バーが閉じた後もチャート上に残ります。 MT4バージョン   -   RFI LEVELS PRO インジケーター と組み合わせることで、その最大限の能力を発揮します インジケーターが示す内容: 本当の変化   トレンド(BOSライン) 一度シグナルが現れたら、それは有効です!これは、リペイント機能を持つインジケーターとの重要な違いです。リペイント機能を持つインジケーターは、シグナルを発した後、それを変更し、資金の損失につながる可能性があります。これにより、より高い確率と精度で市場に参入できます。また、矢印が現れた後、目標値(利益確定)に達するか、反転シグナルが現れるまで、ローソク足の色を変更する機能もあります。 繰り返しエントリ   主要プレーヤーの補充 エントリーポイントを探す
スイングトレーディング は、トレンドの方向のスイングと可能な反転スイングを検出するように設計された最初のインジケーターです。トレーディングの文献で広く説明されているベースラインスイングトレーディングアプローチを使用します。インディケータは、いくつかの価格と時間のベクトルを調査して、全体的なトレンドの方向を追跡し、市場が売られ過ぎまたは買われ過ぎて修正の準備ができている状況を検出します。 [ インストールガイド | 更新ガイド | トラブルシューティング | よくある質問 | すべての製品 ] むち打ちを起こさずに市場スイングの利益 インジケーターは常にトレンドの方向を表示します 色付きの価格帯は機会のベースラインを表します 色付きのダッシュは、可能な反転スイングを表します この指標は、独自の品質とパフォーマンスを分析します 複数時間枠のダッシュボードを実装します カスタマイズ可能なトレンドおよびスイング期間 電子メール/サウンド/プッシュアラートを実装します インジケータは再描画またはバックペインティングではありません Swing Tradingとは Swing Tradingは
Pips Stalker mt5
Abdulkarim Karazon
5 (1)
Pips Stalkerはロングショートアロータイプのインジケーターで、あらゆるレベルのトレーダーがより良い意思決定を行えるようにサポートします。インジケーターはリペイントされず、RSIを主なシグナルロジックとして用い、一度矢印が出されるとリペイントやバックペイントはなく、矢印の遅延もありません。 MT4バージョン<---- ピップスストーカーアローの特徴 : スタッツパネル 独自の情報ダッシュボードで、総合勝率%や連続最大勝敗トレードなどの有用な統計、その他便利な情報を表示します。 TPとSL、組み込みのマネーマネジメント 指標は各矢印でTPとSLのオブジェクトを示し、トレーダーはマネーとリスク管理を組み込み、SLはATRに基づいて、TPは現在のATR SL価値に基づくリスク対リターン比率に基づいています。 再塗装不要、高い調整可能性 インジケーターはシグナル品質向上のオプションを豊富に提供しており、わずかな期間調整だけでどのペアでも機能します。パネルはトレーダーに現在の設定や期間が利益を上げているかどうかを示します。推奨期間枠:M1。 再調整開始資本金:100ドル
Candle Smart Range
Gianny Alexander Lugo Sanchez
5 (1)
MetaTrader 5用 Candle Smart Range (CSR) Candle Smart Rangeは、複数のタイムフレームで価格レンジを自動的に識別するためのテクニカル指標です。このツールは、ローソク足の形成と、以前の高値・安値との相互作用に基づいて市場構造を分析します。 主な機能: レンジ検出: 勢いのある動きの前のコンソリデーション(保ち合い)ゾーンを特定します。 だまし(フェイクアウト)の識別: 価格が以前の水準を超えたものの、ローソク足の終値基準でレンジ内に戻った場合をマークします。 マルチタイムフレーム分析: カスタム期間を含む最大19のタイムフレームのデータを1つのチャートに表示します。 内部可視化(ズーム): チャートを切り替えずに、上位足のローソク足内部の値動きを確認できます。 時間フィルター: 主要な市場セッションなど、特定の時間帯で動作するように設定可能です。 履歴確認モード: 過去のデータをステップバイステップで確認し、分析できます。 アラート機能: ローソク足の確定や新しいレンジの検出を通知します。 インターフェース: 視覚的な負荷を管理する画面
Get the user guide here  https://g-labs.software/guides/BTMM_State_Engine_Welcome_Pack.html BTMM State Engine Pro — the   all-in-one Banks   & Institutions Market Maker indicator for Meta Trader 5. Built for   BTMM traders who follow the Asian   session breakout methodology with Kill Zone timing , level stacking, peak formation detection , and multi-pair scanning — all   from a single chart. Combines   a full BTMM State Engine   with a built-in multi-pair Scanner dashboard, eliminating the need
Easy SMC Trading
Israr Hussain Shah
4 (1)
自動RR&BOSスキャナー搭載ストラクチャートレンド バージョン: 1.0 概要 自動RRスキャナー搭載ストラクチャートレンドは、プライスアクションとマーケットストラクチャーを重視するトレーダー向けに設計された包括的なトレーディングシステムです。平滑化されたトレンドフィルターとスイングポイント検出、そしてストラクチャーブレイク(BOS)シグナルを組み合わせ、高確率のトレードセットアップを生成します。 このツールの最大の特徴は、自動リスク管理です。有効なストラクチャーブレイクを検出すると、インジケーターはリスク/リワードゾーン(1:1、1:2、1:3)を瞬時に計算・描画し、価格が目標値に到達すると自動的にトレードの視覚化を管理します。これにより、手動で描画ツールを使用する必要がなくなり、トレーダーは執行のみに集中できます。 主な機能 ダイナミック・ストラクチャーブレイク(BOS)検出 スイングハイ(HH/LH)とスイングロー(HL/LL)を自動的に識別します。 価格が主要なストラクチャーレベルをブレイクすると、チャート上にBOSラインを直接描画し、トレンドの方向を確認します。
これはほぼ間違いなく、MetaTraderプラットフォームで見つけることができる最も完全な調和価格形成自動認識インジケーターです。 19種類のパターンを検出し、フィボナッチプロジェクションをあなたと同じように真剣に受け止め、潜在的逆転ゾーン(PRZ)を表示し、適切なストップロスとテイクプロフィットレベルを見つけます。 [ インストールガイド | 更新ガイド | トラブルシューティング | よくある質問 | すべての製品 ] 19の異なる調和価格形成を検出します プライマリ、派生および補完フィボナッチ投影(PRZ)をプロットします 過去の価格行動を評価し、過去のすべてのパターンを表示します この指標は、独自の品質とパフォーマンスを分析します 適切なストップロスとテイクプロフィットのレベルを表示します ブレイクアウトを使用して適切な取引を通知します すべてのパターン比をグラフにプロットします 電子メール/音声/視覚アラートを実装します スコット・M・カーニーの本に着想を得て、この指標は最も純粋で急を要するトレーダーのニーズを満たすように設計されています。ただし、トレードを容易にする
「 Dynamic Scalper System MT5 」インジケーターは、トレンド波の中でスキャルピング取引を行う手法のために設計されています。 主要通貨ペアと金でテスト済みで、他の取引商品との互換性があります。 トレンドに沿った短期的なポジションオープンのシグナルを提供し、追加の価格変動サポートも提供します。 インジケーターの原理 大きな矢印はトレンドの方向を決定します。 トレンド波の中では、小さな矢印の形でスキャルピングシグナルを生成するアルゴリズムが機能します。 赤い矢印は強気方向、青い矢印は弱気方向です。 トレンドの方向には敏感な価格変動ラインが描かれ、小さな矢印のシグナルと連動します。 シグナルは次のように機能します。適切なタイミングでラインが現れるとエントリーシグナルが形成され、ラインが開いている間はポジションが保持され、完了すると取引が終了します。 推奨される動作時間枠はM1~H4です。 矢印は現在のローソク足に形成され、次のローソク足が開いている場合は、前のローソク足の矢印は再描画されません。 入力パラメータ Trend Wave Period - トレ
Meta Cipher B
SILICON HALLWAY PTY LTD
Meta Cipher B:MT5向けのオールインワン・オシレーター・スイート Meta Cipher B は人気の Market Cipher B コンセプトを MetaTrader 5 に導入し、速度と精度を最適化しました。ゼロから設計された高性能アーキテクチャにより、 プロフェッショナル品質のシグナル を遅延や動作の重さなしで提供します。単体でも非常に強力ですが、 Meta Cipher A と自然に組み合わせることで、市場の全体像をより深く分析できます。 機能概要 統合されたオシレーター群により、 波のモメンタム、VWAP、マネーフロー、RSI、ストキャスティクス を可視化します。条件が一致すると明確な買い・売りドットが表示されます。短期足ではエントリータイミングの調整に、長期足では相場構造の把握に利用できます。 高精度シグナルのための設計 カーブマッチング技術 を用いて丁寧にキャリブレーションし、典型的な市場環境下で元の挙動を忠実に再現します。各サブシグナルはスムージングおよび同期処理され、波形とドットが経験豊富なトレーダーの期待どおりに整列します。 ご自身で確認 するに
作者のその他のプロダクト
Half Trend TPSL Buy Sell Indicator calculates the open and close of the price bars over the selected period of time and applies its own  calculation method to find an average line of the price movement.  ATR based Take Profit and Stop Loss ATR is a measure of volatility over a specified period of time. The most common length is 14, which is also a common length for oscillators, such as the relative strength index (RSI) and stochastics. A higher ATR indicates a more volatile market, while a lowe
Advanced Camarilla Calculator is one of the most commonly used trading calculators. This calculator can be used to generate levels. Scenario 1 Open price is between H3 and L3 For Long  - Wait for the price to go below L3 and then when it moves back above L3, buy. Stop loss will be when price moves below L4. Target1 - H1, Target2 - H2, Target3 - H3  For Short  -  Wait for the price to go above H3 and then when the price moves back below H3, sell. Stop loss will be when price moves above H4. Targe
Multi Trend Analyzer MT4 indicator provides signals from the following technical trading indicators: RSI, STOCH, STOCHRSI, MACD, ADX, Williams % R, ATR, Oscillator, ROC and Bull/Bear Power. It supports all time frames, from the 1 minute up to the monthly charts. You can change all indicator inputs. Indicator provide total trend summary. We can easily analysis and study market movement .
MACD MULTI TIME FRAME WITH MULTI SYMBOLS  INDICATOR  MACD MTF Indicator visualize all MT4 time frame  and trend based on  Moving Average Convergence Divergence (MACD) strategy . Indicator have settings for MACD customizing and variable "Symbols "EURUSD,USDCHG,...", which is used to define symbols. , Signals are displayed  Buy  , Strong buy  ,  Sell,  Strong Sell,   ### - No Trend Strong  Description The Moving Average Convergence/Divergence indicator is a momentum oscillator primarily used to tr
Super Trend Filter Indicator Super trend Arrow Consider as a Master Candle , If super trend in Buy signal , then signal candle calculate as master candle  and master candle close above the open candle then calculate filter Buy Arrow.  If super trend in Sell signal , then signal candle calculate master candle  and master candle close below the open candle calculate filter Sell Arrow. 3 Target with Trailing Stop Loss 
Multi Indicators Scanner Indicator Scan  ADX ,Moving Average ,ENVELOPE ,SAR , MACD ,RSI  and ATR . We can change all input parameters in chart window. scanner works Multiple Time Frame we can change Timeframe .  Symbol button based on Trend color , we can click button and open chart .  We can also save templates in input.   Default settings Time Frame   1Hour Templates Name  Default Auto Arrange Chart  true
Fibonacci calculator is used with Elliot Waves, it can generate remarkable results. A trader could use these levels or ratios to find high probability trades with very small stop loss. You may also use these ratios to find Elliott Waves extensions and to book profit near those levels. For Elliot Wave experts, Fibonacci calculator is a highly useful tool that can assist them in calculating Fibonacci extension and retracement levels for the market price. The indicator proves itself as a useful one
This MACD Magic indicator coded due to inspired in a another similar indicator ,Here Macd Magic calculate Double trend confirmation. With ATR Ratio Based TP point , ATR value input are available in input settings . MACD Magic indicator provides Accurate signals on all Major currency pair and stocks. This indicator Very easy to analysis trend and set target point 
Wolfe Waves scanner - It scans all the Symbols and identify the movement of price and it gives confidence in trade. It automatically plots  fifth wave breaks out of the channel. According to the theory behind the pattern, a line drawn from the point at the beginning of the first wave and passing through the beginning of the fourth wave predicts a target price for the end of the fifth wave. If a trader properly identifies a Wolfe Wave as it forms, the beginning of the fifth wave represents an op
The Average True Range (ATR) is a tool to measure volatility. ATR MTF (Multi Time Frame) indicator provides all timeframe trends helps to identify in which kind of volatility environment the market .This indicator can be used with any Trading Systems for additional confirmation of trading entries or exits. It is a very helpful tool to calculate Targets and Stops according the current market conditions.
Half Trend TPSL Buy Sell Indicator calculates the open and close of the price bars over the selected period of time and applies its own  calculation method to find an average line of the price movement.  ATR based Take Profit and Stop Loss ATR is a measure of volatility over a specified period of time. The most common length is 14, which is also a common length for oscillators, such as the relative strength index (RSI) and stochastics. A higher ATR indicates a more volatile market, while a lowe
An RSI (Relative Strength Index) MT4 (MetaTrader 4) scanner is a tool used in forex trading to identify overbought or oversold conditions across multiple currency pairs and timeframes. The RSI is a momentum oscillator that measures the speed and change of price movements, typically used to identify potential reversal points in the market. Key Features and Functions of an RSI MT4 Scanner: Multiple Timeframe Analysis : The scanner can analyze various timeframes (e.g., 1 minute, 5 minutes, 15 minut
Product Description: MT4 Trade Copier with Advanced Features MT4  Trade Copier is designed to streamline and enhance your trading experience by allowing seamless replication of trades across multiple accounts. It offers advanced features to cater to different trading needs and preferences. Features: Master/Slave Selection: Easily choose between master and slave modes to manage trades effectively. Multiplier for Slave Accounts: Set a multiplier to adjust the size of trades copied to slave a
BB Scanner MT4  is a powerful, next-generation market scanner that detects Bollinger Bands breakouts across multiple symbols and timeframes. It provides a modern, interactive dashboard that displays signals, entry price, target levels, stop loss, and real-time status — all in one place. Key Features Multi-Symbol & Multi-Timeframe Scanning (auto or custom list) Precise BB Breakout Detection (Buy/Sell with ATR-based targets) Automatic Target 1, Target 2, Stop Loss calculation ️ Modern
A HalfTrend scanner for MT5 (MetaTrader 5) is a technical analysis tool designed to help traders identify trend reversals and trade opportunities in the market. The HalfTrend indicator itself is based on price movements and a specific algorithm that identifies changes in market direction. Here’s a detailed description of an MT5 HalfTrend scanner: Overview The MT5 HalfTrend scanner is an advanced tool that scans multiple currency pairs or financial instruments for potential trend reversal signals
Super Trend Filter Indicator SuperTrend Filter V5.2 MT5 Indicator, as provided in the code, is a custom technical analysis tool designed for  MetaTrader 5 (MT5) to identify market trends, provide trading signals, and display key price levels with a visually appealing interface. Super trend Arrow Consider as a Master Candle, If super trend in Buy signal, then signal candle calculates as master candle  and master candle close above the open candle then calculate filter Buy Arrow.  If super tre
MACD Multi Time Frame Scanner MACD Scanner MT5 is a powerful and easy-to-use dashboard tool that scans the MACD indicator across multiple symbols and multiple timeframes in real-time. It gives you a complete market overview at a glance, helping you spot bullish and bearish MACD crossovers instantly — without switching between charts. 1. Multi-Symbol / Multi-Timeframe Scanning Allow user to set a watchlist (symbols to scan). Scan across multiple timeframes (M1 → MN). Show signals (Bullish / Beari
フィルタ:
レビューなし
レビューに返信