TrendLines Cross with Alert
- インディケータ
- バージョン: 1.2
- アップデート済み: 5 10月 2024

Trend Lines Cross
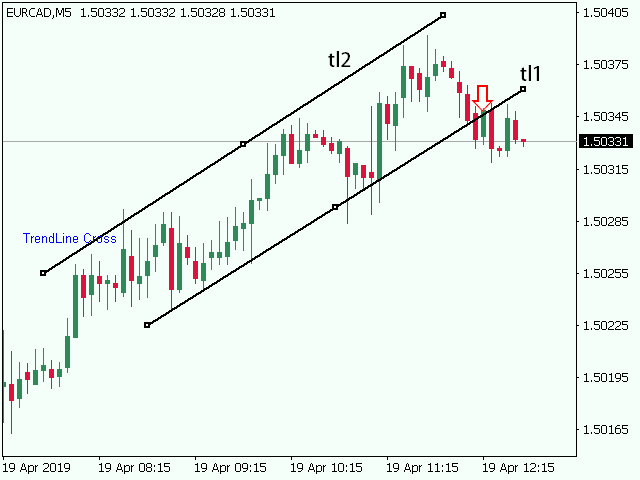
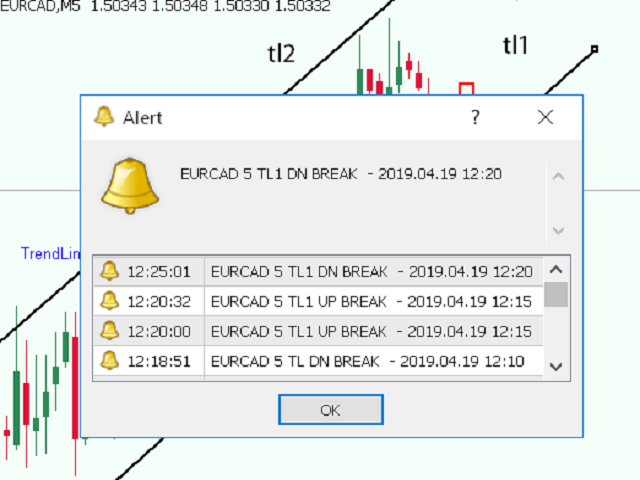
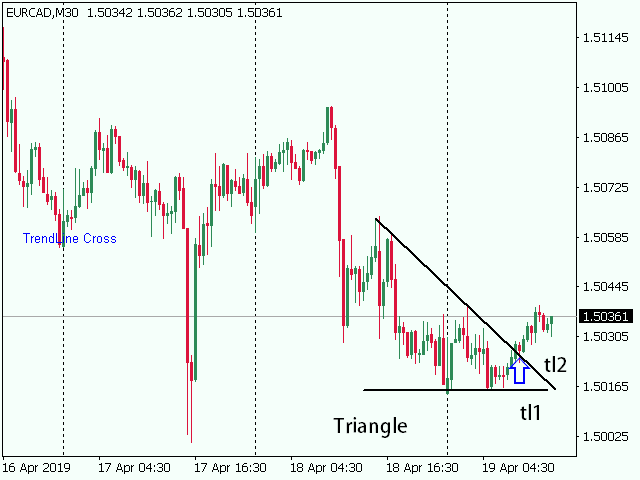
This indicator will alert you on any cross of a Trendline. You can draw up to two trend lines and form a channel, a pennant , a triangle or a simple trend and when the price crosses either trend line the indicator will provide you with alerts that you define plus an up or down arrow when the cross happened.
How to:
Draw the 1st trendline and name it tl1.
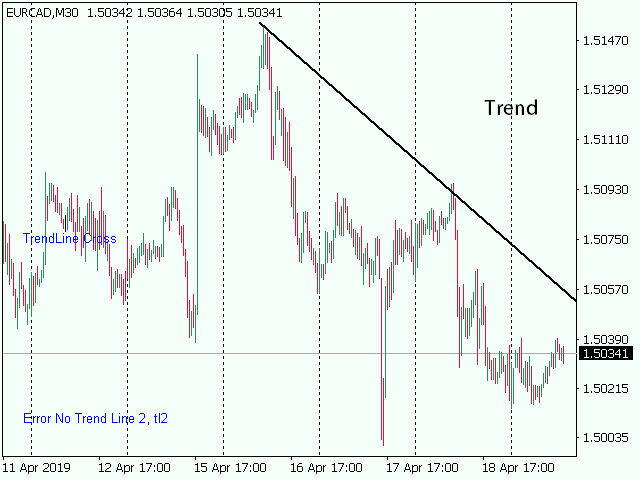
Draw the 2nd trendline and name it tl2.
Select which type of alerts you would like in the indicator properties and you are ready to go.
The indicator works even with a single trendline independent of the notification that there is one trendline missing.
Up and Down arrows will clear if you move either trendline.
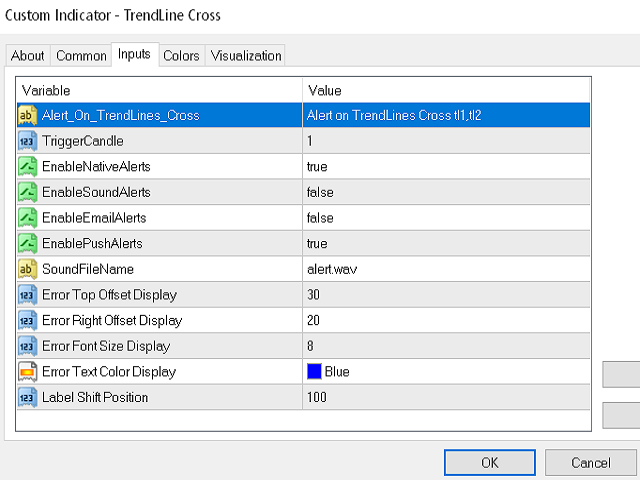
Parameters:
Alert_On_TrendLines_Cross = "Alert on TrendLines Cross tl1,tl2";
TriggerCandle = 1; The candle number that the alert will be triggered
EnableNativeAlerts = true; Popup
EnableSoundAlerts = false; Sound
EnableEmailAlerts = false; Email
EnablePushAlerts =true; Push Notification
SoundFileName = "alert.wav";
Parameters for Error Location on Chart
Error Top Offset Display = 30
Error Right Offset Display = 20
Error Font Size Display = 8
Error Text Color Display =Blue
Label Shift Position = 100

nice sir , good effort, plz add arrows at breakouts non repaint 100%, even if breakout goes wrong arrow should always remain there, with buffers numbers mention for buy and sell for using as a robot , thanks