Intraday Trading System
- インディケータ
- バージョン: 1.0
- アクティベーション: 5

Would you like to learn a technical system refined by centuries of use, but virtually unknown here? A system so versatile that it can be fused with any other indicator/technical tool? A system as pleasurable to use as it is powerful? If so, this indicator which scans candlestick charting techniques is for you. You should find it valuable no matter what your background in technical analysis.
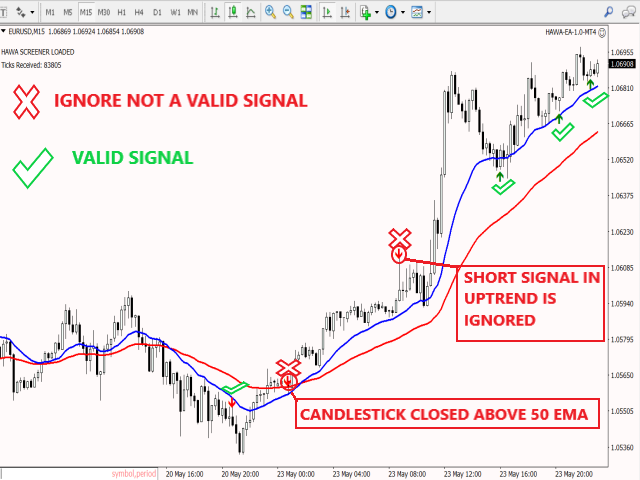
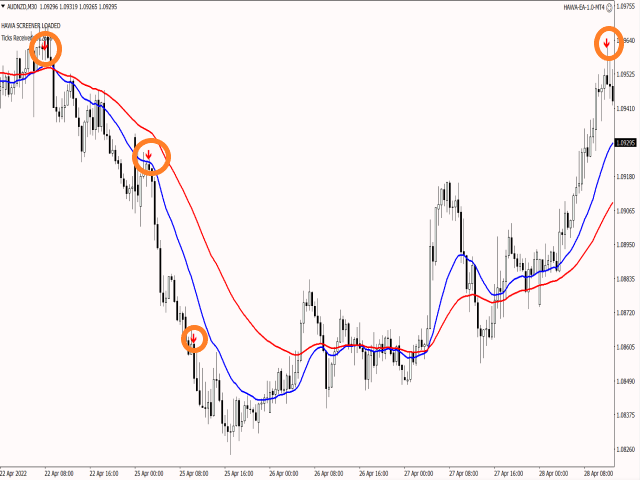
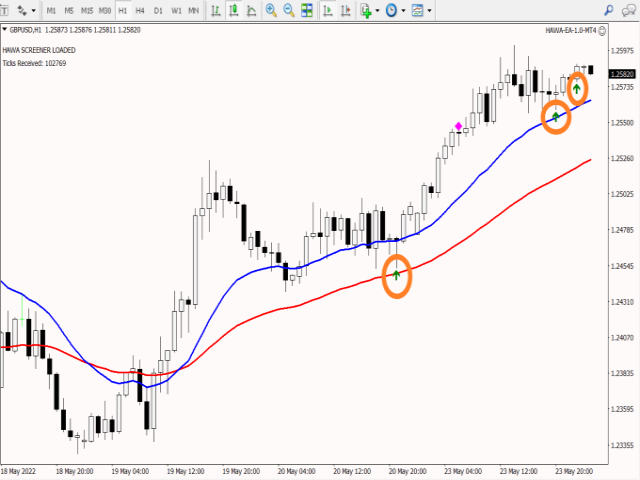
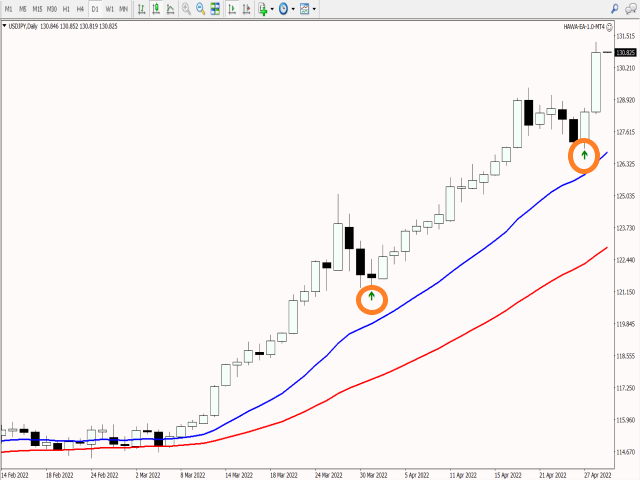
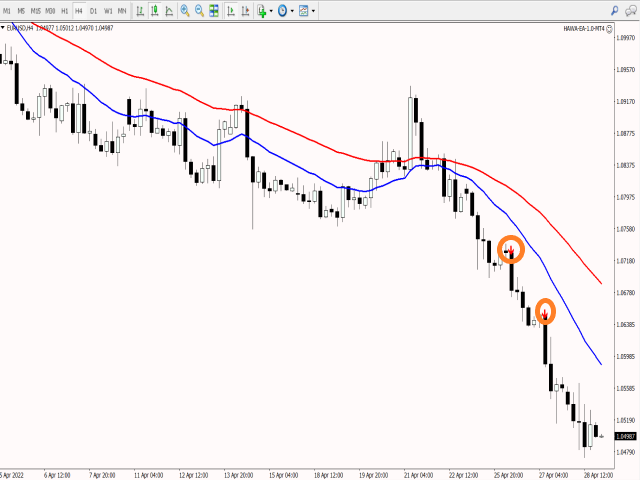
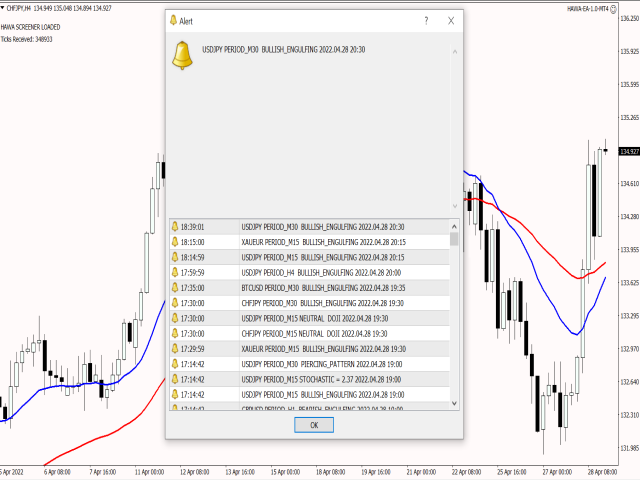
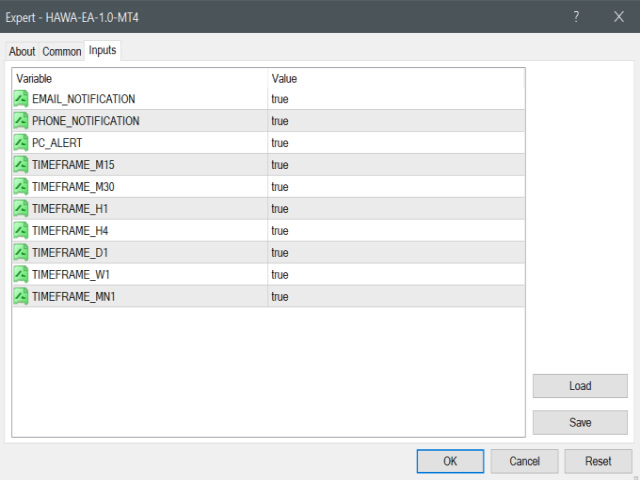
This trading system has been designed after years of hard work and back testing. Indicator will find strong buying or sell zones. Once zone is satisfied arrow will appear on chart. For buying it would be a green arrow and for selling it would be red arrow. Once trading zone is identified, next step is to filter out the right signal from the wrong one. To get a high probability signal, we will filter the trading signal by the following method:
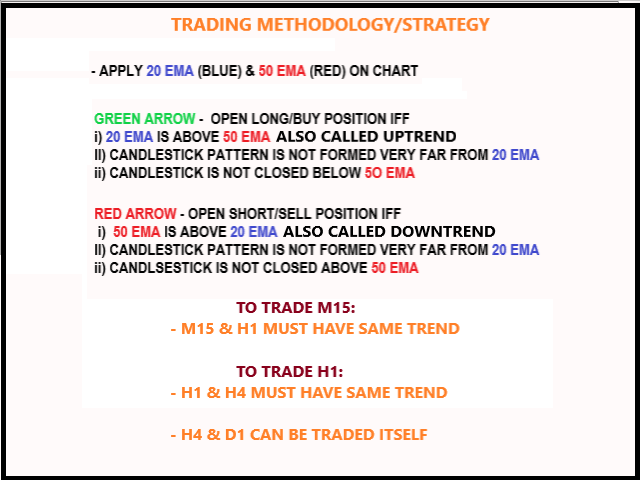
First step is to APPLY 20 EMA (BLUE LINE) & 50 EMA (RED LINE) ON CHART
Next step is to filter the trading signal. If it is a
1) GREEN ARROW - OPEN LONG/BUY POSITION IFF
i) 20 EMA IS ABOVE 50 EMA ALSO CALLED UPTREND
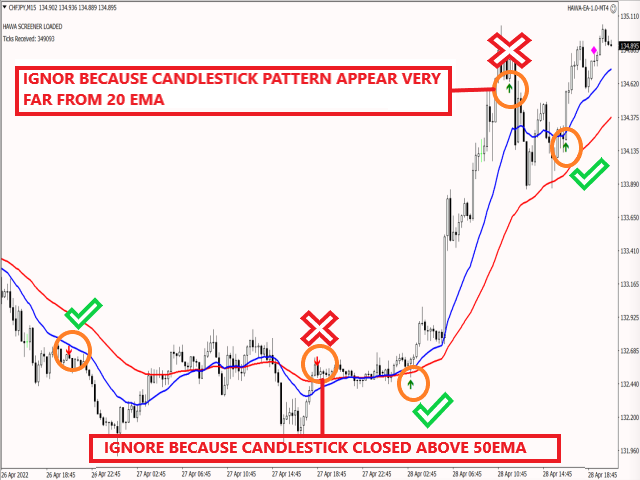
II) CANDLESTICK PATTERN IS NOT FORMED VERY FAR FROM 20 EMA
ii) CANDLESTICK IS NOT CLOSED BELOW 5O EMA
OR if it is a
2) RED ARROW - OPEN SHORT/SELL POSITION IFF
i) 50 EMA IS ABOVE 20 EMA ALSO CALLED DOWNTREND
II) CANDLESTICK PATTERN IS NOT FORMED VERY FAR FROM 20 EMA
ii) CANDLSESTICK IS NOT CLOSED ABOVE 50 EMA
HIGHER TIMEFRAME CONFIRMATION IS MUST FOR M15 & H1 TIMEFRAME TRADING.
Please do not hesitate to ask if you have any question.
Happy trading.