TTM Squeeze Momentum MT5
- インディケータ
- バージョン: 1.0
- アクティベーション: 5

TTM Squeeze Momentum
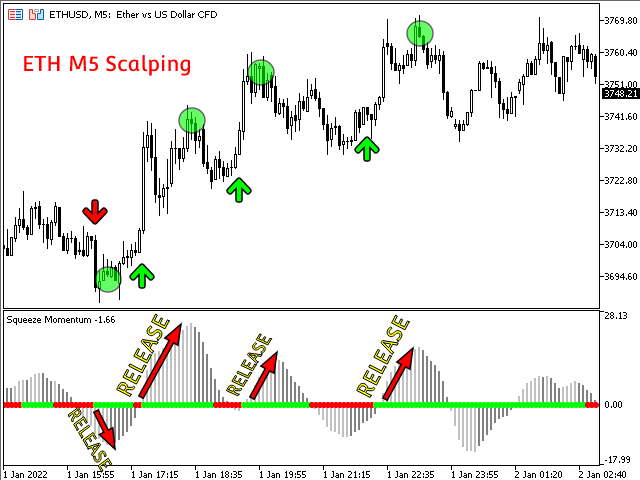
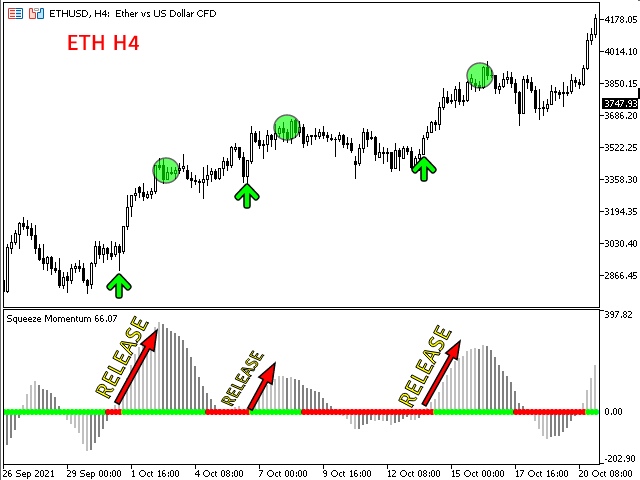
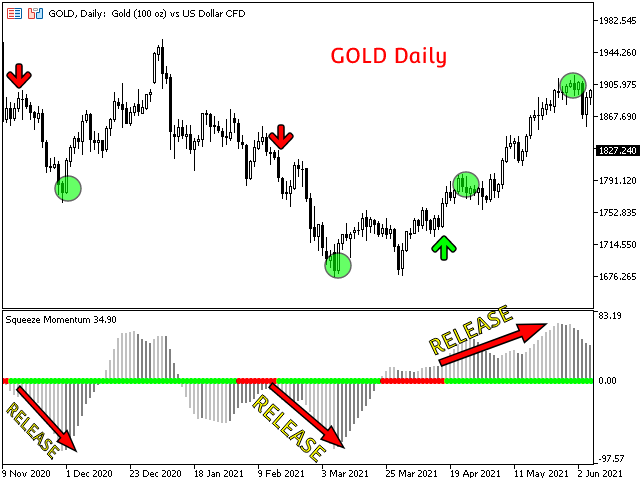
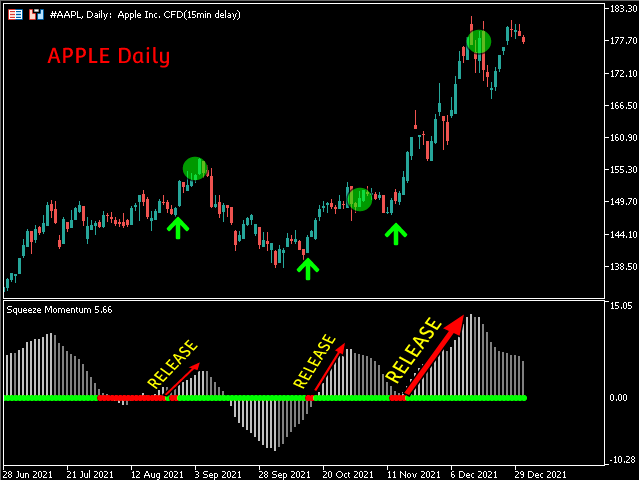
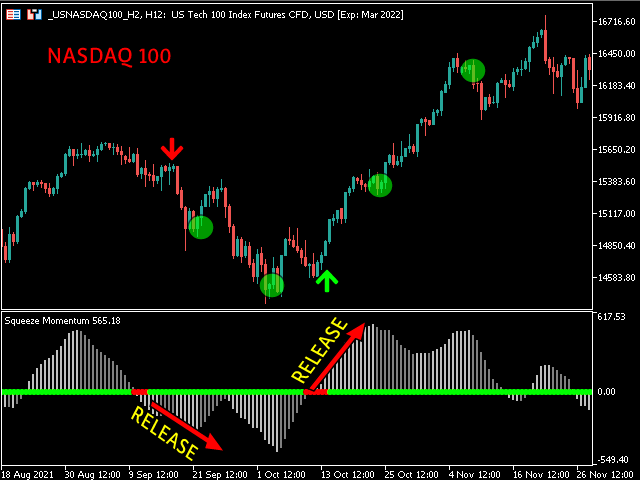
TTM Squeeze Momentum is an enhanced indicator ideal for recognizing consolidation periods in the market and the start of the next explosive move.
This improved version is a volatility indicator based on John Carter's "TTM Squeeze" in which the histogram is based on a linear regression rather than a simple momentum indicator.
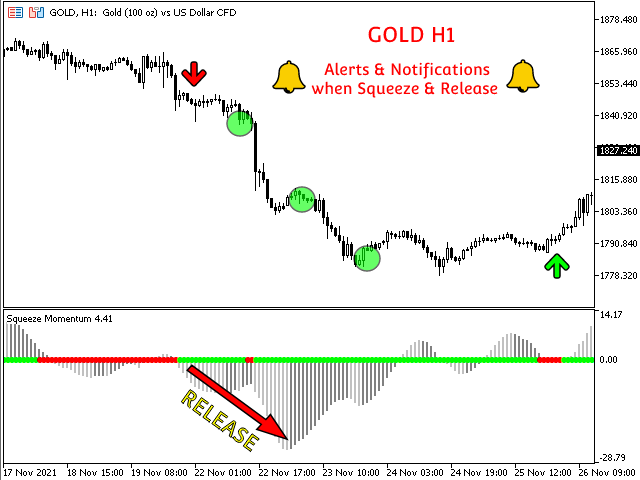
Red dots on the middle line indicate that the market has entered a "Squeeze" zone or consolidation period, indicated in this enhanced version by a combination of the Bollinger and Keltner Bands. These periods indicate that the market is preparing itself for the next explosive move. The start of this movement is indicated by the green dots on the middle line.
It offers a good combination with other indicators such as ADX to anticipate the market and obtain better entry points.
Ideal for HOLD , SCALPING and SWING strategies
At the same time, TTM Squeeze Momentum MT5 provides a system of alerts and notifications on the mobile phone and on the MT5 Terminal when the market enters or leaves a consolidation period.
Some of the characteristics of the indicator are the following:
- Time saving
- Ease of decision-making for entries and taking full or partial benefits
- Highly customizable
- Functional in all pairs (Crypto, Forex, Stocks, Indices, Commodities ...)
- Perfect for Scalping or Swing trading
- Alerts and notifications on the MT5 terminal and on the mobile phone
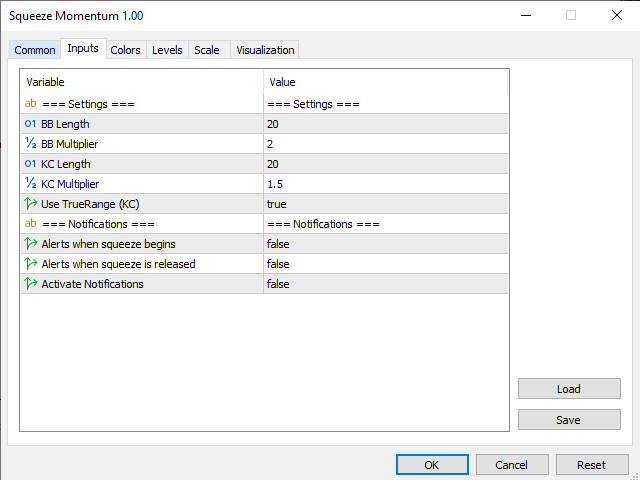
Input parameters
Settings:
- BB Lenght: Bollinger Bands' Period
- BB Multiplier : Bollinger Bands' Multiplier
- KC Length: Keltner Bands' Period
- KC Multiplier : Keltner Bands' Period
- User TrueRange (KC): Use true range in the Keltner Bands' calculation
Colors:
- Customize the indicator colors
Support and questions
Do not hesitate to contact me for any questions and support
Author
Diego Arribas, private investor and speculator, automation engineer in the aerospace industry

Hi Diego, Do you have any notice for this indicator TTM Squeeze Momentum MT5, because I want to know what about the blue dots, not indicated anywhere. Thanks in advance.
DO YOU HAVE ANY NOTICE TO WELL USE OF THIS INDICATOR PLEASE. Could you give my the significant of all these color dots in detail Blue, Red and Green. How can I read the Histogram. THANKS IN ADVANCE.