StoryS

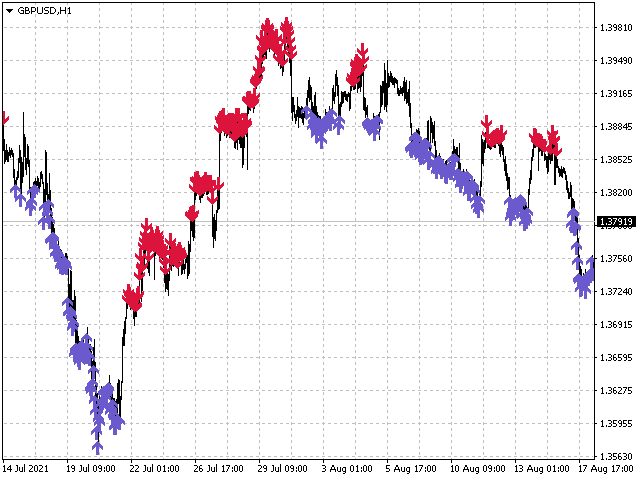
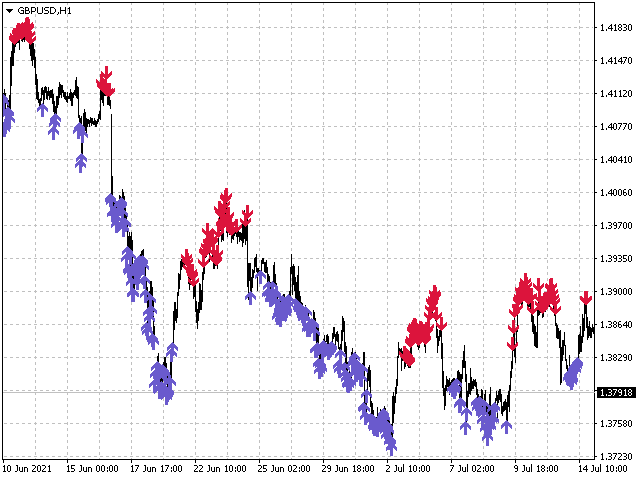
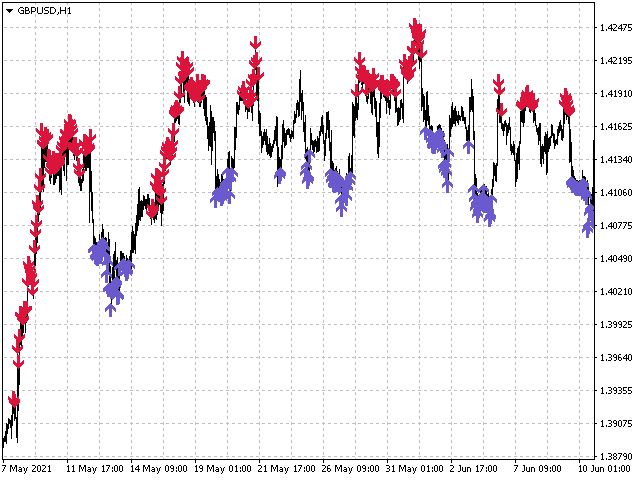
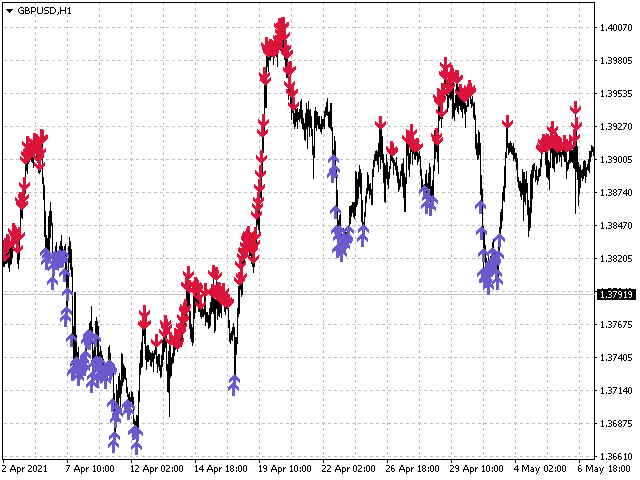
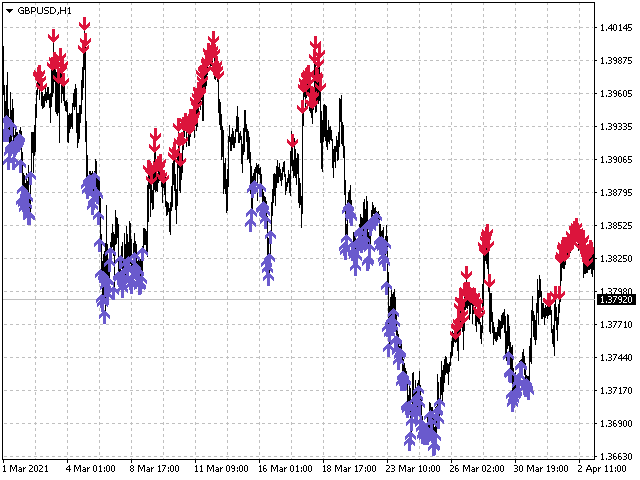
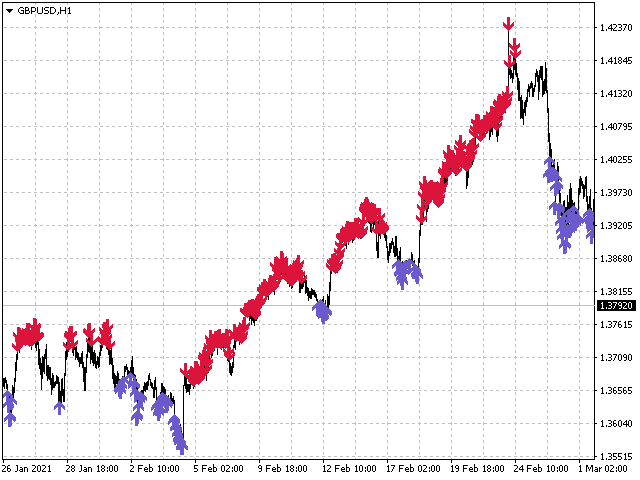
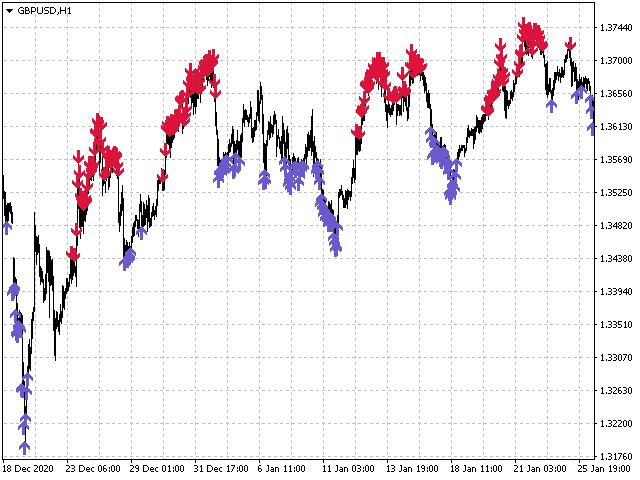
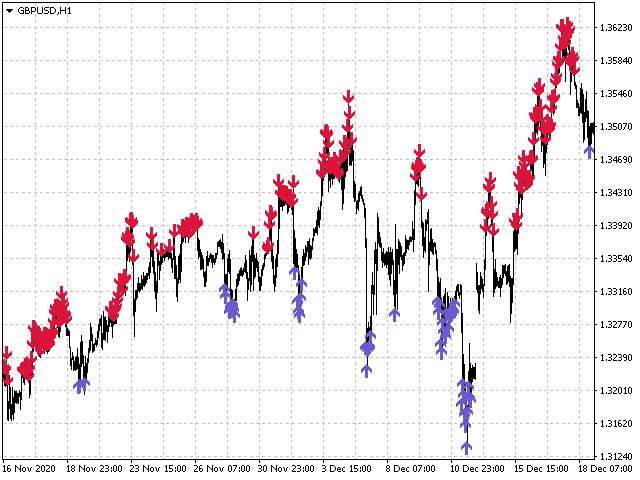
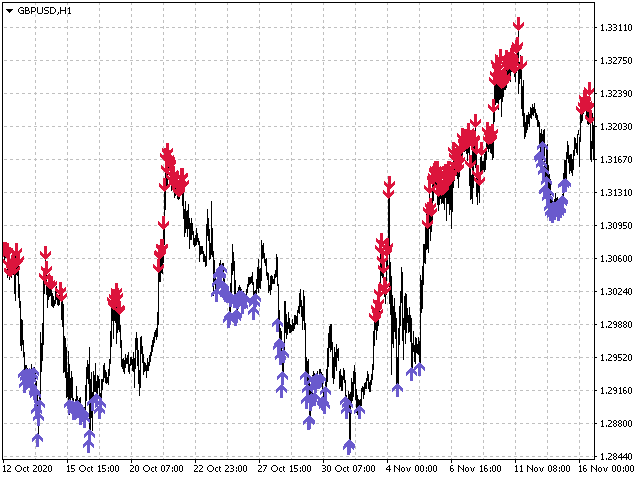
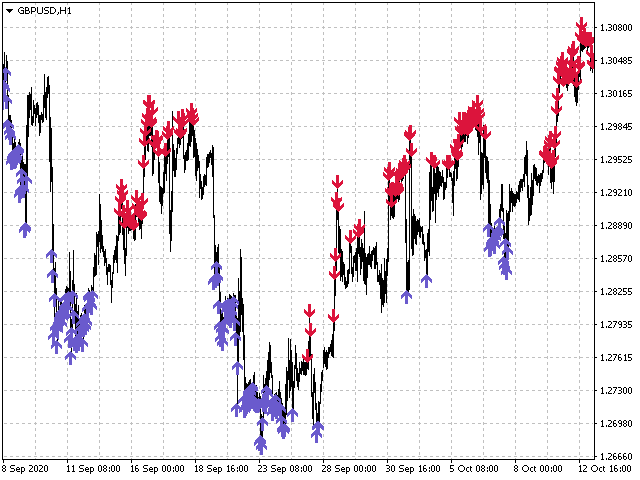
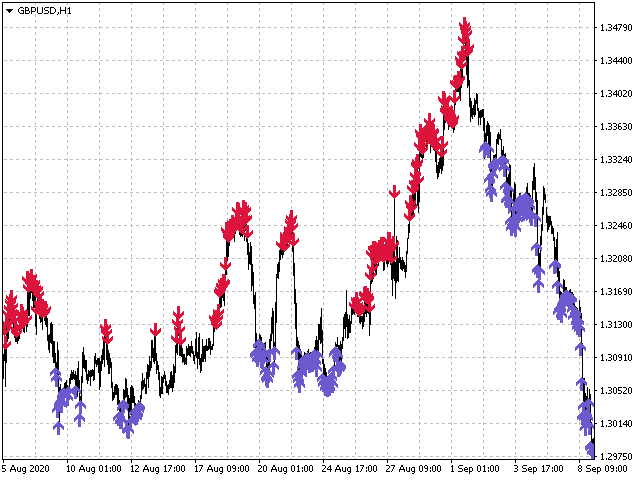
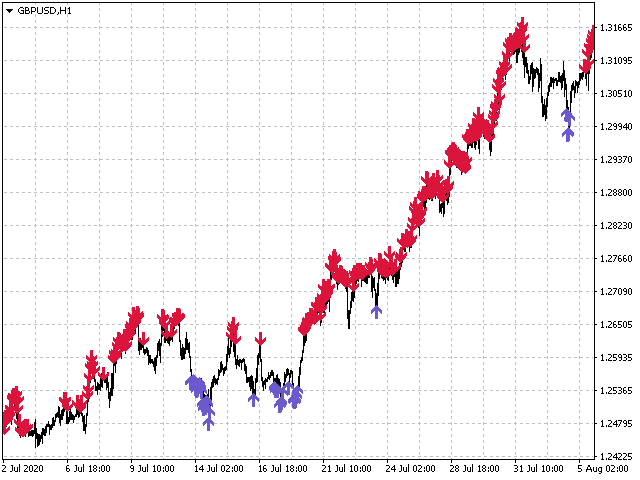
The Story indicator predicts the most likely short-term price movement based on complex mathematical calculations. The indicator is interactive and easily customizable. This is a universal indicator, the values ​​of which are calculated based on complex mathematical calculations. The indicator generates arrows that characterize the current price dynamics. The product can be used as a trend indicator or oscillator.

Peculiarities
  • Estimation of the current price movement;
  • Calculation of the current trend;
  • The algorithms are optimized for performing complex mathematical calculations with a minimum consumption of system resources;
おすすめのプロダクト
Taurus All4 Taurus All4 is a high-performance indicator, it will tell you the strength of the trend, and you will be able to observe the strength of the candle. Our indicator has more than 4 trend confirmations. It is very simple and easy to use. Confirmation Modes Candle Trend Confirmations: When the candle switches to light green the trend is high. When the candle switches to light red the trend is reverting down. When the candle changes to dark red the trend is low. Trendline Trend Confirm
Introduction It is common practice for professional trades to hide their stop loss / take profit from their brokers. Either from keeping their strategy to the themselves or from the fear that their broker works against them. Using this indicator, the stop loss / take profit points will be drawn on the product chart using the bid price. So, you can see exactly when the price is hit and close it manually.  Usage Once attached to the chart, the indicator scans the open orders to attach lines for t
Alpha Trend signは私たちの取引システムを検証し、取引信号を明確に提示し、信号がドリフトすることはありません。 主な機能: •市場が活況を示している地域に応じて、指標に基づいて現在の相場がトレンド相場に属しているか、それとも揺れ相場に属しているかを直感的に判断することができる。 そして、指標の指示矢印に基づいて市場に切り込み、緑の矢印は購入を提示し、赤の矢印は販売を提示する。 •小周期変動による頻繁な取引信号の発生を回避するために、5分以上の時間周期で取引を行うことを推奨します。 •最適な取引タイミングを逃さないために、シグナルプロンプトをオンにすることもできます。 •本指標はトレンド相場をよく予測するだけでなく、幅広振動相場でも利益を得ることができる。 •本指標は大道至簡の原則に基づいており、異なる段階のトレーダーが使用するのに適している。 注意事項: •Alpha Trend signには明確な入退場信号があり、損失を与えないように逆位相操作を提案しない。 •Alpha Trend signは特に成熟した指標であり、デルのチー
SIGNALINE INDICATOR This indicator for all pairs and all timeframes I have just completed the M5 timeframe for deep optimization EURJPY yet. EURJPY M5 Optimization ( TP=150 , SL=130 , IndicatorPeriod=6 , Mov1=22 , Mov2=48 ) (*)Added 20.05.2019 You can find this signal page below https://www.mql5.com/en/signals/583477 Other optimizasyon results will be added on this signalpage. Input Parameters: IndicatorPeriod: Default is 8. Mov1               : Default is 21. Mov2               : Default is 48.
VR Cub
Vladimir Pastushak
VR Cub は、質の高いエントリーポイントを獲得するためのインジケーターです。このインジケーターは、数学的計算を容易にし、ポジションへのエントリーポイントの検索を簡素化するために開発されました。このインジケーターが作成されたトレーディング戦略は、長年にわたってその有効性が証明されてきました。取引戦略のシンプルさはその大きな利点であり、初心者のトレーダーでもうまく取引することができます。 VR Cub はポジション開始ポイントとテイクプロフィットとストップロスのターゲットレベルを計算し、効率と使いやすさを大幅に向上させます。取引の簡単なルールを理解するには、以下の戦略を使用した取引のスクリーンショットを見てください。 設定、設定ファイル、デモ版、説明書、問題解決方法は、以下から入手できます。 [ブログ] レビューを読んだり書いたりすることができます。 [リンク] のバージョン [MetaTrader 5] エントリーポイントの計算ルール ポジションをオープンする エントリーポイントを計算するには、VR Cub ツールを最後の高値から最後の安値までストレッチする必要があります。 最初
Xmasterインジケーターの新しいより正確なバージョン。最も効果的で正確な式を得るために、世界中の200以上のトレーダーが、PCでこのインジケーターのさまざまな組み合わせの15,000以上のテストを実施しました。そしてここでは、正確なシグナルを表示し、再ペイントしない「Xmasterフォーミュラインジケーター外国為替再ペイントなし」インジケーターを紹介します。このインジケーターはまた、電子メールとプッシュによってトレーダーにシグナルを送信します。新しいティックが到着するたびに、75以上のパラメーターで市場を常に分析し、トレーダーに正確な売買シグナルを示します。また、このインディケータの助けを借りて、正しい方向で取引を開始するためにトレンドが現在どの方向に進んでいるかを確認できます。 新しい「Xmasterフォーミュラインジケーターforexno repaint」インジケーターはどのように機能し、古いバージョンと何が違うのですか? まず第一に、それは世界中のさまざまなトレーダーによって15,000回以上テストされた最も最適化された市場分析アルゴリズムです。 第二に、このインジケーター
Binary Options Support Resistance Indicator This indicator is designed for binary options trading and effectively shows retracements from support and resistance levels. Signals appear on the current candle. A red arrow pointing downwards indicates a potential selling opportunity, while a blue arrow pointing upwards suggests buying opportunities. All that needs adjustment is the color of the signal arrows. It is recommended to use it on the M1-M5 timeframes as signals are frequent on these timef
"The trend is your friend" is one of the best known sayings in investing, because capturing large trendy price movements can be extremely profitable. However, trading with the trend is often easier said than done, because many indicators are based on price reversals not trends. These aren't very effective at identifying trendy periods, or predicting whether trends will continue. We developed the Trendiness Index to help address this problem by indicating the strength and direction of price trend
Renko, Heiken Ashi, Ticks Bar, Range Bar.    Easy switching, easy setup, all in one window.        Place the Custom Chart indicator and view Renko, Heiken Ashi, Tick bar, Range bar charts in real time at real chart.    Position the offline chart window so that the indicator control panel is visible.    Switch the chart mode by click of a button.    Connect to the output chart any indicator, expert advisor without any restrictions.    No, it doesn't work in the tester.    Yes, you can use an
The indicator simplifies the decision-making process by recognizing the reversals using the built-in algorithm, and then confirms the signals at the support / resistance levels. In this way, the indicator tracks the market trend with unsurpassed reliability, ignoring the sharp fluctuations in the market and the noise around the average price. The indicator can be used for both small periods and long-term trading. The indicator is not redrawn and not late. 94% of deals are profitable. Take profit
M5 タイムフレームのロボット スカルパー。 GBPUSD 通貨ペアでの取引。このロボットは、英ポンドの取引のためにプロのトレーダーの会社によって特別に開発されました。ロボットは、毎日約 5 ~ 15 の取引を開始します。 GBPUSD のスプレッドが最大 10 ピップスまでの低いブローカーと取引するのが最善です。開始するための推奨最低入金額は $500 以上です。 利点: マーチンゲールは使いません。 ネットではありません。 すべての取引にはストップロスがあります。 GBPUSDペア専用のプロボット。 ロボットスキャルパー、M5 期間の日中取引。 このロボットはどのように取引しますか? 市場を分析するために、ロボットは 2 つの指標の価格モデルと戦略的な市場パターンを使用します: パラボリック ストップとリバース システムとボリンジャー バンド。ロボットは最初に、価格エントラポレーション統計を使用して価格の動きについて市場を分析します。次に、ロボットはこれらの指標を読み取り、現在と過去の動きの傾向を比較します。市場の反転またはロールバックを示すパターンが一致した場合、ロボットは取
Spread and Close MT4
Alexander Denisovich Jegorov
Spread & Candle Close Timer Indicator for MT4  Optimize your trading with this lightweight and efficient indicator, designed to display the real-time spread and candle close countdown directly on your MT4 chart. Features: Live Spread Monitoring – Instantly see market conditions. Candle Close Timer – Stay prepared for the next price movement. Simple & Non-Intrusive Design – No unnecessary settings, just clear and accurate data. Ideal for scalpers, day traders, and those who need real-time exec
This indicator is another variant of the famous powerful indicator Fibonacci-SS https://www.mql5.com/en/market/product/10136 but has different behaviour in placing Pending Order and TP Line. Automatically places Fibonacci retracement lines from the last highest and lowest visible bars on the chart with: An auto Pending Order (Buy/Sell). Taking Profit 1, Taking Profit 2 is pivot point and Taking Profit 3 for extended reward opportunity. The best risk and reward ratio. Simple and powerful indicat
This is a trend indicator without redrawing Developed instead of the binary options strategy (by the color of the Martingale candlestick) Also works well in forex trading When to open trades (binary options) A signal will appear in the place with a candle signaling the current candle It is recommended to open a deal for one candle of the current timeframe M1 and M5 When a blue dot appears, open a deal up When a red dot appears, open a trade down. How to open trades on Forex. When a signal is rec
SMC Venom Model BPR インジケーターは、スマート マネー (SMC) コンセプトで取引するトレーダー向けのプロフェッショナル ツールです。価格チャート上の 2 つの主要なパターンを自動的に識別します。 FVG   (フェアバリューギャップ) は、3 本のローソク足の組み合わせで、最初のローソク足と 3 番目のローソク足の間にギャップがあります。ボリュームサポートのないレベル間のゾーンを形成し、価格修正につながることがよくあります。 BPR   (バランス価格範囲) は、2 つの FVG パターンの組み合わせで、「ブリッジ」を形成します。これは、価格がボリュームアクティビティの少ない動きで動くときに、ブレイクアウトしてレベルに戻るゾーンで、ローソク足の間にギャップを作成します。 これらのパターンは、大規模な市場プレーヤーと一般参加者の相互作用が発生するチャート上のボリュームと価格動向の分析に基づいて、トレーダーが主要なサポート/レジスタンス レベル、ブレイクアウト ゾーン、エントリ ポイントを識別するのに役立ちます。 インジケーターは、長方形と矢印の形でパターンを視
EZZ Elite Zig Zag is an indicator for the MetaTrader 4 terminal. This indicator traces the peak of the trend based on the market reversal, thus showing various opportunities in the financial market. EZZ Elite Zig Zag is a visual tool, intuitive, and easy to understand and use.  Test it Yourself by Downloading it for Free. Author Paulo Rocha all rights reserved
Noize Absorption Index - is the manual trading system that measures the difference of pressure between bears forces and bulls forces. Green line - is a noize free index that showing curent situation. Zero value of index shows totally choppy/flat market.Values above zero level shows how powerfull bullish wave is and values below zero measures bearish forces.Up arrow appears on bearish market when it's ready to reverse, dn arrow appears on weak bullish market, as a result of reverse expectation. S
PipFinite Trend PRO
Karlo Wilson Vendiola
4.88 (2251)
Breakthrough Solution For Trend Trading And Filtering With All Important Features Built Inside One Tool! Trend PRO's smart algorithm detects the trend, filters out market noise and gives entry signals with exit levels. The new features with enhanced rules for statistical calculation improved the overall performance of this indicator. Important Information Revealed Maximize the potential of Trend Pro, please visit www.mql5.com/en/blogs/post/713938 The Powerful Expert Advisor Version Automatin
Indicator for binary options arrow is easy to use and does not require configuration works on all currency pairs, cryptocurrencies buy signal blue up arrow sell signal red down arrow tips do not trade during news and 15-30 minutes before their release, as the market is too volatile and there is a lot of noise it is worth entering trades one or two candles from the current period (recommended for 1 candle) timeframe up to m 15 recommended money management fixed lot or fixed percentage of the depo
Super Reversal Pattern Indicator Unlock the power of advanced pattern recognition with our Super Reversal Pattern Indicator. Designed for traders seeking precision and reliability, this indicator identifies one of the most effective reversal patterns in technical analysis, offering a significant edge in your trading strategy. Key Features: Non-Repainting Accuracy: Enjoy the confidence of non-repainting technology. Once a Super Reversal Pattern is detected, it remains static, providing consiste
Prophet is a trend indicator. Shows the direction of turning points. Can be used with an optimal risk-to-profit ratio. The arrows indicate favorable moments and directions for entering the market. Uses one parameter for setting (adjust from 1 to 3). The probability of a successful trend is very high. In the course of work, the take-profit is much larger than the stop-loss! Works on all currency pairs and on all timeframes.
Heiken Ashi candle chart is an improved version of The Japanese candle chart, which can effectively filter the market "noise" of the Japanese candle chart. It is favored by many traders for its simplicity and intuition. For trend traders, the HA candle chart is a magic tool. Unlike the traditional Japanese candle chart, Heikenashi does not reflect the opening price, high price, low price and closing price of the market. Instead, Heikenashi calculates the value of a single K line in the dominant
FX Flow   indicator can be used as an anticipator of the next trend, preferably confirmed by Price Action or another oscillator (RSi, Stochastic ..). It takes the money flows of the major currencies USD EUR GBP AUD NZD CAD CHF JPY into account, and processes them. Excellent tool for indices, but also for correlations between currencies. Works on each timeframes.  Blue line: Bull market Yellow line: Bear market Note : if the indicator opens the window, but does not draw lines, load the historie
Price Magnet — Price Density and Attraction Levels Indicator Price Magnet is a professional analytical tool designed to identify key support and resistance levels based on statistical Price Density. The indicator analyzes a specified historical period and detects price levels where the market spent the most time. These zones act as “magnets,” attracting price action or forming a structural base for potential reversals. Unlike traditional Volume Profile tools, Price Magnet focuses on price-time d
v. 1.0 This indicator can show with maximum accuracy up to 1 bar the presence of a Maximum/minimum on the chart, regardless of the timeframe. It has a flexible configuration. You can use either one value on all TF, or you can use your own value on each TF individually. This indicator is already being improved and those who purchase it receive all updates for free. Next, it is planned to display an indication of the strength of the pivot point at each extremum (in % or in color drawing). It wi
Axiom Point — Precision Structural Breakout Indicator Axiom Point is a high-performance analytical indicator designed to identify high-probability reversal zones using price-action behaviour and adaptive balance filtering. The indicator applies a multi-layer analytical model to detect moments when price transitions beyond its normal equilibrium area, indicating a potential shift in market momentum. Unlike conventional trend-following tools, Axiom Point focuses on so-called points of no return —
This unique multi-currency strategy simultaneously determines the strength of trends and market entry points, visualizing this using histograms on the chart. The indicator is optimally adapted for trading on the timeframes М5, М15, М30, Н1. For the convenience of users, the indicator renders the entry point (in the form of an arrow), recommended take profit levels (TP1, TP2 with text labels) and the recommended Stop Loss level. The take profit levels (TP1, TP2) are automatically calculated for
The indicator shows entry points with Risk-Reward-Ratio 1 to 5. Main timeframe H1. Works on every pair. The main logic - is to find a reversal level, and then track the price reaction to this level. Doesn't need any settings. As a standard, it paint 5 levels of the same take-profit (red / blue for sellers and buys) and 1 stop-loss level - orange. ATTENTION! The full version of indicator. You can t est full work of indicator free only on the USDCAD pair here  https://www.mql5.com/en/market/produ
「ダイナミック・スキャルピング・オシレーター」は、MT4向けの高度なカスタムCrypto_Forexインジケーターです。効率的な取引ツールです! - 新世代のオシレーター - 使い方は画像をご覧ください。 - ダイナミック・スキャルピング・オシレーターは、適応型の売られ過ぎ/買われ過ぎゾーンを備えています。 - オシレーターは、動的な売られ過ぎ/買われ過ぎエリアから正確なエントリーポイントを見つけるための補助ツールです。 - 売られ過ぎ値:グリーンラインより下、買われ過ぎ値:オレンジラインより上。 - このインジケーターは、プライスアクションパターンと組み合わせるのに最適です。 - 標準的なオシレーターよりもはるかに正確です。 - PCとモバイルの両方でアラート機能付き。 高品質のトレーディングロボットとインジケーターをご覧になるにはここをクリックしてください! これは、このMQL5ウェブサイトでのみ提供されるオリジナル製品です。
このプロダクトを購入した人は以下も購入しています
Neuro Poseidon is a new indicator by Daria Rezueva. It combines precise trading signals with adaptive TP/SL levels - creating best possible trades as a result! Message me and get  Neuro Poseidon Assistant  as a gift to automize your trading process! What makes it stand out? 1. Proven profitability on all assets and timeframes 2. Only confirmed BUY and SELL signals present on the chart 3. Adaptive TP & SL levels generated by the software for each trade 4. Easy to understand - suitable for all
Miraculous Indicator – ガン・スクエア・オブ・ナインに基づく100%非リペイントのFXおよびバイナリーツール この動画では、FXおよびバイナリーオプションのトレーダー向けに特別に開発された、非常に正確で強力な取引ツールである Miraculous Indicator を紹介しています。このインジケーターがユニークなのは、伝説的な ガン・スクエア・オブ・ナイン と ガンの振動の法則 に基づいている点で、現代の取引で利用できる最も正確な予測ツールの一つとなっています。 Miraculous Indicatorは 完全に非リペイント であり、ローソク足が確定した後にシグナルが変化したり消えたりすることはありません。つまり、見たものがそのまま利用できます。これにより、トレーダーは自信を持ってエントリーおよびエグジットを行うための信頼性と一貫性のある根拠を得ることができます。 主な特徴: ガン・スクエア・オブ・ナインとガン理論に基づいて構築 100%非リペイントのシグナルシステム すべての時間枠(M1、M5、H1、H4、日足、週足)で機能 FXおよびバイナリーオプション取引
Dynamic Forex28 Navigator - 次世代の Forex 取引ツール。 現在 49% オフ。 Dynamic Forex28 Navigator は、長年人気のインジケーターを進化させたもので、3 つの機能を 1 つにまとめています。 Advanced Currency Strength28 インジケーター (レビュー 695 件)  + Advanced Currency IMPULSE with ALERT (レビュー 520 件) + CS28 コンボ シグナル (ボーナス)。 インジケーターの詳細 https://www.mql5.com/en/blogs/post/758844 次世代の Strength インジケーターが提供するもの  オリジナルで気に入っていたすべての機能が、新機能と精度の向上によって強化されました。 主な機能: 独自の通貨強度計算式。 すべての時間枠でスムーズかつ正確な強度ライン。 トレンドの特定と正確なエントリーに最適です。 ダイナミックマーケットフィボナッチレベル (マーケットフィボナッチ)。 このインジケーターに固有
RelicusRoad Pro: 定量的市場オペレーティングシステム 【期間限定】無制限アクセス 70% OFF - 2,000人超のトレーダーと共に なぜ多くのトレーダーは「完璧な」インジケーターを使っても失敗するのでしょうか? それは、文脈を無視して 単一の概念 だけでトレードしているからです。文脈のないシグナルは単なるギャンブルです。勝ち続けるには、 根拠の重なり(コンフルエンス) が必要です。 RelicusRoad Proは単なる矢印インジケーターではありません。完全な 定量的市場エコシステム です。独自のボラティリティモデリングを用いて、価格が推移する「適正価値の道(Fair Value Road)」をマッピングし、ノイズと真の構造的ブレイクを判別します。 推測はやめましょう。機関投資家レベルの「ロード・ロジック」でトレードを。 コアエンジン:「Road」アルゴリズム システムの中心となる Road Algo は、市場環境にリアルタイムで適応するダイナミックなボラティリティチャネルです。 安全ライン(平衡点) と、価格が数学的に反転しやすい 拡張レベル を投影します。 Si
Gannスクエアインジケーターは、W.D. Gannによって執筆された「市場予測のための数学的な式」の記事に基づく強力な市場分析ツールです。このツールは、解析に数学的な概念を応用し、Gann理論に基づいています。それは、144、90、52のスクエアや9のスクエアなど、Gannの関連テクニックの要素を取り入れています。さらに、の方法を組み込んでおり、9のスクエアとその関連性についてのチャネルやスターパターンに焦点を当てています。 ユーザーマニュアルと使用方法: このインジケーターを使用する前に、ユーザーマニュアルを読んで疑問点を解決するためにお問い合わせいただくことをお勧めします。ユーザーマニュアルの完全版は、当社のウェブサイトで入手できます。 MT5の完全版は購入できますし、MT4の無料版も試すことができます。両方のバージョンへのリンクを提供していますので、ご利用ください。 主な機能と機能: Gannスクエアインジケーターは、市場分析のための完全なツールセットを提供し、幾何学的な概念とGann理論に基づいて的確な判断を行う手助けをします。以下に主な機能を示します。 9のスクエアの分析:
Enigma Scalper  Overview Enigma Scalper Pro is a multi-filter breakout indicator designed for traders who want clean entry signals with confirmation from several technical conditions instead of relying on a single trigger. The indicator combines: 3-Bar Breakout pattern detection Higher Timeframe confluence Bollinger Band extreme filtering RSI momentum analysis Optional EMA trend filtering ATR-based SL/TP projection Signals are generated only after candle close to ensure stable non-repainting beh
このインジケーターは実践的なトレードに最適な自動波動分析のインジケーターです! 場合... 注:   Tang Lun (Tang Zhong Shuo Zen) の命名規則の影響で、私は波のグレーディングに西洋の名前を使用することに慣れていません。基本的な波を ペン 、二次波のバンドを セグメント と名付けました。同時に、 セグメント にはトレンドの方向が指定されます (この命名方法は将来のノートで使用されます。最初に言っておきます)。ただし、アルゴリズムは曲がりくねった理論とはほとんど関係がないため、付けるべきではありません。これは、私の市場分析 によって要約された、絶えず変化する複雑な運用ルール を反映しています。 バンドは標準化され、人によって異なることがないよう定義されており、市場参入を厳密に分析する上で重要な役割を果たす人為的な干渉の描画方法が排除されています。 このインジケーターを使用することは、取引インターフェイスの美しさを改善することと同等であり、元の K ライン取引を放棄し、取引の新しいレベルに連れて行きます。また、宣伝の観点から顧客の認識も向上します。 イ
多くの矢印インジケーターは、シグナルだけを表示して、その後の判断はすべてトレーダー任せです。KT Alpha Hunter Arrows は、最初から完成されたトレードプランを提供します。 各シグナル矢印が表示されると、エントリーライン、ストップロス、4つのテイクプロフィット水準、そして現在の銘柄と時間足を今トレードする価値があるかを示すリアルタイムのエッジ判定が、チャート上にまとめて描画されます。付属の Trade Manager EA は、手動でエントリーした後の管理をサポートし、相場が荒れて感情が揺れやすい場面でも、トレードの規律を保ちやすくします。リペイントなし。確定足のみでシグナルを表示。Forex、ゴールド、指数、その他あなたが取引するあらゆる銘柄向けに設計されています。 主な機能 リペイントしない買い・売り矢印。シグナルは足が確定した後にのみ表示されます。 各シグナルにエントリーライン、構造的なストップロス、4つのテイクプロフィット水準を表示。 Edge Dashboard が、現在のチャート上で買いと売りのセットアップを個別に評価。 判定システム:No Edge、Ma
Enigmera
Ivan Stefanov
5 (8)
ENIGMERA: 市場の中心 重要:MQL5.comのデモはStrategy Testerで実行されており、Enigmeraの機能を完全には反映していない場合があります。詳細については、説明、スクリーンショット、ビデオをご確認ください。質問があれば、遠慮なくメッセージを送ってください! インジケーターのコードは完全に書き直されました。バージョン3.0は新機能を追加し、インジケーターの開始以来蓄積されたバグを修正しました。 紹介 このインジケーターとトレーディングシステムは、金融市場への注目すべきアプローチです。ENIGMERAはフラクタルサイクルを使用して、サポートとレジスタンスのレベルを正確に計算します。真の蓄積フェーズを示し、方向と目標を提供します。トレンドでも修正でも機能するシステムです。 動作方法 インジケーターのほとんどの機能は、チャートの左側にあるボタンで制御され、市場の状況に迅速に対応できるようになっています。 ボタン ON/OFF – インジケーター全体を表示または非表示にします。 Channel – サポートチャネルを有効にし、許容範囲の偏差を示します。 Dev
この製品は 2026 年の市場向けに更新され、最新の MT5 ビルドに最適化されています。 価格更新のお知らせ: Smart Price Action Concepts は現在 $200 で提供されています。 次の 30 件の購入 後、価格は $299 に上がります。 特別オファー: 購入後、私にプライベートメッセージを送ることで、 無料ボーナス + ギフト を受け取ることができます。 まず、このトレーディングツールはリペイントなし、再描画なし、遅延なしのインジケーターであり、プロフェッショナルな取引に最適であることを強調しておきます。 Online course , and manual Smart Price Action Concepts Indicator は、初心者から経験豊富なトレーダーまで使える非常に強力なツールです。20 種類以上の便利なインジケーターを 1 つにまとめ、Inner Circle Trader Analysis や Smart Money Concepts Trading Strategies などの高度な取引アイデアを組み合わせています。このインジケ
Sniper Delta Imbalance is a professional tool for deep delta analysis — the difference between buyer and seller volumes. It takes volume analysis to the next level, allowing traders to see in real time who controls the price — buyers or sellers — and to find precise entry points based on the actions of major market participants. This tool represents a unique style of analysis based on the ratio of demand and supply volumes and can be used to detect who holds control over price. At the core o
Trend Breakout Arrows Indicator The Trend Breakout Arrows Indicator is a momentum-based signal tool designed to identify potential bullish and bearish breakout opportunities. It displays clear arrow signals directly on the price chart, helping traders quickly recognize possible trend changes and continuation setups. Up Arrow (Buy Signal) A magenta up arrow appears below a candle when bullish momentum begins to strengthen. This signal indicates that buying pressure may be overtaking selling press
「 Dynamic Scalper System 」インジケーターは、トレンド波の中でスキャルピング取引を行う手法のために設計されています。 主要通貨ペアと金でテスト済みで、他の取引商品との互換性があります。 トレンドに沿った短期的なポジションオープンのシグナルを提供し、追加の価格変動サポートも提供します。 インジケーターの原理 大きな矢印はトレンドの方向を決定します。 トレンド波の中では、小さな矢印の形でスキャルピングシグナルを生成するアルゴリズムが機能します。 赤い矢印は強気方向、青い矢印は弱気方向です。 トレンドの方向には敏感な価格変動ラインが描かれ、小さな矢印のシグナルと連動します。 シグナルは次のように機能します。適切なタイミングでラインが現れるとエントリーシグナルが形成され、ラインが開いている間はポジションが保持され、完了すると取引が終了します。 推奨される動作時間枠はM1~H4です。 矢印は現在のローソク足に形成され、次のローソク足が開いている場合は、前のローソク足の矢印は再描画されません。 入力パラメータ Trend Wave Period - トレンド方向
Introduction to Fractal Pattern Scanner Fractal Indicator refers to the technical indicator that makes use of the fractal geometry found in the financial market. Fractal Pattern Scanner is the advanced Fractal Indicator that brings the latest trading technology after the extensive research and development work in the fractal geometry in the financial market. The most important feature in Fractal Pattern Scanner is the ability to measure the turning point probability as well as the trend probabi
Step into the world of Forex trading with confidence, clarity, and precision using   Gold Indicator   a next-generation tool engineered to take your trading performance to the next level. Whether you’re a seasoned professional or just beginning your journey in the currency markets, Gold Indicator equips you with powerful insights and help you trade smarter, not harder. Built on the proven synergy of three advanced indicators, Gold Indicator focuses exclusively on medium and long-term trends eli
IQ FX Gann Levels a precision trading indicator based on W.D. Gann’s square root methods . It plots real-time, non-repainting support and resistance levels to help traders confidently spot intraday and scalping opportunities with high accuracy. William Delbert Gann (W.D. Gann) was an exceptional market analyst, whose trading technique was based on a complex blend of mathematics, geometry, astrology, and ancient mathematics which proved to be extremely accurate. Setup & Guide:  Download  MT5 Ver
ゴールドラッシュ・トレンド・アロー・シグナル ゴールドラッシュ・トレンド・アロー・シグナル 指標は、XAU/USDにおける高速・短期スキャルパー向けに最適化された、正確でリアルタイムのトレンド分析を提供します。 1分足専用に設計されたこのツールは、明確なエントリーポイントを示す方向矢印を表示し、スキャルパーが変動の激しい市場状況でも自信を持って取引できるよう支援します。 この指標は、PRIMARY(主要)とSECONDARY(補助)のアラート矢印で構成されています。PRIMARYシグナルは、トレンドの方向転換を示す白と黒の方向矢印であり、SECONDARYシグナルは、PRIMARY矢印が示す方向を確認し、潜在的なエントリーポイントを示す青と赤の矢印です。 注意:トレンド方向の変化後にPRIMARYアラート矢印が1つだけ表示される場合、複数のSECONDARY青/赤矢印が表示される点に注意が必要です。SECONDARYシグナルは、シグナル基準を満たす任意のローソク足後に表示されます。したがって、長期的なトレンド移動の場合、画面に多くのSECONDARY矢印が表示されます(添付の
Quant Direction
Georgios Kalomoiropoulos
Quant Direction は、3次元の市場分析ツールです。完全に客観的なアルゴリズムベースの市場分析を提供し、様々なパラメータにわたる正確なパーセンテージ偏差を同時に算出します。高度なAI搭載モデリングツールで開発され、厳密なテストを経て開発されたこのアルゴリズムは、かつてない精度で市場を分析するように設計されています。プラットフォーム上では、あらゆる通貨ペアや金融商品を分析できます。 短期取引、デイトレード、スイングトレードなど、どのような取引スタイルに も、Quant Directionは最適な選択肢です。 オペレーターの本当の利点 Quant Directionの真の利点は、感情、眼精疲労、過剰分析を完全に排除できる点にあります。方向性を探るために何十ものチャートを手作業で精査したり、自分の好みを常に疑ったりする必要がなくなります。このシステムは、8つの時間間隔(5ヶ月から月単位まで)をミリ秒単位で処理します。あらゆる瞬間に市場を支配している主体を正確に明らかにし、常に成功確率が最も高い方向で取引できるようにします。 市場分析の3つの側面 このアルゴリズムは市場を3つの
NAM Order Blocks
NAM TECH GROUP, CORP.
3.67 (3)
MT4マルチタイムフレームオーダーブロック検出インジケーター。 特徴 -チャートコントロールパネルで完全にカスタマイズ可能で、完全な相互作用を提供します。 -必要な場所でコントロールパネルを表示および非表示にします。 -複数の時間枠でOBを検出します。 -表示するOBの数量を選択します。 -さまざまなOBユーザーインターフェイス。 -OBのさまざまなフィルター。 -OB近接アラート。 -ADRの高線と低線。 -通知サービス(画面アラート|プッシュ通知)。 概要 注文ブロックは、金融機関や銀行からの注文収集を示す市場行動です。著名な金融機関と中央銀行が外国為替市場を牽引しています。したがって、トレーダーは市場で何をしているのかを知る必要があります。市場が注文ブロックを構築するとき、それは投資決定のほとんどが行われる範囲のように動きます。 注文の構築が完了すると、市場は上向きと下向きの両方に向かって急激に動きます。注文ブロック取引戦略の重要な用語は、機関投資家が行っていることを含むことです。それらは主要な価格ドライバーであるため、機関投資家の取引を含むあらゆる戦
El indicador "MR BEAST ALERTAS DE LIQUIDEZ" es una herramienta avanzada diseñada para proporcionar señales y alertas sobre la liquidez del mercado basándose en una serie de indicadores técnicos y análisis de tendencias. Ideal para traders que buscan oportunidades de trading en función de la dinámica de precios y los niveles de volatilidad, este indicador ofrece una visualización clara y detallada en la ventana del gráfico de MetaTrader. Características Principales: Canal ATR Adaptativo: Calcula
チャートを構成し、周期的な価格変動を識別するテクニカル指標。 どのチャートでも動作します。 いくつかの種類の通知。 グラフ自体に追加の矢印があります。 履歴を再描画せずに、キャンドルのクローズに取り組みます。 M5以上のTFを推奨します。 パラメータの使用と設定が簡単です。 異なるパラメータを持つ 2 つのインジケーターを使用する場合、他のインジケーターなしで使用できます。 入力パラメータは2つあります 周期性と信号持続時間 これら 2 つのパラメータは、チャート構造の処理を扱います。 Cyclicity - 反転サイクルが変化する頻度を調整し、サイクルを滑らかにします。 Signal duration - 最小数では価格変動の衝動を検出し、最大数では長期的なトレンドの動きを検出します。
このインジケーターは、エリオット波動理論と組み合わせて作動し、2つの方法で使用されます: 自動モード: このモードでは、インジケーターがチャート上の全ての5つのモーティブ波を自動的に検出し、予測とポテンシャルな逆転ゾーンを提供します。また、アラートやプッシュメッセージを生成する能力も備えています。この自動機能により、エリオット波動パターンの識別と分析のプロセスが効率化されます。 手動モード: このオプションは、エリオット波動理論を手動で扱いたいトレーダー向けです。9つの段階を使用して波を描画することができます。各段階は、表示された後に描画されたラインを調整して個別に定義できます。この機能により、手動で波を描画するプロセスがより効率的になります。重要な点として、すべての描画データが将来の参照のためにプラットフォームのデータフォルダに保存されることに注意してください。 パラメータ: Name: インジケーターの名前。 Use_System_Visuals: インジケーターのテーマを有効または無効にして、取引プラットフォーム全体の外観に合わせます。 Explain_Comment: 波の番号
A scalping indicator based on mathematical patterns, which on average gives signals with relatively small SL, and also occasionally helps to catch big moves in the markets (more information in the video) This indicator has three main types of notifications: The first type warns of a possible/upcoming signal on the next bar The second type indicates the presence of a ready signal to enter the market/open a position The third type is for SL and TP levels - you will be notified every time price re
Advanced Market Footprint Profiles is a specialized market analysis tool, representing a customized volume distribution profile enhanced with Delta and Bid/Ask profiles. The indicator builds fixed horizontal profiles (Fixed Range), displaying the distribution of Volume, Delta, and Bid/Ask at each price level with high precision. Unlike standard horizontal volume profiles, which only show overall volume distribution, this indicator combines Volume, Delta, and Bid/Ask within the selected range a
Gold Channel is a volatility-based indicator, developed with a specific timing algorithm for the XAUUSD pair, which consists of finding possible corrections in the market. This indicator shows two outer lines, an inner line (retracement line) and an arrow sign, where the theory of the channel is to help identify overbought and oversold conditions in the market. The market price will generally fall between the boundaries of the channel. If prices touch or move outside the channel it is a tradi
Buy Sell Signal Pro Looking for a precise and efficient swing detection tool that clearly identifies market structure turning points? Need consistent and easy-to-read buy and sell signals across different timeframes and instruments? Buy Sell Signal Pro  is designed to deliver accurate swing identification with a clean and practical approach, helping traders interpret price structure with confidence. Overview This indicator detects key market structure points, including: Higher Highs (HH) Higher
現在30%OFF! 初心者やエキスパートトレーダーのためのベストソリューション! このダッシュボードソフトウェアは、28の通貨ペアで動作しています。それは私達の主要な指標(高度な通貨の強さ28と高度な通貨インパルス)の2に基づいています。それは全体の外国為替市場の大きい概観を与えます。それは、すべての(9)時間枠で28の外国為替ペアのための高度な通貨の強さの値、通貨の動きの速度と信号を示しています。チャート上で1つのインディケータを使用して市場全体を観察し、トレンドやスキャルピングの機会をピンポイントで見つけることができたら、あなたのトレードがどのように改善されるか想像してみてください。 このインディケータには、強い通貨と弱い通貨の識別、潜在的な取引の識別と確認がより簡単になるような機能が搭載されています。このインディケータは、通貨の強さや弱さが増加しているか減少しているか、また、すべての時間枠でどのように機能しているかをグラフィカルに表示します。 新機能として、現在の市場環境の変化に適応するダイナミックなマーケットフィボナッチレベルが追加され、すでに当社のAdvanced
MV Arrow– Professional Swing Signal Indicator comment for set files and user manual. MV Arrow v4.0 is a precision-based MT4 arrow indicator designed to identify high-probability swing BUY and SELL zones using a multi-filter confirmation system. It focuses on market extremes , filtering noise and low-quality signals to deliver clear, well-spaced trade opportunities . This indicator is ideal for traders who prefer clean charts, disciplined entries, and confirmation-based signals rather than co
Super Signal – Skyblade Edition プロ仕様のノンリペイント / ノーラグ・トレンドシグナルシステム。卓越した勝率を実現 | MT4 / MT5 対応 1分足、5分足、15分足などの低い時間足で最も効果を発揮します。 主な特徴: Super Signal – Skyblade Edition は、トレンド取引に特化したスマートなシグナルシステムです。マルチレイヤーのフィルターロジックを用いて、明確な方向性と実際のモメンタムに支えられた強力なトレンドのみを検出します。 このシステムは 天井や底を予測するものではありません 。次の3つの条件がすべて満たされた場合にのみシグナルを発生させます: 明確なトレンド方向 モメンタムの増加 健全なボラティリティ構造 市場セッションに基づく流動性分析と組み合わせることで、シグナルの精度とタイミングがさらに向上します。 シグナルの特性: すべての矢印シグナルは 100% 非リペイント / 遅延なし 一度出現したシグナルは固定され、点滅・消失しません チャート上の矢印、情報パネル、ポップアップ通知、音声アラート、プッシュ通知
The "MR Volume Profile 4" indicator is a charting tool that displays trading volume at different price levels rather than time intervals. A key concept in volume profile is the point of control (POC)—the price level with the highest volume traded during the session or time range. While tools like VWAP or OBV provide volume trends, the "MR Volume Profile 4" indicator offers granular detail about where the most market activity occurs at specific price levels. This makes it a more precise tool for
作者のその他のプロダクト
The original BoomTroom trend indicator. With this indicator, you do not need to sit near the computer and wait for the inflection point to appear day and night. How important it is to determine the trend in the stock market or the Forex market! Still not sure how to determine the inflection point of a trend? Are you still worried about how to draw short-term and long-term trend lines? Run this smart utility. You will see pivot points of varying strength, as well as long-term and short-term tre
The Forex market can go through many different price paths to reach a point in the future. The future is dynamic. Therefore, planning a trade with a possible future scenario is an essential step for your success. For these purposes, we present to your attention Trend Units. A unique author's strategy that simultaneously determines the strength of trends and points of entry into the market, visualizing it using arrows on the chart. The indicator is optimally adapted for trading on time periods
Trend Basement indicator showing buy and sell areas. The indicator follows price movement around the opening price. It also displays information about the trend following the breakout of the low and high. The indicator has a very simple but effective chart: an orange dot is displayed above the open price, and a blue one below the open price. The indicator also includes a sound alert and a pop-up window that notifies you when the candle closes at these important levels. The indicator will allow y
Trend Sys, an indicator designed to detect trends in price movement and allows you to quickly determine the direction of the trend. The best way to trade Trend Sys is to enter the market when Trend Sys peaks and goes the other way. This is a sign of a trend reversal. I hope you enjoy this indicator and leave your comments to make it even better. Good luck and happy trading.
Using the Trend Moment indicator, you can find not only overbought and oversold zones, but also be able to identify the strongest reversals of the current trend. This will take your trading to a whole new level. Forget about slipping in oscillators, be it Stochastic or RSI or any other oscillator. Trend Moment signals 100% do not redraw and do not require adjusting the parameters - the indicator will work equally well on any chart, even with default parameters.
Trend Sens is a universal indicator, the values of which are calculated based on different indicators. The iPump indicator is a versatile indicator that combines the advantages of three categories of indicators. You get 3 indicators in 1 product. Trend Sense itself appeared in the process of many years of work with financial assets. The indicator has become a consequence of those desires and requirements, for the analysis that I personally would like to use for trading.
With the development of information technologies and a large number of participants, financial markets are less and less amenable to analysis by outdated indicators. Conventional technical analysis tools, such as the Moving Average or Stochastic, in their pure form are not able to determine the direction of the trend or its reversal. Can one indicator indicate the correct direction of the future price, without changing its parameters, in the history of 14 years? At the same time, not to lose ad
The Trend Map indicator is designed to detect trends in price movement and allows you to quickly determine not only the direction of the trend, but also to understand the levels of interaction between buyers and sellers. It has no settings and therefore can be perceived as it signals. It contains only three lines, each of which is designed to unambiguously perceive the present moment. Line # 2 characterizes the global direction of the price movement. If we see that the other two lines are above
Trend LineA is a powerful trend indicator equipped with everything you need to trade and at the same time very easy to use. The indicator calculates the most probable zones of trend stop / reversal, zones of confident trend movements. The indicator works on all timeframes and currency pairs. The indicator gives quite accurate signals and it is customary to use it both in trend and flat markets. It is advisable to use the indicator in combination with other instruments for more reliable signals
Original Trrend Arrow trend indicator showing buy and sell areas. With this indicator, you do not need to sit near the computer and wait for the inflection point to appear day and night. The indicator is very easy to use. When an up arrow appears, open a buy deal. When a down arrow appears, open a sell trade. The indicator works on all timeframes and currency pairs. It is advisable to use the indicator in combination with other instruments for more reliable signals and making a more balanced
One of the biggest challenges traders face is finding the trading system that's right for them. Trend Op indicator predicts the most likely short-term price movement based on complex mathematical calculations. This indicator is designed to detect trends in price movement and allows you to quickly determine not only the direction of the trend, but also to understand the levels of interaction between buyers and sellers. It has no settings and therefore can be perceived as it signals.
The Trend Hist indicator is designed to display on a chart and visually evaluate the trailing algorithm by inside bars. This indicator finds strong trend movements of a currency pair on a given number of bars, and also finds a correction to this trend. If the trend is strong enough, and the correction becomes equal to the one specified in the parameters, then the indicator signals this.
The Trend Slow indicator uses the author's algorithm for analyzing price behavior and displays the result of complex work in the form of lines. For simplicity, the algorithm automatically changes the line color according to its direction. The indicator has a parameter to enable alerts when the color changes, thus helping the trader to identify new market trends. This system will help you find high-probability trades in the direction of strong trends.
Индикатор тренда Decisive , показывает моменты для входа в рынок стрелками. Это гибридный индикатор, так как основывается на сигналах нескольких двух достаточно известных продуктов - индикатор среднего истинного диапазона, который определяет диапазон минимальных и максимальных ценовых колебаний, а также цен закрытия. В результате - указывает текущую рыночную волатильность. Также индикатор семейства осцилляторов. Индикатор помогает рассчитать уровни перепроданности и перекупленности торгового ин
The Effect indicator shows the points of potential market reversal. Simple, visual and efficient trend detection. Ready-made trading system. The intelligent algorithm of the indicator determines the trend with good probability. Uses just one parameter for settings. The indicator does not redraw and does not lag. Works on all currency pairs and all timeframes. You should remember that using a combination of forecasting tools, it is advisable to choose 2-3 indicators for trading. Otherwise, thei
American traders say: “Trend is your friend”, which means “Trend is your friend”. And indeed it is! By trading with the trend, you reduce your risks and gain an advantage, as you increase the mathematical expectation of completed trades and, therefore, earn more profit. Together with the Going straight indicator you will trade with the trend with ease! This is one of the most effective ways to deal with market trends. Trading strategies using the channel indicator belong to the classic methods
Schrodinger Channel is a non-redrawing channel indicator based on moving averages, it takes into account not simple moving averages, but twice smoothed ones, which, on the one hand, makes it possible to more clearly determine the market movement, and on the other hand, makes the indicator less sensitive. Signals are not redrawn and can be used immediately after they appear. This means that there is no need to wait for a new confirming bar. The lower and upper bands are used as support / resista
The Direction Arrows indicator tracks the market trend while ignoring the sharp market fluctuations and noise around the average price. The indicator implements a kind of technical analysis based on the idea that the market is cyclical in nature. It catches the trend and shows favorable moments of entering the market with arrows. The indicator can be used both for pipsing on small periods and for long-term trading.
The Incognito RSI indicator is an advanced internal strength index. It transforms the signal so that the low-frequency components lag behind much more than the high-frequency components. In general, the data of the last bar has more weight than the previous data, like an exponential moving average. The indicator demonstrates not the relative strength of the compared trading instruments, but the internal strength of a single instrument, therefore it is the “Internal Strength Index”. This is an
The Oscillator Trend indicators are most useful in identifying trend decay. Nobody canceled the divergence. Correct use of this signal will give you a certain head start in the market. When working in flat. The principle of operation of the oscillator is based on the measurement of fluctuations. The indicator tries to determine the maximum or minimum of the next swing - an exit from the overbought and oversold zones. Do not forget that these signals are most interesting at the borders of the fl
Purpose Trend - analyzes the current trend gives an excellent understanding of which direction the market is aimed at, at what point it should be expected in the near future. Unfortunately, most of the popular indicators in practice give a huge number of false signals, since they all work without any consideration of global trends. That is why in today's conditions, when the market is far from stable price movement, it is almost impossible to build a strategy without using trend indicators. Ho
BitTerraCoin is a unique trading system! It goes through the entire history and all currency pairs with one single setting. Works using sharp tick movements. Recommendations for working with a scalpel: It is recommended to work on liquid Forex pairs with a low spread. The lower the commission and the spread, the greater the profit. You can start using it with $ 100 and 0.01 lot. You can work on any hourly period, on any currency pair and on the server of any broker. Details: The MaxSpread par
The Make Use trend indicator copes with the main task of trading: to find an entry point to the market at the moment of trend initiation and an exit point at the moment of its completion. A stable movement of quotations in a certain direction is called a trend in trading. In this case, the movement itself can be downward, upward or sideways, when the market movement does not have a pronounced direction. The Make Use trend indicator is important for identifying trends in financial markets. Howev
Trend Thyrogen is a trend trading strategy, filtering and all the necessary features built into one tool! Intelligent indicator algorithm with generates input signals and output levels. The principle of operation of the indicator is to automatically determine the current state of the market when placed on a chart, analyze historical data based on historical data and display instructions for further actions on the trader's screen. The system itself shows in the form of arrows when to buy and wh
The Channel Token indicator automatically builds a trend movement tracking channel. The price is in its trend movement in a certain range, and not a chaotic spread of the price, it is not clear in which direction. And if the price deviates within a certain range, it means that the boundaries of these ranges are support and resistance lines and form the Channel Token channel. Channel Token - an indicator in which the indicator period is automatically calculated based on the number of bars of t
The bot uses 4 MACD indicators and two MAs in its work, thus a zone is formed for trading on the breakdown of the Bands channel and, accordingly, with a minimum stop level and only one deal. The bot also takes into account parameters such as slippage, spread and volatility. Entry is made only when there is sufficient volatility. Thus, the bot works using sharp tick movements. It is recommended to work on liquid Forex pairs with a low spread. The lower the commission and the spread, the greater
The Trend Long indicator accompanies long trends. It can be used only to determine the global trend, but not as an entry point. Any reliable entry indicator can be used for the entry point. Or the standard RSI, based on overbought / oversold levels. The indicator can be used without restrictions on instruments or timeframes. Experiment with the parameters! The parameters are not linear! When you specify a period, you only specify a period to determine the price range for a certain interval. Th
This is no ordinary channel. Everyone should analyze it and find a way to use it in their trading strategies. Like all channels, it has a middle line as well as a high and low line. This channel is worth watching for its unusual behavior. The use of the Channel Reliable indicator allows the trader to react in time to the price going beyond the boundaries of the channel set for it. This corridor is built on the basis of the analysis of several candles, and changes in the parameter of the number
The principle of operation of the Patern Trend indicator is to work on a channel breakout. The parameters and width of the channel are selected in such a way that the closing in the red is sufficiently balanced, which is shown on the chart by the inscriptions near the arrows. You can see that the arrow signal does not appear every time the channel is broken. Because the indicator has a volatility filter that has a big impact on the entry. In total on the chart (EURUSD / H1) you can see that th
Signal Switched is a channel indicator designed to work with support and resistance levels and help traders find opportunities to enter the market. It is also protected by arrows that help to enter the market correctly. Channel indicators are among the most popular technical analysis tools on Forex and Signal Switched is a promising market analysis tool. Signal Switched can be used as a base for building a strategy or as an addition to an existing one. Signal Switched is a limited range (corr
フィルタ:
レビューなし
レビューに返信