Trinitys

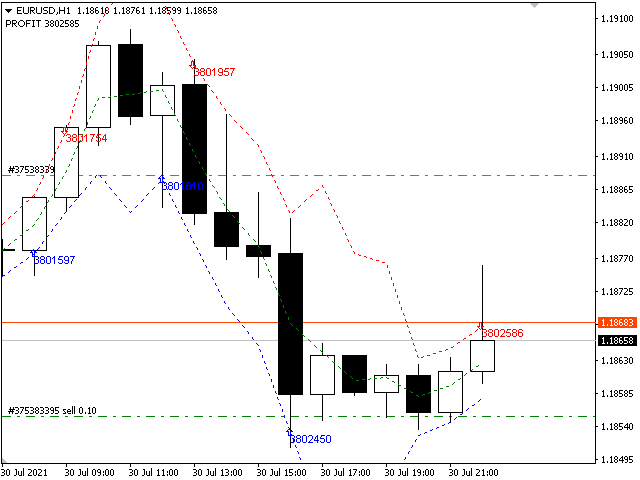
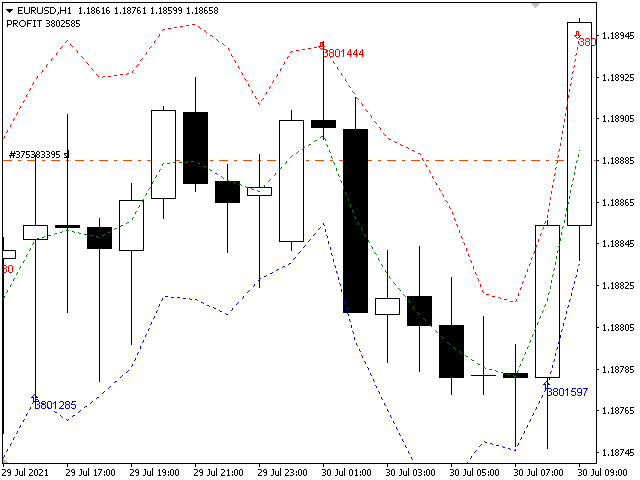
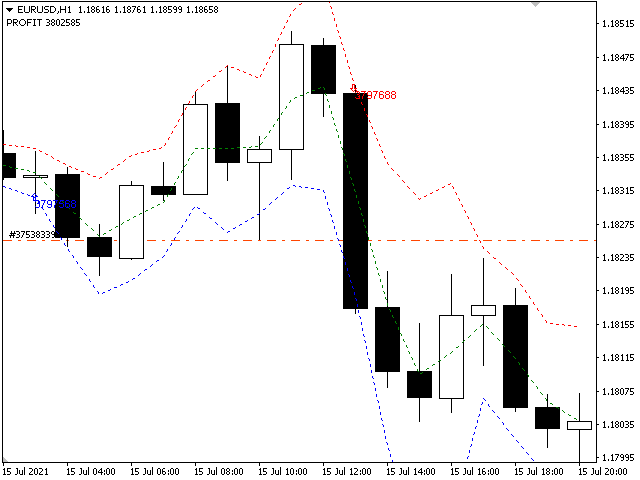
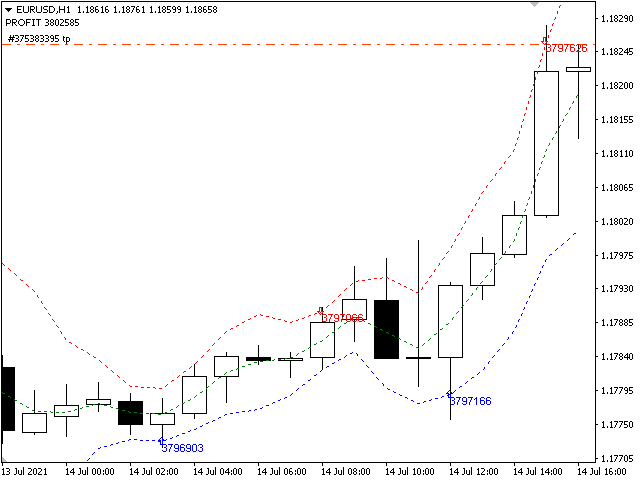
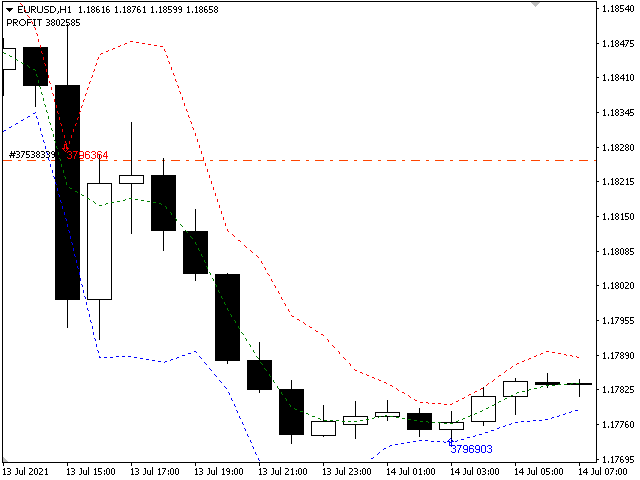
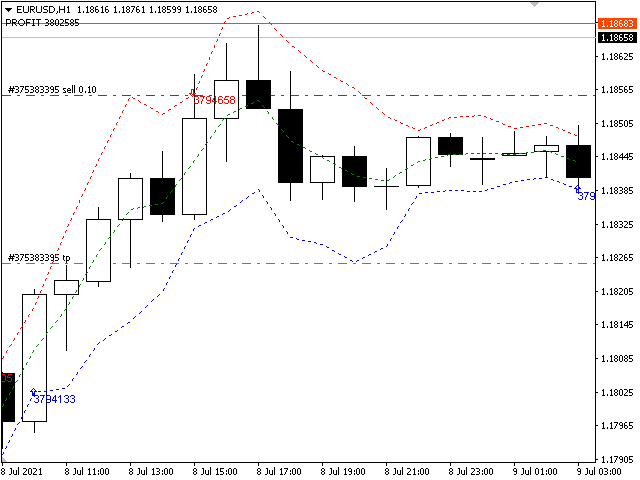
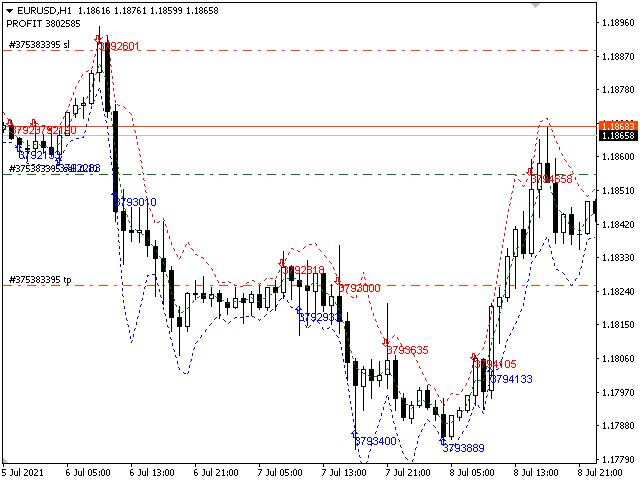
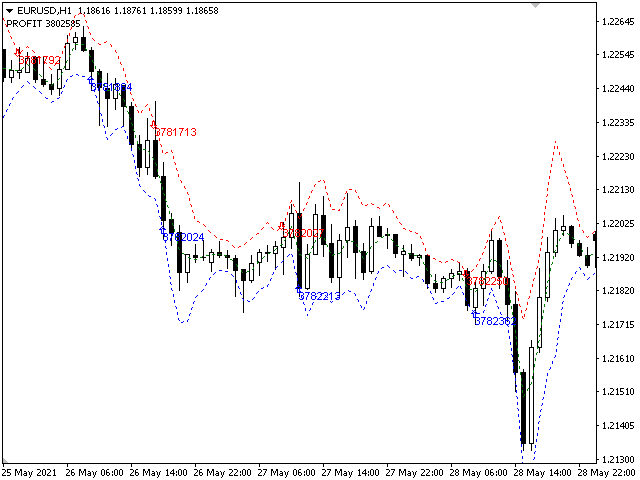
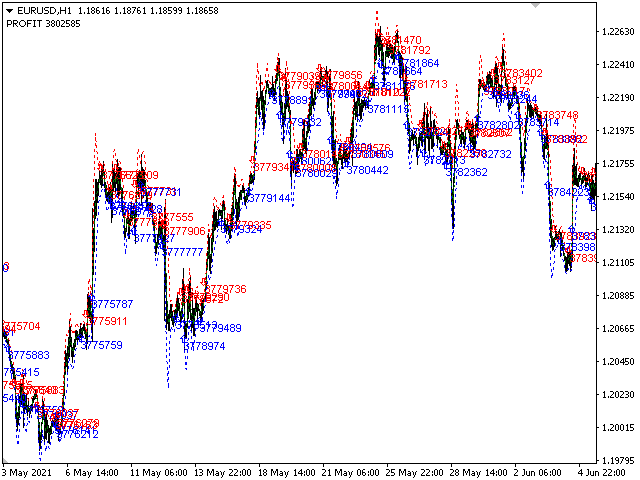
The Trinity indicator will tell you whether you have configured the indicator correctly, while you can specify the history interval in the bars that interests you. Look at the numbers on the chart near the arrows! These are pips of profit from a series of entries on the indicator. Profit pips are calculated at the specified interval. The signal can be read without any problems by any bot. Trading within the volatility range has always attracted traders, because most often it is simple instruments that turn out to be the most profitable. The Trinity indicator is a variant of building a price channel that gives signals of sufficiently high accuracy on any instruments and time periods. Bias or other additional parameters are not applied, that is, the indicator evaluates only the real dynamics.

The Trinity indicator is easy to use, it plots a real channel of two lines on the chart (red is the upper border, blue is the lower one), inside which, in fact, the price moves. The trading method is to pull back from the channel boundaries (when there is an arrow). Recommended entry points for long and short positions that appear in dynamics are indicated by arrows of the corresponding color and direction. Convenient, visual and accurate. Works on any time frame and on any instrument, including futures and stocks. The optimal timeframe, as for all trend indicators, is from H1 and above. By default the indicator is EURUSD and H1, the indicator needs to be configured for each period and symbol. The indicator near the arrows for entry displays profit pips from entries by the indicator. Spread losses can be set in the settings.
おすすめのプロダクト
「Auto FIBO Pro」Crypto_Forex インジケーターは、取引の補助ツールとして最適です。 - インジケーターは、フィボナッチ レベルとローカル トレンド ライン (赤色) を自動的に計算してチャート上に配置します。 - フィボナッチ レベルは、価格が反転する可能性のある重要な領域を示します。 - 最も重要なレベルは、23.6%、38.2%、50%、61.8% です。 - リバーサル スキャルピングやゾーン グリッド取引に使用できます。 - Auto FIBO Pro インジケーターを使用して、現在のシステムを改善する機会も多数あります。 - Info Spread Swap Display があり、接続されている外国為替ペアの現在のスプレッドとスワップを表示します。 - ディスプレイには、アカウントの残高、エクイティ、マージンも表示されます。 - Info Spread Swap Display は、チャートのどのコーナーにも配置できます。 0 - 左上コーナー、1 - 右上、2 - 左下、3 - 右下。 高品質のトレーディングロボットとインジケーターをご覧にな
Alpha Trend signは私たちの取引システムを検証し、取引信号を明確に提示し、信号がドリフトすることはありません。 主な機能: •市場が活況を示している地域に応じて、指標に基づいて現在の相場がトレンド相場に属しているか、それとも揺れ相場に属しているかを直感的に判断することができる。 そして、指標の指示矢印に基づいて市場に切り込み、緑の矢印は購入を提示し、赤の矢印は販売を提示する。 •小周期変動による頻繁な取引信号の発生を回避するために、5分以上の時間周期で取引を行うことを推奨します。 •最適な取引タイミングを逃さないために、シグナルプロンプトをオンにすることもできます。 •本指標はトレンド相場をよく予測するだけでなく、幅広振動相場でも利益を得ることができる。 •本指標は大道至簡の原則に基づいており、異なる段階のトレーダーが使用するのに適している。 注意事項: •Alpha Trend signには明確な入退場信号があり、損失を与えないように逆位相操作を提案しない。 •Alpha Trend signは特に成熟した指標であり、デルのチー
Owl smart levels
Sergey Ermolov
4.26 (38)
MT5版  |   FAQ Owl Smart Levels Indicator   は、 Bill Williams   の高度なフラクタル、市場の正しい波構造を構築する Valable ZigZag、エントリの正確なレベルをマークする Fibonacci レベルなどの一般的な市場分析ツールを含む 1 つのインジケーター内の完全な取引システムです。 利益を得るために市場と場所に。 戦略の詳細な説明 インジケータを操作するための指示 顧問-取引助手 プライベートユーザーチャット ->購入後に私に書いて、私はプライベートチャットにあなたを追加し、あなたはそこにすべてのボーナスをダウンロードすることができます 力はシンプルさにあります! Owl Smart Levels   取引システムは非常に使いやすいので、専門家にも、市場を勉強し始めて自分で取引戦略を選択し始めたばかりの人にも適しています。 戦略と指標に秘密の数式や計算方法が隠されているわけではなく、すべての戦略指標は公開されています。 Owl Smart Levels を使用すると、取引を開始するためのシグナルをすばやく確認し、注
Price Magnet — Price Density and Attraction Levels Indicator Price Magnet is a professional analytical tool designed to identify key support and resistance levels based on statistical Price Density. The indicator analyzes a specified historical period and detects price levels where the market spent the most time. These zones act as “magnets,” attracting price action or forming a structural base for potential reversals. Unlike traditional Volume Profile tools, Price Magnet focuses on price-time d
VR Cub
Vladimir Pastushak
VR Cub は、質の高いエントリーポイントを獲得するためのインジケーターです。このインジケーターは、数学的計算を容易にし、ポジションへのエントリーポイントの検索を簡素化するために開発されました。このインジケーターが作成されたトレーディング戦略は、長年にわたってその有効性が証明されてきました。取引戦略のシンプルさはその大きな利点であり、初心者のトレーダーでもうまく取引することができます。 VR Cub はポジション開始ポイントとテイクプロフィットとストップロスのターゲットレベルを計算し、効率と使いやすさを大幅に向上させます。取引の簡単なルールを理解するには、以下の戦略を使用した取引のスクリーンショットを見てください。 設定、設定ファイル、デモ版、説明書、問題解決方法は、以下から入手できます。 [ブログ] レビューを読んだり書いたりすることができます。 [リンク] のバージョン [MetaTrader 5] エントリーポイントの計算ルール ポジションをオープンする エントリーポイントを計算するには、VR Cub ツールを最後の高値から最後の安値までストレッチする必要があります。 最初
"The trend is your friend" is one of the best known sayings in investing, because capturing large trendy price movements can be extremely profitable. However, trading with the trend is often easier said than done, because many indicators are based on price reversals not trends. These aren't very effective at identifying trendy periods, or predicting whether trends will continue. We developed the Trendiness Index to help address this problem by indicating the strength and direction of price trend
Trend PA
Mikhail Nazarenko
5 (3)
The Trend PA indicator uses   Price Action   and its own filtering algorithm to determine the trend. This approach helps to accurately determine entry points and the current trend on any timeframe. The indicator uses its own algorithm for analyzing price changes and Price Action. Which gives you the advantage of recognizing, without delay, a new nascent trend with fewer false positives. Trend filtering conditions can be selected in the settings individually for your trading style. The indicator
The indicator shows the potential trend direction by cyclical-wave dependence. Thus, all the rays of the intersection will be optimal rays, in the direction of which the price is expected to move, taking into account the indicator period. Rays can be used as a direction for potential market movement. But we must not forget that the approach must be comprehensive, the indicator signals require additional information to enter the market.
This is a multi-timeframe version of the popular Hull Moving Average (HMA). The Double HMA MTF Light indicator combines two timeframes on a single chart. The HMA of the higher timeframe defines the trend, and the HMA of the current timeframe defines short-term price movements. The indicator is freely distributed and hasn't audio signals or messages. Its main function is the visualization of price movements. If you need advanced functionality of the HMA multi-timeframe indicator (information ab
FREE
The perfect tool for Scalng in the Forex markets You can trade both from signal to signal and using take profit  The algorithm does not use Zigzag!  No redrawing!  This is a channel instrument that uses a moving average as a filter. Moving Average  There are 2 parameters for the settings Ma Period = 5 period Moving Average  Channel 1.0 distance of channel lines from the chart Price Signal Filter - calculation of signal opening and filter There is a complete set of Alert There is a multi-timefram
これは、キャンドルの終値を予測する指標です。 このインジケータは、主にD1チャートでの使用を目的としていますが. この指標は、従来の外国為替取引とバイナリオプション取引の両方に適しています。 インジケーターは、スタンドアロンのトレーディングシステムとして使用することも、既存のトレーディングシステムへの追加として機能させることもできます。 このインジケーターは、現在のキャンドルを分析し、キャンドル自体の内部の特定の強度係数と、前のキャンドルのパラメーターを計算します。 したがって、この指標は、市場の動きのさらなる方向性と現在のキャンドルの終値を予測します。 この方法のおかげで、この指標は、短期の日中取引だけでなく、中期および長期の取引にも適しています。 インジケーターを使用すると、市場の状況の分析中にインジケーターが生成する潜在的な信号の数を設定できます。 インジケーターの設定には、このための特別なパラメーターがあります。 また、インジケーターは、チャート上のメッセージの形式で、電子メールで、およびPUSH通知の形式で、新しい信号について通知することができます。 購入後は必ず私に書いて
Super Reversal Pattern Indicator Unlock the power of advanced pattern recognition with our Super Reversal Pattern Indicator. Designed for traders seeking precision and reliability, this indicator identifies one of the most effective reversal patterns in technical analysis, offering a significant edge in your trading strategy. Key Features: Non-Repainting Accuracy: Enjoy the confidence of non-repainting technology. Once a Super Reversal Pattern is detected, it remains static, providing consiste
This is a trend indicator without redrawing Developed instead of the binary options strategy (by the color of the Martingale candlestick) Also works well in forex trading When to open trades (binary options) A signal will appear in the place with a candle signaling the current candle It is recommended to open a deal for one candle of the current timeframe M1 and M5 When a blue dot appears, open a deal up When a red dot appears, open a trade down. How to open trades on Forex. When a signal is rec
これはほぼ間違いなく、MetaTraderプラットフォームで見つけることができる最も完全な調和価格形成自動認識インジケーターです。 19種類のパターンを検出し、フィボナッチプロジェクションをあなたと同じように真剣に受け止め、潜在的逆転ゾーン(PRZ)を表示し、適切なストップロスとテイクプロフィットレベルを見つけます。 [ インストールガイド | 更新ガイド | トラブルシューティング | よくある質問 | すべての製品 ] 19の異なる調和価格形成を検出します プライマリ、派生および補完フィボナッチ投影(PRZ)をプロットします 過去の価格行動を評価し、過去のすべてのパターンを表示します この指標は、独自の品質とパフォーマンスを分析します 適切なストップロスとテイクプロフィットのレベルを表示します ブレイクアウトを使用して適切な取引を通知します すべてのパターン比をグラフにプロットします 電子メール/音声/視覚アラートを実装します スコット・M・カーニーの本に着想を得て、この指標は最も純粋で急を要するトレーダーのニーズを満たすように設計されています。ただし、トレードを容易にする
Trend Scanner
Vladimir Kalendzhyan
4.33 (6)
By purchasing this indicator, you have the right to receive a free copy of one of   my other indicator's or advisor’s!  (All future updates are included. No limits) . To get it , please contact me by  mql5 message ! The Trend Scanner trend line indicator displays the trend direction and its changes. The indicator works on all currency pairs and  timeframes. The indicator simultaneously displays multiple readings on the price chart: the support and resistance lines of the currency pair, the exist
This is a new strategy for SUPPLY DEMAND areas It is based on a calculation using the tick volume to detect the big price action in market for both bear /bull actions this smart volume action candles are used to determine the supply and demand areas prices in between main supply and demand lines indicate sideway market  up arrows will be shown when prices moves above the main supply and the secondary supply lines Down arrows will be shown when prices moves below the main demand and the secondary
Koala Supply Demand
Ashkan Hazegh Nikrou
5 (3)
MetaTrader 4 の Koala Supply Demand Indicator をご紹介します (他のトレーダーがあなたの経験から恩恵を受けられるように、肯定的なものでも否定的なものでも、レビューやフィードバックを共有することをお勧めします)。 Koala Supply Demandインジケーターへようこそ。このインジケーターは連続したサプライとデマンドゾーンを特定するために設計されています。このインジケーターはトレーダーが市場をゾーンエリアとして表示できるようにし、いくつかの強力なゾーンがどのように価格を尊重しているかを見るのに役立ちます。このインジケーターはまた、ゾーン内で形成されたときに価格アクションのシグナルを表示することもできます。 Koala Trading Solutionチャンネル で最新のKoala製品に関する最新情報を入手するために、mql5コミュニティに参加してください。参加リンクは以下です: https://www.mql5.com/en/channels/koalatradingsolution https://www.mql5.com/en/bl
FREE
このインジケーターは アグレッシブなスキャルピング と バイナリーオプションの速いエントリー のために設計されており、 毎バー でシグナルを生成し、常に何が起こっているかを正確に把握できます。 Happy Scalpingチャンネルに参加する: MQL5 再描画しません :現在のバーのシグナルは リアルタイム で生成されるため、まだバーが形成されている間に、前のバーの終値に対して価格が上がるか下がるかによってシグナルが変わる可能性があります。 しかし、バーが 閉じる と、シグナルの色は 完全に固定されます 。変更されず、消えず、動かず、 見るものがそのまま残ります。 なぜこのように設計されたのか? 多くのスキャルパーは、特に価格が ブレイクアウトや急激な動き をする際に、すぐにシグナルを受け取ることを重視しています。そのため、その瞬間に迅速に取引を行い、すぐにピップを獲得することができます。 一方で、バーが閉じた後の 確認を待つ ことを好むトレーダーもおり、その場合でもこのインジケーターを問題なく使用できます。 どちらのアプローチも有効です 。このシステムはどちらのスタイルにも
標準パラメーターを使用したMACDインジケーター波に基づく 最後と最後の2つのMACDウェーブで、それぞれ正と負のフィボナッチレベルを扱います。 現時点でMACDインジケーターで負の波が終了している場合、色は緑です。 現時点でMACDインジケーターの正の波が終了している場合、色は赤です。 Waveの終了基準は、MACDの符号が異なる2ティックです。 最後の4つのMACDウェーブのトレンドラインをプロットします。 専門家とうまく働く  その他のスクリーンショット: Figures MACD   https://www.mql5.com/ru/market/product/42031 https://www.mql5.com/en/charts/10581596/audusd-h1-alpari-international https://www.mql5.com/en/charts/10631979/usdjpy-m1-alpari-international https://www.mql5.com/en/charts/10628704/gbpusd-m15-alpa
SMC Venom Model BPR インジケーターは、スマート マネー (SMC) コンセプトで取引するトレーダー向けのプロフェッショナル ツールです。価格チャート上の 2 つの主要なパターンを自動的に識別します。 FVG   (フェアバリューギャップ) は、3 本のローソク足の組み合わせで、最初のローソク足と 3 番目のローソク足の間にギャップがあります。ボリュームサポートのないレベル間のゾーンを形成し、価格修正につながることがよくあります。 BPR   (バランス価格範囲) は、2 つの FVG パターンの組み合わせで、「ブリッジ」を形成します。これは、価格がボリュームアクティビティの少ない動きで動くときに、ブレイクアウトしてレベルに戻るゾーンで、ローソク足の間にギャップを作成します。 これらのパターンは、大規模な市場プレーヤーと一般参加者の相互作用が発生するチャート上のボリュームと価格動向の分析に基づいて、トレーダーが主要なサポート/レジスタンス レベル、ブレイクアウト ゾーン、エントリ ポイントを識別するのに役立ちます。 インジケーターは、長方形と矢印の形でパターンを視
QuantumEdge Trader v1.0 AI-Powered Precision Signals for Serious Traders QuantumEdge Trader is a smart and reliable indicator that delivers accurate BUY and SELL signals using advanced market analysis and trend detection. Designed for M1 to M60 timeframes, it's ideal for scalping and intraday strategies. --- Key Features: No Repaint – Signals never change after appearing Smart trend filters to reduce noise Adjustable sensitivity and alerts Perfect for XAUUSD, EURUSD, and m
Crypto_Forex MT4 用インジケーター「モーニング スター パターン」 - インジケーター「モーニング スター パターン」は、プライス アクション トレーディングに非常に強力なインジケーターです。再描画なし、遅延なし。 - インジケーターは、チャート上で強気のモーニング スター パターンを検出します。チャート上の青い矢印信号 (画像を参照)。 - PC、モバイル、および電子メール アラート付き。 - また、その兄弟である弱気の「イブニング スター パターン」インジケーターも利用できます (以下のリンクに従ってください)。 - インジケーター「モーニング スター パターン」は、サポート/レジスタンス レベルと組み合わせるのに最適です。 高品質のトレーディングロボットとインジケーターをご覧になるにはここをクリックしてください! これは、この MQL5 Web サイトでのみ提供されるオリジナル製品です。
Noize Absorption Index - is the manual trading system that measures the difference of pressure between bears forces and bulls forces. Green line - is a noize free index that showing curent situation. Zero value of index shows totally choppy/flat market.Values above zero level shows how powerfull bullish wave is and values below zero measures bearish forces.Up arrow appears on bearish market when it's ready to reverse, dn arrow appears on weak bullish market, as a result of reverse expectation. S
Indicator Description GOLD TITAN KING SIGNAL INDICATOR High-Precision Gold Scalping Buy/Sell Signals – Manual Trading Assistant Overview The Gold Titan King Signal Indicator is a manual trading assistant tool designed for high-frequency scalping on Gold (XAUUSD) and other major pairs. It generates clear BUY/SELL signals with precise entry levels, along with adjustable Stop Loss and Take Profit levels displayed directly on the chart. ️ This tool is NOT an EA. It does not execute trades
The indicator detects and displays 3 Drives harmonic pattern (see the screenshot). The pattern is plotted by the extreme values of the ZigZag indicator (included in the resources, no need to install). After detecting the pattern, the indicator notifies of that by a pop-up window, a mobile notification and an email. The indicator highlights the process of the pattern formation and not just the complete pattern. In the former case, it is displayed in the contour triangles. After the pattern is com
EARLY REMINDER: The Starting price is 65 price will rise soon up to 365$ and then 750$ after first 10 copies of sales. Grab this offer now! Introduction Hello, traders! Welcome to the demonstration of the Forex Beast Indicator , a comprehensive tool designed to assist aspiring traders in navigating the complexities of the forex market. This indicator incorporates seven essential components to provide a well-rounded trading experience: Moving Averages Colored Zones Support and Resistance Levels
Crypto_Forex MT4用インジケーター「 RSI SPEED 」は、優れた予測ツールで、リペイント機能はありません。 - このインジケーターの計算は物理学の方程式に基づいています。RSI SPEEDはRSI自体の1次導関数です。 - RSI SPEEDは、主要トレンドの方向にスキャルピングエントリーするのに適しています。 - 適切なトレンドインジケーター(例えばHTF MA(画像参照)など)と組み合わせて使用​​してください。 - RSI SPEEDインジケーターは、R​​SI自体がどれだけ速く方向転換するかを示します。非常に敏感です。 - モメンタムトレード戦略にはRSI SPEEDインジケーターの使用をお勧めします。RSI SPEEDインジケーターの値が0未満の場合は価格モメンタムが下降し、RSI SPEEDインジケーターの値が0を超える場合は価格モメンタムが上昇します。 - インジケーターにはモバイルとPCのアラートが組み込まれています。 高品質のトレーディングロボットとインジケーターをご覧になるにはここをクリックしてください! これは、このMQL5ウェブサイトで
1.需給は取引に使用されるコア戦略の1つである。それは古代の需給法則と自由流動市場における価格の動きに注目している。この戦略の基本は、利用可能なツールの数と購入者のツールに対するニーズが価格を決定することです。グラフには、需要が供給(需要領域)を圧倒し、価格上昇を推進する領域または供給が需要(供給領域)を圧倒し、価格下落を推進する領域が示されています。多くの需給トレーダーは、多頭または空頭頭頭頭頭頭頭寸に入る前に、これらの主要な売買活動が発生した地域に価格が入るのを待っている。 2.需要領域で購入し、供給領域で販売することは意味がありますが、再テストされた領域よりも新鮮な領域の方が効果的であることを覚えておいてください。これらは、継続的な傾向の進入領域として使用することも、変化傾向の逆転領域として使用することもできます。大胆に取引を行うことも、保守的に行うこともでき、取引ごとに独自の参入や脱退ルールがある。これらの規則に従ってグラフを作成するツールにより、ユーザーはグラフ上でこれらのレベルを直感的に認識することができます。 3.グラフのK線が黄色になると、価格は突破しようとしている。
FREE
This is an arrow indicator without a future function,developed based on the most advanced profit trading algorithms.It has the most innovative and advanced dual trend analysis module, as well as the latest and highly effective market trend prediction algorithm.Trends are your friends, and following larger trends can earn the maximum profit in foreign exchange. This indicator helps traders identify current trends and track them. Someone once made a profit of 10 times in a week by relying on it.No
「調整可能なフラクタル」はフラクタル インジケーターの高度なバージョンで、非常に便利なトレーディング ツールです。 - ご存知のとおり、標準フラクタル mt4 インジケーターには設定がまったくありません。これはトレーダーにとって非常に不便です。 - 調整可能なフラクタルは、この問題を解決しました。必要な設定がすべて揃っています。 - インジケーターの調整可能な期間 (推奨値 - 7 以上)。 - 価格の高値/安値からの距離を調整可能。 - フラクタル矢印のデザインを調整可能。 - インジケーターにはモバイルおよび PC アラートが組み込まれています。 高品質のトレーディングロボットとインジケーターをご覧になるにはここをクリックしてください! これは、この MQL5 Web サイトでのみ提供されるオリジナル製品です。
このプロダクトを購入した人は以下も購入しています
GOLD Impulse with Alert
Bernhard Schweigert
4.64 (11)
このインディケータは、当社の2つの製品 Advanced Currency IMPULSE with ALERT  +   Currency Strength Exotics . のスーパーコンビネーションです。 このインジケーターは全ての時間枠で作動し、8つの主要通貨と1つのシンボルの強弱のインパルスをグラフで表示します。 このインジケータは、金、エキゾチックペア、商品、インデックス、先物など、あらゆるシンボルの通貨強度の加速度を表示することに特化されています。金、銀、原油、DAX、US30、MXN、TRY、CNHなどの通貨強度の加速度(インパルスまたは速度)を表示するために、任意のシンボルを9行目に追加できる、この種の最初のものです。 新しいアルゴリズムに基づいて構築され、潜在的な取引の特定と確認がさらに容易になりました。これは、通貨の強さや弱さが加速しているかどうかをグラフィカルに表示し、その加速の速度を測定するためです。加速すると物事は明らかに速く進みますが、これはFX市場でも同じです。つまり、反対方向に加速している通貨をペアリングすれば、潜在的に利益を生む取引を特定
Miraculous Indicator – ガン・スクエア・オブ・ナインに基づく100%非リペイントのFXおよびバイナリーツール この動画では、FXおよびバイナリーオプションのトレーダー向けに特別に開発された、非常に正確で強力な取引ツールである Miraculous Indicator を紹介しています。このインジケーターがユニークなのは、伝説的な ガン・スクエア・オブ・ナイン と ガンの振動の法則 に基づいている点で、現代の取引で利用できる最も正確な予測ツールの一つとなっています。 Miraculous Indicatorは 完全に非リペイント であり、ローソク足が確定した後にシグナルが変化したり消えたりすることはありません。つまり、見たものがそのまま利用できます。これにより、トレーダーは自信を持ってエントリーおよびエグジットを行うための信頼性と一貫性のある根拠を得ることができます。 主な特徴: ガン・スクエア・オブ・ナインとガン理論に基づいて構築 100%非リペイントのシグナルシステム すべての時間枠(M1、M5、H1、H4、日足、週足)で機能 FXおよびバイナリーオプション取引
Dynamic Forex28 Navigator - 次世代の Forex 取引ツール。 現在 49% オフ。 Dynamic Forex28 Navigator は、長年人気のインジケーターを進化させたもので、3 つの機能を 1 つにまとめています。 Advanced Currency Strength28 インジケーター (レビュー 695 件)  + Advanced Currency IMPULSE with ALERT (レビュー 520 件) + CS28 コンボ シグナル (ボーナス)。 インジケーターの詳細 https://www.mql5.com/en/blogs/post/758844 次世代の Strength インジケーターが提供するもの  オリジナルで気に入っていたすべての機能が、新機能と精度の向上によって強化されました。 主な機能: 独自の通貨強度計算式。 すべての時間枠でスムーズかつ正確な強度ライン。 トレンドの特定と正確なエントリーに最適です。 ダイナミックマーケットフィボナッチレベル (マーケットフィボナッチ)。 このインジケーターに固有
Precautions for subscribing to indicator This indicator only supports the computer version of MT4 Does not support MT5, mobile phones, tablets The indicator only shows the day's entry arrow The previous history arrow will not be displayed (Live broadcast is for demonstration) The indicator is a trading aid Is not a EA automatic trading No copy trading function The indicator only indicates the entry position No exit (target profit)  The entry stop loss point is set at 30-50 PIPS Or the front hi
現在40%OFF! 初心者やエキスパートトレーダーのためのベストソリューション! このダッシュボードソフトウェアは、28の通貨ペアで動作しています。それは私達の主要な指標(高度な通貨の強さ28と高度な通貨インパルス)の2に基づいています。それは全体の外国為替市場の大きい概観を与えます。それは、すべての(9)時間枠で28の外国為替ペアのための高度な通貨の強さの値、通貨の動きの速度と信号を示しています。チャート上で1つのインディケータを使用して市場全体を観察し、トレンドやスキャルピングの機会をピンポイントで見つけることができたら、あなたのトレードがどのように改善されるか想像してみてください。 このインディケータには、強い通貨と弱い通貨の識別、潜在的な取引の識別と確認がより簡単になるような機能が搭載されています。このインディケータは、通貨の強さや弱さが増加しているか減少しているか、また、すべての時間枠でどのように機能しているかをグラフィカルに表示します。 新機能として、現在の市場環境の変化に適応するダイナミックなマーケットフィボナッチレベルが追加され、すでに当社のAdvanced
Looking for a powerful yet lightweight swing detector that accurately identifies market structure turning points? Want clear, reliable buy and sell signals that work across any timeframe and any instrument? Buy Sell Arrow MT Swing is built exactly for that — precision swing detection made simple and effective. This indicator identifies Higher Highs (HH) , Higher Lows (HL) , Lower Highs (LH) , and Lower Lows (LL) with remarkable clarity. It is designed to help traders easily visualize market stru
Presenting one-of-a-kind Gann Indicator for XAUUSD IQ Gold Gann Levels is a non-repainting, precision tool designed exclusively for XAUUSD/Gold intraday trading. It uses W.D. Gann’s square root method to plot real-time support and resistance levels, helping traders spot high-probability entries with confidence and clarity. William Delbert Gann (W.D. Gann) was an exceptional market analyst whose trading technique was based on a complex blend of mathematics, geometry, astrology, and ancient calcul
El indicador "MR BEAST ALERTAS DE LIQUIDEZ" es una herramienta avanzada diseñada para proporcionar señales y alertas sobre la liquidez del mercado basándose en una serie de indicadores técnicos y análisis de tendencias. Ideal para traders que buscan oportunidades de trading en función de la dinámica de precios y los niveles de volatilidad, este indicador ofrece una visualización clara y detallada en la ventana del gráfico de MetaTrader. Características Principales: Canal ATR Adaptativo: Calcula
IQ FX Gann Levels a precision trading indicator based on W.D. Gann’s square root methods . It plots real-time, non-repainting support and resistance levels to help traders confidently spot intraday and scalping opportunities with high accuracy. William Delbert Gann (W.D. Gann) was an exceptional market analyst, whose trading technique was based on a complex blend of mathematics, geometry, astrology, and ancient mathematics which proved to be extremely accurate. Setup & Guide:  Download  MT5 Ver
Step into the world of Forex trading with confidence, clarity, and precision using   Gold Indicator   a next-generation tool engineered to take your trading performance to the next level. Whether you’re a seasoned professional or just beginning your journey in the currency markets, Gold Indicator equips you with powerful insights and help you trade smarter, not harder. Built on the proven synergy of three advanced indicators, Gold Indicator focuses exclusively on medium and long-term trends eli
Meravith
Ivan Stefanov
5 (3)
マーケットメーカーのためのツール。 Meravith は次の機能を提供します: すべての時間足を分析し、現在有効なトレンドを表示します。 強気と弱気の出来高が等しくなる流動性ゾーン(出来高均衡)を強調表示します。 異なる時間足のすべての流動性レベルをチャート上に直接表示します。 テキスト形式の市場分析を生成し、参考情報として表示します。 現在のトレンドに基づいて目標値、サポートレベル、ストップロスを計算します。 取引のリスクリワード比を算出します。 口座残高に基づいてポジションサイズを計算し、潜在的な利益を推定します。 また、市場に大きな変化があった場合には警告を表示します。 インジケーターの主要ライン: 強気/弱気の出来高エグゾーストライン ― 目標値として機能します。 市場のトレンドを示すライン。市場が強気か弱気かによって色が変わり、トレンドのサポートとして機能します。主にその色が市場センチメントを示します。 出来高均衡ライン(Eq)。Eq(Volume Equilibrium)ラインはシステムの中核です。これは買い手と売り手の出来高のバランスポイントを表します。市場の流動性を示し
No Repaint Bext は完全な取引システムです。エントリーとエグジットのタイミング、そして取引の方向を示します。 緑の矢印 が表示されるたびに、 買い注文 を開きます。 赤い矢印 が表示されたら、すべての買い注文を閉じます。 同様に、 赤い矢印 が表示されたら、 売り注文 を開き、 緑の矢印 が表示されたらすべての売り注文を閉じます。 取引には M5(1分足) を使用し、 どの通貨ペアでも取引可能 です。 このインジケーターは 再描画されず 、ほとんど遅延しません。ただし、 ローソク足が確定するまで待つ という自然な条件はあります。 RSI フィルター と**2 つのクラシックな反転パターン(エンゴルフィング、ピンバー)**を使用し、反転の瞬間をほぼリアルタイムで捉えます。 インジケーターの効果的な使い方 どの通貨ペアでも使用可能 (テスト済み: GBPUSD, EURUSD ) 時間足:M5(1分足) 初期資金:500ドル以上 取引ロット:0.01 緑の矢印 が表示されたら、買い注文を開く。 赤い矢印 が表示されたら、すべての買い注文を閉じる。 赤い矢印 が表示されたら、売
「 Dynamic Scalper System 」インジケーターは、トレンド波の中でスキャルピング取引を行う手法のために設計されています。 主要通貨ペアと金でテスト済みで、他の取引商品との互換性があります。 トレンドに沿った短期的なポジションオープンのシグナルを提供し、追加の価格変動サポートも提供します。 インジケーターの原理 大きな矢印はトレンドの方向を決定します。 トレンド波の中では、小さな矢印の形でスキャルピングシグナルを生成するアルゴリズムが機能します。 赤い矢印は強気方向、青い矢印は弱気方向です。 トレンドの方向には敏感な価格変動ラインが描かれ、小さな矢印のシグナルと連動します。 シグナルは次のように機能します。適切なタイミングでラインが現れるとエントリーシグナルが形成され、ラインが開いている間はポジションが保持され、完了すると取引が終了します。 推奨される動作時間枠はM1~H4です。 矢印は現在のローソク足に形成され、次のローソク足が開いている場合は、前のローソク足の矢印は再描画されません。 入力パラメータ Trend Wave Period - トレンド方向
Are you looking for a simple and reliable indicator that can help you spot market swing points easily? Do you want clear buy and sell signals that work on any timeframe and any trading instrument? Buy Sell Signal Pro is designed to do exactly that. It helps traders identify important market turning points and understand the current market structure in a clear and easy way. This indicator detects Higher Highs (HH), Higher Lows (HL), Lower Highs (LH), and Lower Lows (LL) so you can quickly see wh
Super Signal – Skyblade Edition プロ仕様のノンリペイント / ノーラグ・トレンドシグナルシステム。卓越した勝率を実現 | MT4 / MT5 対応 1分足、5分足、15分足などの低い時間足で最も効果を発揮します。 主な特徴: Super Signal – Skyblade Edition は、トレンド取引に特化したスマートなシグナルシステムです。マルチレイヤーのフィルターロジックを用いて、明確な方向性と実際のモメンタムに支えられた強力なトレンドのみを検出します。 このシステムは 天井や底を予測するものではありません 。次の3つの条件がすべて満たされた場合にのみシグナルを発生させます: 明確なトレンド方向 モメンタムの増加 健全なボラティリティ構造 市場セッションに基づく流動性分析と組み合わせることで、シグナルの精度とタイミングがさらに向上します。 シグナルの特性: すべての矢印シグナルは 100% 非リペイント / 遅延なし 一度出現したシグナルは固定され、点滅・消失しません チャート上の矢印、情報パネル、ポップアップ通知、音声アラート、プッシュ通知
GM Arrows Pro
Guillaume Pierre Philippe Mesplont
Product Name: GM Arrows Pro – Signals & Alerts Short Description: GM Arrows Pro is a clean, reliable MT4 indicator showing BUY/SELL arrows on the chart with unique alerts at the moment the signal appears. Full Description: GM Arrows Pro is a professional MT4 indicator designed for traders who want clear, actionable signals: BUY and SELL arrows visible on the entire chart history Unique alerts when a new signal appears (no repeated alerts) Option to disable repetitive signals ( disable_repeatin
ゴールドラッシュ・トレンド・アロー・シグナル ゴールドラッシュ・トレンド・アロー・シグナル 指標は、XAU/USDにおける高速・短期スキャルパー向けに最適化された、正確でリアルタイムのトレンド分析を提供します。 1分足専用に設計されたこのツールは、明確なエントリーポイントを示す方向矢印を表示し、スキャルパーが変動の激しい市場状況でも自信を持って取引できるよう支援します。 この指標は、PRIMARY(主要)とSECONDARY(補助)のアラート矢印で構成されています。PRIMARYシグナルは、トレンドの方向転換を示す白と黒の方向矢印であり、SECONDARYシグナルは、PRIMARY矢印が示す方向を確認し、潜在的なエントリーポイントを示す青と赤の矢印です。 注意:トレンド方向の変化後にPRIMARYアラート矢印が1つだけ表示される場合、複数のSECONDARY青/赤矢印が表示される点に注意が必要です。SECONDARYシグナルは、シグナル基準を満たす任意のローソク足後に表示されます。したがって、長期的なトレンド移動の場合、画面に多くのSECONDARY矢印が表示されます(添付の
PairMaster Buy Sell Arrow Indicator for MT4 Trade Reversals Like a Pro — Catch Every Swing Point with Precision The PairMaster Buy Sell Arrow Indicator is a powerful MetaTrader 4 tool built to identify high-probability swing trading opportunities . Designed for traders who value accuracy, clarity, and simplicity, PairMaster detects key market turning points and plots intuitive buy and sell arrows directly on your chart. Key Features Accurate Swing Point Detection – Automatically identifies ma
チャートを構成し、周期的な価格変動を識別するテクニカル指標。 どのチャートでも動作します。 いくつかの種類の通知。 グラフ自体に追加の矢印があります。 履歴を再描画せずに、キャンドルのクローズに取り組みます。 M5以上のTFを推奨します。 パラメータの使用と設定が簡単です。 異なるパラメータを持つ 2 つのインジケーターを使用する場合、他のインジケーターなしで使用できます。 入力パラメータは2つあります 周期性と信号持続時間 これら 2 つのパラメータは、チャート構造の処理を扱います。 Cyclicity - 反転サイクルが変化する頻度を調整し、サイクルを滑らかにします。 Signal duration - 最小数では価格変動の衝動を検出し、最大数では長期的なトレンドの動きを検出します。
Product Name:   Quantum Regime Indicator Short Description:   A multi-engine structural regime and volatility filter. Description: Quantum Regime Indicator (QRI) is a sophisticated technical analysis algorithm designed to identify market structure shifts and volatility regimes. Unlike standard indicators that rely on immediate price action, QRI utilizes a hierarchical logic architecture to filter market noise and identify statistical extremes. The indicator is built on the philosophy of "Market
"Dragon's Tail" is an integrated trading system, not just an indicator. This system analyzes each candle on a minute-by-minute basis, which is particularly effective in high market volatility conditions. The "Dragon's Tail" system identifies key market moments referred to as "bull and bear battles". Based on these "battles", the system gives trade direction recommendations. In the case of an arrow appearing on the chart, this signals the possibility of opening two trades in the indicated directi
Rtc ML Ai | Predictor CORE MACHINE LEARNING ENGINE Adaptive ML Market Predictor – Multi-Bar Trend & Candle Forecast What This Indicator Does This indicator is a  real-time market prediction engine  designed to analyze price behavior and estimate  future market tendencies . Unlike conventional indicators, this system  does not rely on static parameters or historical curve-fitting , but adapts its internal state dynamically during live market operation. Instead of using static rules, the indic
ECM Elite Channel is a volatility-based indicator, developed with a specific time algorithm, which consists of finding possible corrections in the market. This indicator shows two outer lines, an inner line (retracement line) and an arrow sign, where the channel theory is to help identify overbought and oversold conditions in the market. The market price will generally fall between the boundaries of the channel. If prices touch or move outside the channel, it's a trading opportunity. The ind
KT Trend Trading Suite は、トレンドフォロー戦略と複数のブレイクアウトポイントを組み合わせた多機能インジケーターです。 新たなトレンドが形成されると、このインジケーターは複数のエントリーチャンスを提供し、トレンドにうまく乗ることが可能になります。あまり重要でないエントリーポイントを避けるために、プルバックの閾値が使用されます。 MT5 バージョンはこちらで入手可能です  https://www.mql5.com/en/market/product/46270 機能 市場のさまざまなダイナミクスを1つの方程式にまとめ、トレンドの全体像を明確に描写します。 エントリーシグナルに基づいて、局所的な高値と安値を視覚的に示す長方形を描画します。 シグナルの精度を自動的に測定し、パフォーマンス指標をシンプルに表示します。 複数時間足対応のダッシュボードを搭載し、すべての時間軸をスキャンして、それぞれのトレンド方向を表示します。 入力パラメータ History Bars:   過去のシグナル分析に使用する履歴バーの数。  Signals Period:   エントリ
The Super Arrow Indicator provides non-repainting buy and sell signals with exceptional accuracy. Key Features No repainting – confirmed signals remain fixed Clear visual arrows: green for buy, red for sell Real-time alerts via pop-up, sound, and optional email Clean chart view with no unnecessary clutter Works on all markets: Forex, gold, oil, indices, crypto Adjustable Parameters TimeFrame Default: "current time frame" Function: Sets the time frame for indicator calculation Options: Can be set
現在40%OFF! このダッシュボードは、複数のシンボルと最大9つのタイムフレームで動作するソフトウェアの非常に強力な部分です。 このソフトは、弊社のメインインジケーター(ベストレビュー:Advanced Supply Demand)をベースにしています。    Advanced Supply Demand ダッシュボードは、素晴らしい概要を提供します。それは示しています。  ゾーン強度評価を含むフィルタリングされた需給値。 ゾーン内/ゾーンへのPips距離。 ネストされたゾーンがハイライトされます。 選択されたシンボルの4種類のアラートを全ての(9)時間枠で提供します。 それはあなたの個人的なニーズに合わせて高度に設定可能です。 あなたの利益! すべてのトレーダーにとって最も重要な質問です。 市場に参入するのに最適なレベルはどこか? 成功のチャンスとリスク/リターンを得るために、強力な供給/需要ゾーン内またはその近くで取引を開始します。 損切りの最適な位置はどこですか? 最も安全なのは、強力な供給/需要ゾーンの下/上にストップを置くことです。 最適な利益
Introducing a powerful, precision-engineered indicator that seamlessly combines Pivot Points, Moving Averages, and Multi-Timeframe Analysis to deliver high-probability Buy and Sell signals in real-time. This tool is your strategic edge, designed to identify trend reversals, market momentum, and optimal trade entries, no matter your preferred trading style. Our algorithm goes beyond standard indicators—by analyzing multiple timeframes simultaneously, it spots true market turning points while fi
This indicator depends on some secrets equations to draw Signals with Stop loss and maximum 4 Take profits. There is a free EA depends on this indicator as a gift when you purchase/rent it. Features Simply it gives you entry point as Ready sign (Buy / Sell) and arrow (Buy / Sell) after candle closed, also SL line and 4 TP lines or less. Once SL-TP lines are shown with the arrow, they remains as they are until signal change. It is historical indicator. No Repaint. user manual for V5 please click
Weis Wave with Alert
Trade The Volume Waves Single Member P.C.
4.82 (22)
Rental/Lifetime Package Options and Privileges' Rent Monthly Six Months   Yearly/Lifetime Weis Wave with Speed with Alert+Speed Index x x x Manual  x x x Quick Set up Video x x x Blog x x x Lifetime Updates x x x Setup and Training Material x x Rectangle Break Alert Tool      x Discord Access Channel "The SI traders" x   How to trade info visit:    http://www.tradethevolumewaves.com   ** If you purchase please contact me to setup your  : training Room and  complete manual access.  This is
収益性の高い取引機会を簡単に特定するのに役立つ強力な外国為替取引インジケーターをお探しですか?ビースト スーパー シグナル以外に探す必要はありません。 この使いやすいトレンドベースのインジケーターは、市場の状況を継続的に監視し、新しいトレンドを検索したり、既存のトレンドに飛びついたりします。ビースト スーパー シグナルは、すべての内部戦略が一致し、互いに 100% 合流したときに売買シグナルを発するため、追加の確認は不要です。シグナル矢印アラートを受け取ったら、単に売買します。 購入後、プライベート VIP グループに追加されるようにメッセージを送ってください! (完全な製品購入のみ)。 購入後、最新の最適化されたセット ファイルについてメッセージを送ってください。 MT5バージョンは こちらから入手できます。 Beast Super Signal EA は こちらから 入手できます。 コメント セクションをチェックして、最新の結果を確認してください。 ビースト スーパー シグナルは、1:1、1:2、または 1:3 のリスクと報酬の比率に基づいて、エントリー価格、ストッ
作者のその他のプロダクト
Trend Anthropoid is a trend indicator that allows you to effectively determine the direction of the current trend, as well as identify potential reversal points. The indicator makes it possible to classify the direction of price movement by determining its strength. Solving this problem helps to enter the market on time and get the desired result. Let's start with the benefits. Allows you to determine the current trend. You can quickly understand which trend is currently developing in the mark
The Trend Logic indicator provides an opportunity to classify the direction of price movement by determining its strength. Solving this problem helps to enter the market on time and make a good profit. It is extremely important for any trader to correctly determine the direction and strength of the trend movement. Unfortunately, there is no single correct solution to this problem. Many traders trade at different time frames. For this reason, the received signals are perceived subjectively. The
The Trend Goblin indicator identifies the mainstream trend. They help to analyze the market on a selected time frame. Easy to set up and works on all pairs and all time frames. Trend indicators provide an opportunity to classify the direction of price movement by determining its strength. Solving this problem helps investors enter the market on time and get good returns. It is extremely important for any trader to correctly determine the direction and strength of the trend movement. Unfortunat
Индикатор Adapter определяет господствующую тенденцию, помогает анализировать рынок на выбранном временном интервале. Прост в настройке и работает на всех парах и всех временных интервалах. Индикаторы тренда дают возможность классифицировать направление ценового движения, определив его силу. Решение этой проблемы помогает инвесторам вовремя войти в рынок и получить хорошую отдачу. Для любого трейдера крайне важно правильно определить направление и силу трендового движения. К сожалению, единств
The Analytical Trend indicator can track sustained price movement in a specific direction. In this case, the movement itself can be downward, upward or sideways, when the market movement does not have a pronounced direction. The indicator works on the basis of two moving averages and an oscillator. Using the signal search algorithm, the indicator generates signals in the form of arrows. Flexible settings allow you to receive more accurate signals for opening positions. You can quickly understan
The Supernatural channel is determined using a special algorithm, marker points are used to determine the movement of the channel. The Supernatural channel consists of two lines, red and blue, that make up the channel. Simple, visual and efficient use. Can be used for intra-channel trading. The indicator does not redraw and does not lag. Works on all currency pairs and on all timeframes.
Channel Oscillations is a non-redrawing channel indicator based on moving averages. The key difference between the Channel Oscillations indicator and other channel indicators is that Channel Oscillations does not take into account simple moving averages, but double-smoothed ones, which, on the one hand, makes it possible to more clearly determine the market movement, and on the other hand, makes the indicator less sensitive.
Introducing the Diogenes trend indicator! The indicator analyzes market dynamics for pivot points. Shows favorable moments for entering the market in stripes. The principle of operation of the indicator is to automatically determine the current state of the market when placed on a chart. Ready-made trading system. Can be used as a channel indicator or level indicator! This indicator allows you to analyze historical data and, based on them, display instructions for the trader for further action
The Trend Champion indicator works on all timeframes and currency pairs. The indicator should be used as an auxiliary tool for technical analysis, it helps to determine the direction of the trend: either upward or downward price movement for a particular currency pair. Can be used along with oscillators as filters. Trend Champion is a trend indicator. Arrows indicate favorable moments and directions for entering the market. The indicator can be used both for pipsing on small periods and for lo
The Qubit Trend indicator works using the cyclical-wave dependence function. Thus, all entry points will be optimal points at which movement changes. Entry points should be used as potential market reversal points. The default indicator settings are quite effective most of the time. You can customize them based on your needs. But do not forget that the approach must be complex, the indicator signals require additional information to enter the market.
The regression channel is one of the most popular technical analysis tools among traders. First, the indicator draws a trend line between two points, then on its basis it builds a channel of two parallel lines, which will be at the same distance from the regression line. The term linear regression belongs to the field of statistics. The center line of the channel is the trend line. To calculate it, the least squares method is used. The line above the center line acts as resistance for the pric
Control Shot - Unique indicator for identifying trends. The new system adapts to the market, eliminates additional conditions and copes with its task. A revolutionary new way to identify the start of a trend early. The trend indicator, shows signals, can be used with an optimal risk ratio. It uses reliable algorithms in its calculations. Shows favorable moments for entering the market with arrows, that is, using the indicator is quite simple. Tired of adjusting the indicator settings, wasting
Planned transition is a trend indicator that will help a trader to determine the direction of trade. The indicator has a complex algorithm of work. But for the user, only two lines remain, the red line indicates a sell trend, and the blue line indicates a buy trend. Thus, it is quite simple to interpret the indicator signals. The indicator works on different timeframes; to work with lower timeframes, it is recommended to decrease the indicator period for more frequent entries. To work on higher
Modify Trend - Unique indicator for identifying trends. The indicator has a complex algorithm of work. But for the user there are only two colors of arrows, red indicates a sell trend, blue indicates a buy trend. Thus, it is quite easy to interpret the indicator signals. The indicator works on different timeframes; to work with lower timeframes, it is recommended to decrease the indicator period for more frequent entries. To work on higher timeframes, on the contrary, increase. The new system ad
Just download the Quarter Strike indicator and embrace your dream. Trading within the volatility range has always attracted traders, because most often it is simple instruments that turn out to be the most profitable. The Quarter Strike indicator is a variant of constructing a price channel that gives signals of sufficiently high accuracy on any instruments and time periods. Bias or other additional parameters are not applied, that is, the indicator evaluates only the real dynamics. By default
The SPV indicator clearly reflects the cyclical nature of the market. Just one key setting! If it is equal to one, then a fast cycle is displayed, but if, for example, the parameter is 12, then the indicator looks for a cycle in the last 12 bars. You can see the ups and downs of the indicator alternate and have such dependence on the market, which can be used to draw conclusions to predict price behavior. Also, indicators can be combined with each other. Also, the indicator can indicate the qual
The SPV Cross indicator is based on the SPV  indicator. Works as two indicators together on the same chart. With different settings, you can react to the intersection of lines. Clearly reflects the cyclical nature of the market. Just two key settings! It works on the basis of the principle - one is fast and the other is slow. You can see the ups and downs of the indicator alternate and have such a relationship with the market, which can be used to draw conclusions to predict price behavior. The
The SPV Corr indicator displays the average percentage correlation between the bar's body and its shadows. A very effective system for building various filters and market entry confirmations. It fixes cyclicality and can be used in trading in different ways. You can see the ups and downs of the indicator alternate and have such a relationship with the market, which can be used to draw conclusions to predict price behavior. Also, indicators can be combined with each other. The value of the indica
The SPV Body indicator displays the average analysis of the intersection of adjacent bars. The indicator can easily detect unusual market movements which can be used as a filter. For clarity, poke the graphs to the very beginning of the history when the bars were incomplete, and the indicator will easily display this anamaly. A very effective system for building various filters and confirmations of market entry, to exclude anomalies from trading. It also fixes cyclicity, it turns out that the in
The SPV Volatility indicator is one of the most effective filters. Volatility filter. Shows three volatility options. The so-called limit, real, and the last most effective filter for the filter is the percentage filter. Percentage display of folatility shows the ratio of limit to real volatility. And thus, if we trade in the middle of the channel, then it is necessary to set a condition that the percentage is less than a certain indicator value. If we trade on the channel breakout - following t
Mastodon - displays potential market entry points. According to the wave theory, Mastodon displays the course of a large wave, while the oscillator can specify the entry point, that is, catch the price movement inside it, i.e. small “subwaves”. By correctly understanding the wave nature of price movements and using the Mastodon indicator in conjunction with an oscillator, you can create your own trading system, for example, entering the market after a large wave has formed and then exiting whe
The advantage of working with the Gladiator signal indicator is that the trader does not need to conduct technical analysis of the chart on his own. The tool generates ready-made signals in the form of directional arrows. The indicator is considered effective as it does not redraw its signals. This tool is an arrow (signal) one and works without redrawing. Its signals are based on a robust algorithm. Gladiator does not change its readings. Daily and session ranges can be useful for confirming
Signal Casablanca - Arrow technical indicator in the Forex market without redrawing. Able to give hints with minimal errors. It combines several filters, displaying market entry points with arrows on the chart. You can note the accuracy and clarity of the signals of this pointer indicator. Having seen a signal to buy, a trader opens an order without expecting that after a while the initial hint may change to the completely opposite one or simply disappear, having lost its relevance. The signal w
Fargo does not change its readings, it is a technical indicator in the Forex market without redrawing. It combines several filters to display market entry arrows on the chart. You can note the accuracy and clarity of the signals of this pointer indicator. When a suitable moment for buying appears, the indicator generates a signal exactly at the moment of its appearance and not below or above the current candle. The arrow will be exactly at the price where the signal appears and will not change
Trend Expert. It works by entering the market with only one buy order and another sell order. It does not form a series of rendering, and therefore you can work with them starting from $ 100! Which is great for beginners. To enter, it uses a system of indicators and a system of dynamic correction of stops depending on volatility, which can be disabled in the settings, but in this case, you will significantly reduce the efficiency of the bot. The bot implements a money management system, which c
Catch is a reversal indicator and is part of a special category of instruments. it not only analyzes the price movement, but also indicates the points of possible reversals. This facilitates fast and optimal opening of buy or sell orders (depending on the current situation). In this case, the historical data of the analyzed asset must be taken into account. It is the correct execution of such actions that largely helps traders to make the right decision in time and get a profit.
The Matios indicator visually unloads the price chart and saves analysis time: no signal - no deal, if an opposite signal appears, then the current deal should be closed. This is an arrow indicator for determining the trend. According to the wave theory, Matios displays the course of the wave, while the oscillator can specify the entry point, that is, catch the price movement inside it, i.e. small “subwaves”. By correctly understanding the wave nature of price movements and using the Matios in
Sting implements indicator technical analysis and allows you to determine the state of the market in the current period and make a decision on a deal based on certain signals. Sting is the result of mathematical calculations based on data on prices and trading volumes. Sting creates signals to perform operations on strong trend movements; it is more expedient to use it for trading when the trend is weakening or sideways. It is used as an additional one, regardless of the phase of the trend mov
Labyrinth - Trend Expert Advisor. It works by entering the market in lots of buy and sell. It does not form a series of rendering, and therefore you can work with them starting from $ 1000! Which is great for beginners. The bot implements a money management system, which consists in a competent calculation of the risk depending on the deposit. For the correct calculation of the volume, you need to specify the base deposit for calculating the risk. By default, we are talking about a $ 1000 depos
Haine is a reversal indicator that is part of a special category of instruments. The indicator not only analyzes the price movement, but also indicates the points of possible reversals. This facilitates fast and optimal opening of buy or sell orders (depending on the current situation). In this case, the historical data of the analyzed asset must be taken into account. It is the correct execution of such actions that largely helps traders to make the right decision in time and get a profit. Th
フィルタ:
レビューなし
レビューに返信