Trend Logic

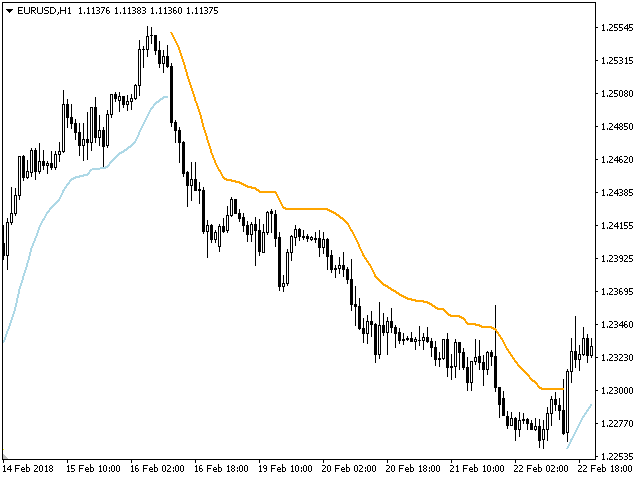
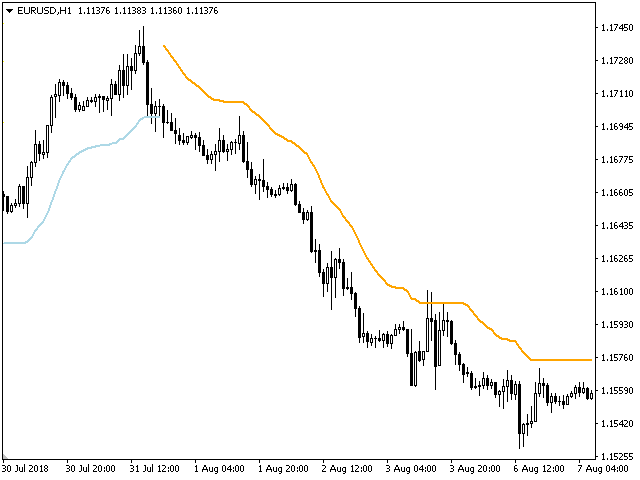
The Trend Logic indicator provides an opportunity to classify the direction of price movement by determining its strength. Solving this problem helps to enter the market on time and make a good profit. It is extremely important for any trader to correctly determine the direction and strength of the trend movement. Unfortunately, there is no single correct solution to this problem. Many traders trade at different time frames. For this reason, the received signals are perceived subjectively. The indicator is flexible enough, by manipulating the settings you can achieve the desired result.

The indicator can be used both for pipsing on small periods and for long-term trading. The indicator does not redraw and does not lag. Works on all currency pairs and all timeframes.
おすすめのプロダクト
Range Filtered AlgoAlphaは、市場のボラティリティを分析することで潜在的な取引機会を特定するためのテクニカル分析ツールです。このMetaTrader向けAlgoAlphaオリジナルTradingViewインジケーターの改訂版は、複数の分析方法を組み合わせて視覚的な市場評価を提供します。 技術的特徴 価格平滑化にカルマンフィルター(Kalman Filtering)を採用 ボラティリティ測定にATRベースバンド(ATR-based Bands)を統合 トレンド分析にスーパートレンド(Supertrend)要素を組み込み カラーろうそく足(Candles)とマーカー(Markers)で視覚的シグナルを提供 設定可能なアラート機能(Configurable Alerts)を装備 機能性 当インジケーターは市場データを処理し以下を実現: ATR(平均真の範囲)を使用したボラティリティレンジ計算 市場ノイズ低減のためのフィルタリング技術(Filtering Techniques)適用 視覚的要素(Visual Elements)による潜在的なトレンド方向の表示 使用事例 ボ
Alpha Trend signは私たちの取引システムを検証し、取引信号を明確に提示し、信号がドリフトすることはありません。 主な機能: •市場が活況を示している地域に応じて、指標に基づいて現在の相場がトレンド相場に属しているか、それとも揺れ相場に属しているかを直感的に判断することができる。 そして、指標の指示矢印に基づいて市場に切り込み、緑の矢印は購入を提示し、赤の矢印は販売を提示する。 •小周期変動による頻繁な取引信号の発生を回避するために、5分以上の時間周期で取引を行うことを推奨します。 •最適な取引タイミングを逃さないために、シグナルプロンプトをオンにすることもできます。 •本指標はトレンド相場をよく予測するだけでなく、幅広振動相場でも利益を得ることができる。 •本指標は大道至簡の原則に基づいており、異なる段階のトレーダーが使用するのに適している。 注意事項: •Alpha Trend signには明確な入退場信号があり、損失を与えないように逆位相操作を提案しない。 •Alpha Trend signは特に成熟した指標であり、デルのチー
Limitless MT4は、すべての初心者と経験豊富なトレーダーに適したユニバーサルインジケーターです。 すべての通貨ペア、暗号通貨、生の株式で動作します 無制限のMT4-構成済みで、追加の構成は不要 そして今、主なもの なぜ無制限のMT4なのか? 1再描画の完全な欠如 2トレーディングの最高のスペシャリストによる2年間のテスト 3正しい信号の精度が80%を超える 4ニュースリリース中の取引で好調 取引ルール 1買いシグナル-青い上向き矢印の出現 下向きの赤い矢印の外観を販売するシグナル シグナル後の次のローソク足で取引を開始するには2 3テイクプロフィット チャート上 М1-40ピップ М5-50ピップ М15-55-60ピップ 4ストップロスは利益をとる 5誤った信号をフィルタリングするために、 パラボリックSAR-トレンドとのトレードへの参入を除外する移動平均または同様のトレンドインジケーター。 
Pro Magic Signal   indicator is designed for signal trading. This indicator generates trend signals.  It uses many algorithms and indicators to generate this signal. It tries to generate a signal from the points with the highest trend potential. This indicator is a complete trading product. This indicator does not need any additional indicators.  The indicator certainly does not repaint. The point at which the signal is given does not change.  Thanks to the alert features you can get the signals
Closing average This is a completely new indicator in technical analysis. It is based solely on mathematical calculation. about signals It’s worth going into a buy transaction when the price has crossed the indicator line from bottom to top and it is under the price it is worth entering a deal on sell when the price is below the indicator line This author’s development, he doesn’t use any indicators of technical analysis in his analysis.
The indicator scans for stop grabber (special pattern of Joe Dinapoli which gives very high probability buy / sell signals and does not repaint ) signals in multiple timeframes for the all markets filtered and shows the results on Dashboard. Key Features Dashboard can be used for all markets It can scan for stop grabber pattern on MN1, W1, D1, H4, H1, M30, M15 ,M5, M1 timeframes Parameters UseMarketWatch: Set true to copy all symbols available in market watch MarketWatchCount : Set the number
Overview Base Box Indicator automatically detects and draws institutional supply and demand base zones using the Rally-Base-Rally (RBR) and Drop-Base-Drop (DBD) price action methodology — one of the most reliable frameworks for identifying high-probability reversal and continuation areas. Unlike basic support/resistance tools, this indicator isolates the precise consolidation phase (the "Base") between two impulse moves and renders it as a structured 3-layer box that separates candle bodies from
One of the most beloved areas in price chart analysis is the use of graphical analysis. The state of the market, the phase of its movement, largely determines the success of the trader and his chosen strategy. The intelligent algorithm of the Trend RB indicator accurately determines the trend, filters out market noise and generates input signals. The indicator uses a color alarm: blue - when changing from descending to ascending, and red - on the contrary, to descending. You can use the indicat
The technical indicator "Reversal patterns" is a mathematical interpretation of the classic reversal patterns: Pin Bar, Harami and Engulfing. That is, the "reversal bar", "Harami" and "Absorption". This indicator allows you to determine the moment of reversal of quotes based on market dynamics and the winner between the "bulls" and "bears". The indicator displays the moment of reversal at the local highs and lows of the chart of any timeframe, which allows you to increase the accuracy of the s
この指標は、非常に「アダマント」で本質的に強いレベルを描画します。 これらのレベルは一生の間強い価格棄却レベルとして機能し、決して塗り替えません。 すべてのロジックレベルを取引システムに組み込むために、1か月のサブスクリプション価格で6か月のすべてのロジックレベルのサブスクリプションを利用できます。 これが役に立てば幸いです。 免責事項:あなたは空想、カラフルで目を引くインジケーターを探しているなら離れてください。 価格が保持、バウンス、またはブレークする可能性があるレベルを考慮しない限り、どのトレーダーも良いトレーダーになることはできません。 これらのレベルは、トレーダーがより安い価格で市場に参入するのを助けます。それらは支持抵抗、需要供給、要点、フィボナッチレベルなどです。 何年もの価格チャートの調査と分析の後、私は将来の予想される価格の振る舞いを見つけるための複雑なアルゴリズムと論理をほとんど発見しませんでした。 これらのロジックとアルゴリズムを特定のプライスポイントに適用することで、価格がバウンスまたはブレークする可能性があるレベルを達成しました。 私は
Trend Second Derivative RSI is a forex indicator based on the usual RSI, based on the second derivative of the price function. On the chart itself, trend signals will be displayed by arrows, they are filtered by the algorithm and always alternate buy / sell. It also shows the number of profitable pips that the indicator can give at the specified interval (LimitCalcHistory). The indicator has a parameter (Spread), which deducts a part of the profit per spread for each signal. Immediately notice
Gladiator Signal indicator for binary options can be used in the forex market... a signal appears when you open a new candle, we need to wait for it to close.. and at the time of opening a new one if the signal is to open a deal for one candle of the current timeframe works great on all time frames... in the settings you can enable turn off the alert and sound vision...
Big Trend Signal   indicator is designed for trend and signal trading. This indicator generates trend signals.  It uses many algorithms and indicators to generate this signal. It tries to generate a signal from the points with the highest trend potential. This indicator is a complete trading product. This indicator does not need any additional indicators.  You can only trade with this indicator. The generated signals are displayed on the graphical screen.  Thanks to the alert features you can ge
Signal Undefeated   indicator is designed for trend and signal trading. This indicator generates trend signals.  It uses many algorithms and indicators to generate this signal. It tries to generate a signal from the points with the highest trend potential. This indicator is a complete trading product. This indicator does not need any additional indicators.  You can only trade with this indicator. The generated signals are displayed on the graphical screen.  Thanks to the alert features you can g
チャート上で価格反転ポイントを示すインジケーター。 RSIおよびその他の標準インジケーターを使用して、インジケーターは価格反転ポイントを決定し、矢印でチャートに表示します。インジケーターはその値を再描画せず、95%の場合に正確な信号を示します。このインジケーターは、すべての通貨ペアとすべての時間枠で機能します。 このインジケーターとの取引方法(推奨): 表示される矢印の方向に取引を開始することをお勧めします。青い矢印が表示されたら、購入注文を開きます。赤い矢印が表示された場合は、売り注文を開きます。 TakeProfitは、GBPUSD通貨ペアに平均15〜25ポイントを設定することをお勧めします。他のペアは個別に調べる必要があります。 StopLossはTakeProfitの2倍に設定されています。または、シグナルが反対方向に表示されたときに注文を閉じます。重要なニュースがリリースされる前に取引しないことをお勧めします。市場が予測不可能になるため、インジケーターが誤ったシグナルを出すことがあるのはこの期間中です。また、このインジケーターを既存のトレーディングシステムと組み合わせて
Reversal Area Indicator (MT4) A precision‑engineered MT4 indicator designed to capture market tops, bottoms, and re‑entry points using intelligent Support/Resistance zone detection and high‑probability reversal logic. The Reversal Area Indicator identifies dynamic reversal zones where price is most likely to react, giving you early, accurate Buy/Sell entries with extremely small Stop Losses and exceptional Risk‑to‑Reward potential. Optimized for fast‑moving charts (M1/M5) yet powerful enough f
The objective of the Crypto-Box Indicator is to determine the most efficient entry in trends. . It works for all purposes, standing out in the main cryptocurrencies: BitCoin, LiteCoin, Ethereum and Emercoin. And in Currencies: EURUSD, USDJPY и GBPUSD. The indicator is designed to find the best conditions for financial instruments. Detects acceleration patterns in prices in areas of supports and resistances. The development team is constantly improving the functionality of the Indicator and we th
The   True Magic Oscillator   indicator is designed for signal trading. This indicator generates trend signals. It uses many algorithms and indicators to generate this signal. It tries to generate signals from the points with the highest trend potential. This indicator is a complete trading product. This indicator does not need any additional indicators. The indicator is never repainted. The point at which the signal is given does not change.         Features and Recommendations Works wit
This indicator works on MT4 and is very easy to use. When you receive a signal from it, you wait for that candle with the signal to close and you enter your trade at the beginning of the next new candle . A red arrow means sell and a green arrow means buy. All arrows comes with Alert  like for easy identification of trade signal. Are you okay with that? 1 minute candle 1 minute expire
Binary Options Support Resistance Indicator This indicator is designed for binary options trading and effectively shows retracements from support and resistance levels. Signals appear on the current candle. A red arrow pointing downwards indicates a potential selling opportunity, while a blue arrow pointing upwards suggests buying opportunities. All that needs adjustment is the color of the signal arrows. It is recommended to use it on the M1-M5 timeframes as signals are frequent on these timef
This indicator is designed based on Mr.   WD   Gann's square of nine methods. Using this indicator, we can enter the desired   pivot   price and, based on the coefficient we assign to it, extract 8   support and resistance   numbers with 8 angles of 45, 90, 135, 180, 225, 270, 315, and 360. Calculates 8   support and resistance   points and draws   support and resistance   lines. The coefficient is to triple the number of executions. To select   pivot points   in which a price is a large nu
Developed to assist in binary options retracement operations, this indicator will show the assets with the best retracement percentages! How it works: The indicator will calculate the total length of each candle from low to high, the total of the body and total of shadows (up and down) and calculate a total shadows percentage of various configurable assets. The counter is updated with each new candle. ATENTION: Demo on the estrategy tester is not functional to show multiple assets.
Trade on the levels - the classic in the work of the trader. The ReversLevel indicator is one of the easiest but not less effective tools. From these levels you can build turning points, levels are constructed as statistical significance at a given time. You can use them as a ready-made trading strategy or as an additional filter in your trading system. In the settings you can set the offset for building levels.
Warning: Our product works with 28 symbols. The average accuracy level of the signals is 99%. We see signals below 15 pips as unsuccessful. Technique Signal   indicator is designed for signal trading. This indicator generates trend signals. It uses many algorithms and indicators to generate this signal. It tries to generate a signal from the points with the highest trend potential. This indicator is a complete trading product. This indicator does not need any additional indicators. The indi
¿Has escuchado decir que la tendencia es tu amiga? pues nada es mas cierto en el mundo del trading. Este indicador analiza las tendencias y su fuerza para que puedas aprovecharlas y utilizamos un conjunto de indicadores como RSI, %W, MACD y EMAS para analizar el mercado y sus movimientos, por lo que podrás mantener tu gráfico limpio sabiendo que todos estos indicadores los tienes en uno solo. Este, como cualquier indicador, no representa una certeza de compra o venta definitiva, por lo siempre r
Indicator FiboZag - transfer the indicator to the chart and the Fibonacci levels will be built automatically on the last ZigZag turn. The main advantage lies in the correct construction of Fibonacci levels and markup of price levels. Simple, visual and effective use. The indicator is not redrawn and does not lag. Works on all currency pairs and on all timeframes.
Mars 5     is a powerful indicator of   TREND   for any par and any timeframe. It doesn't requires any additional indicators for the trading setup.The indicator gives clear signals about opening and closing trades.This Indicator is a unique, high quality and affordable trading tool. Perfect For New Traders And Expert Traders Low risk entries. Never repaints signal. Never backpaints signal. Never recalculates signal. For MT4 Only Great For Scalping Great For Swing Trading Arrow Entry Alerts Pop
Pine script scalping indicator は、多層的な分析システムであり、高いボラティリティ環境下における価格マイクロストラクチャーの変動を精緻に解釈するために設計されています。その中核は、時間軸をまたぐ投影とトレンドベクトルの非線形近似を組み合わせた、複雑な動的価格系列フィルタリングモデルに基づいています。 従来型のテクニカル分析ツールとは異なり、本インジケーターは静的なオシレーター的アプローチに限定されず、複数段階の一貫性チェックを伴う市場データストリームのハイブリッド解釈を採用しています。本システムは「アダプティブ・スキャルピング」の概念を実装しており、カオス的ノイズ領域においても安定した分析シグナルを提示します。 インジケーターはターミナルの独立したウィンドウに配置され、極値確率ゾーンに焦点を当てた多チャンネル方向性分析構造を表示します。シグナルクラスターはビジュアルラベルでマーキングされ、リアルタイムにおける市場状態の即時解釈を可能にします。 特徴: 時間軸をまたぐフィルタリングに基づく適応的データ解釈。 価格インパルス発生確率が局所的最大に達する主要ゾー
The indicator is the advanced form of the MetaTrader 4 standard Fibonacci tool. It is unique and very reasonable for serious Fibonacci traders. Key Features Drawing of Fibonacci retracement and expansion levels in a few seconds by using hotkeys. Auto adjusting of retracement levels once the market makes new highs/lows. Ability to edit/remove any retracement & expansion levels on chart. Auto snap to exact high and low of bars while plotting on chart. Getting very clear charts even though many ret
Super Magic Signal     indicator is designed for signal trading. This indicator generates trend signals. It uses many algorithms and indicators to generate this signal. It tries to generate a signal from the points with the highest trend potential. This indicator is a complete trading product. This indicator does not need any additional indicators. The indicator certainly does not repaint. The point at which the signal is given does not change.     Features and Suggestions Time Frame: H1 W
このプロダクトを購入した人は以下も購入しています
Gann Made Easy は、ミスター・ギャンの理論を使用した取引の最良の原則に基づいた、プロフェッショナルで使いやすい外国為替取引システムです。 W・D・ガン。このインジケーターは、ストップロスとテイクプロフィットレベルを含む正確な買いと売りのシグナルを提供します。 PUSH通知を利用して外出先でも取引可能です。 ご購入後、取引方法の説明と優れた追加インジケーターを無料で入手するには、私にご連絡ください! おそらく、ギャンの取引手法についてはすでに何度も聞いたことがあるでしょう。通常、ギャンの理論は初心者のトレーダーだけでなく、すでにある程度の取引経験がある人にとっても非常に複雑なものです。なぜなら、ギャンの取引手法は理論的にはそれほど簡単に適用できるものではないからです。私はその知識を磨き、最良の原則を私の外国為替インジケーターに組み込むために数年を費やしました。 このインジケーターは非常に簡単に適用できます。必要なのは、それをチャートに添付し、簡単な取引推奨事項に従うだけです。このインジケーターは常に市場分析の仕事を行い、取引の機会を探します。適切なエントリーポイントを検出す
Scalper Inside PRO – Since 2020. An exclusive indicator that utilizes an innovative algorithm to swiftly and accurately determine the market trend. The indicator automatically calculates opening, closing, and profit levels, providing detailed trading statistics. With these features, you can choose the most appropriate trading instrument for the current market conditions. Additionally, you can easily integrate your own arrow indicators into Scalper Inside Pro to quickly evaluate their statistics
PRO Renko Systemは、特別にRENKOチャートを取引するために設計された高精度の取引システムです。 これは、様々な取引商品に適用することができる普遍的なシステムです。 システムは効果的に正確な逆転信号へのアクセスを与えるいわゆる市場の騒音を中和する。 表示器は非常に使いやすく、信号の生成に責任がある1つの変数だけがあります。 あなたは簡単にお好みの任意の取引ツールとレンコバーのサイズにツールを適応させることができます。 私はいつもあなたが私のソフトウェアで収益性の高い取引を支援するために余分なサポートを提供する準備ができています! 私はあなたに幸せで収益性の高い取引をしたいです! ご購入後にご連絡ください! 私はあなたに私のレンコチャートジェネレータを送信します。 私はまた、私の個人的な推奨事項やシステムの他のモジュールを無料で共有します!
Auto Optimized Parabolic RSI: 高度な3Dモメンタムエンジン ほとんどのリテール向けインジケーターは、市場のボラティリティが変化した瞬間に破綻する静的な入力値に依存しているため、失敗に終わります。Auto Optimized Parabolic RSIは、自らの数学的優位性を継続的に再計算することで「インジケーターの陳腐化」問題を解決し、機関投資家レベルの定量的適応力をMT5ターミナルに直接もたらします。 最大の強み: カスタムインメモリ3D最適化   標準的な自動最適化ツールは、インジケーターの呼び出しで端末に過負荷をかけるため、頻繁にMT5プラットフォームをフリーズさせます。本ツールは、このボトルネックを完全に回避しています。RAMベースのカスタムネイティブ計算機を内蔵した内部エンジンは、チャートを読み込んだりタイムフレームを変更したりするたびに、超高速の3Dグリッド探索を実行します。RSI期間(頻度)、SARステップ(加速度)、SAR最大値(制限速度)を同時にスイープし、プラットフォームを遅延させることなく、数万通りものパラメーターの組み合わせを絶対的
ご紹介     Quantum Breakout PRO は 、ブレイクアウト ゾーンの取引方法を変革する画期的な MQL5 インジケーターです。 13年以上の取引経験を持つ経験豊富なトレーダーのチームによって開発された Quantum Breakout PROは 、革新的でダイナミックなブレイクアウトゾーン戦略により、あなたの取引の旅を新たな高みに押し上げるように設計されています。 クォンタム ブレイクアウト インジケーターは、5 つの利益ターゲット ゾーンを備えたブレイクアウト ゾーン上のシグナル矢印と、ブレイクアウト ボックスに基づいたストップロスの提案を提供します。 初心者トレーダーにもプロのトレーダーにも適しています。 量子EAチャネル:       ここをクリック MT5バージョン:   ここをクリック 重要!購入後、インストールマニュアルを受け取るためにプライベートメッセージを送ってください。 推奨事項: 時間枠: M15 通貨ペア: GBPJPY、EURJPY、USDJPY、NZDUSD、XAUUSD アカウントの種類: ECN、Raw、またはスプレッドが非
After purchase, contact me privately to receive 1 month of free testing with EA Forex Proton! This advanced MT4 trading robot automatically executes signals from any MT4 indicator, including Market Makers. The latest version also includes AI integration, allowing each trade signal to be analyzed using Artificial Intelligence. Live Signal with EA Forex Proton: Click here Market Makers is a powerful price action trading system designed to identify high-probability Buy and Sell opportunities based
Apex Edge No Repaint MT4対応、プロ仕様のリペイントしないトレーディングインジケーター Apex Edge No Repaintは、リペイントする矢印の煩わしさから解放され、明確なシグナルを求める真剣なFXおよび仮想通貨トレーダー向けに設計された、高品質でクリーンかつ信頼性の高いトレーディングツールです。 主な機能: 100% リペイントなし – チャートに表示されたシグナルは固定されたままです デュアルシグナルシステム:早期のチャンスを提供するRAWシグナルと、高確率で確定したエントリーを提供するCONFシグナル シンプルなワンクリック切り替えボタン:RAW ON/OFFとCONF ON/OFF トレンド、強度パーセンテージ、シグナルステータスを表示するプロフェッショナルなリアルタイムダッシュボード インスタントアラート:ポップアップ、サウンド、メール通知 すべてのCONFシグナルにTP1、TP2、ストップロスレベルを自動描画 視覚的に分かりやすい、色分けされた矢印: ライムグリーン → CONF買い 赤 → CONF売り ドジャーブルー → RAW買
このインジケーターを購入すると、プロ仕様のトレードマネージャーを無料で差し上げます。 まず第一に、このトレーディングシステムがノンリペイント、ノンリドロー、ノンラグのインジケーターであることを強調する価値がある。これにより、手動取引とロボット取引の両方に理想的なものになっています。 オンラインコース、マニュアル、プリセットのダウンロード。 「スマートトレンドトレーディングシステム MT5」は、新規および経験豊富なトレーダー向けにカスタマイズされた包括的なトレーディングソリューションです。10以上のプレミアムインジケーターを組み合わせ、7つ以上の堅実なトレーディング戦略を備えており、多様な市場状況に対応する多目的な選択肢となっています。 トレンドフォロー戦略:トレンドを効果的に乗り越えるための正確なエントリーとストップロス管理を提供します。 リバーサル戦略:潜在的なトレンドの反転を特定し、トレーダーがレンジ相場を活用できるようにします。 スキャルピング戦略:高速で正確なデイトレードおよび短期取引のために設計されています。 安定性:すべてのインジケーターはノンリペイント、ノンリドロー、ノ
このインジケーターは、エリオット波動理論と組み合わせて作動し、2つの方法で使用されます: 自動モード: このモードでは、インジケーターがチャート上の全ての5つのモーティブ波を自動的に検出し、予測とポテンシャルな逆転ゾーンを提供します。また、アラートやプッシュメッセージを生成する能力も備えています。この自動機能により、エリオット波動パターンの識別と分析のプロセスが効率化されます。 手動モード: このオプションは、エリオット波動理論を手動で扱いたいトレーダー向けです。9つの段階を使用して波を描画することができます。各段階は、表示された後に描画されたラインを調整して個別に定義できます。この機能により、手動で波を描画するプロセスがより効率的になります。重要な点として、すべての描画データが将来の参照のためにプラットフォームのデータフォルダに保存されることに注意してください。 パラメータ: Name: インジケーターの名前。 Use_System_Visuals: インジケーターのテーマを有効または無効にして、取引プラットフォーム全体の外観に合わせます。 Explain_Comment: 波の番号
これはほぼ間違いなく、MetaTraderプラットフォームで見つけることができる最も完全な調和価格形成自動認識インジケーターです。 19種類のパターンを検出し、フィボナッチプロジェクションをあなたと同じように真剣に受け止め、潜在的逆転ゾーン(PRZ)を表示し、適切なストップロスとテイクプロフィットレベルを見つけます。 [ インストールガイド | 更新ガイド | トラブルシューティング | よくある質問 | すべての製品 ] 19の異なる調和価格形成を検出します プライマリ、派生および補完フィボナッチ投影(PRZ)をプロットします 過去の価格行動を評価し、過去のすべてのパターンを表示します この指標は、独自の品質とパフォーマンスを分析します 適切なストップロスとテイクプロフィットのレベルを表示します ブレイクアウトを使用して適切な取引を通知します すべてのパターン比をグラフにプロットします 電子メール/音声/視覚アラートを実装します スコット・M・カーニーの本に着想を得て、この指標は最も純粋で急を要するトレーダーのニーズを満たすように設計されています。ただし、トレードを容易にする
Please send me Direct message on MQL5 CHAT after purchasing the Indicator for Training and Installation Support There are some additional files that is important to use with the Indicator . So be sure to contact me after purchasing the Indicator So that I can add you for training and support . If you find any difficulty with installation then send me Direct message here So that I can connect with you via Anydesk or Teamview for the product installation. " Smart Order Block Indicator " to find m
ゴールドラッシュ・トレンド・アロー・シグナル ゴールドラッシュ・トレンド・アロー・シグナル 指標は、XAU/USDにおける高速・短期スキャルパー向けに最適化された、正確でリアルタイムのトレンド分析を提供します。 1分足専用に設計されたこのツールは、明確なエントリーポイントを示す方向矢印を表示し、スキャルパーが変動の激しい市場状況でも自信を持って取引できるよう支援します。 この指標は、PRIMARY(主要)とSECONDARY(補助)のアラート矢印で構成されています。PRIMARYシグナルは、トレンドの方向転換を示す白と黒の方向矢印であり、SECONDARYシグナルは、PRIMARY矢印が示す方向を確認し、潜在的なエントリーポイントを示す青と赤の矢印です。 注意:トレンド方向の変化後にPRIMARYアラート矢印が1つだけ表示される場合、複数のSECONDARY青/赤矢印が表示される点に注意が必要です。SECONDARYシグナルは、シグナル基準を満たす任意のローソク足後に表示されます。したがって、長期的なトレンド移動の場合、画面に多くのSECONDARY矢印が表示されます(添付の
「 Dynamic Scalper System 」インジケーターは、トレンド波の中でスキャルピング取引を行う手法のために設計されています。 主要通貨ペアと金でテスト済みで、他の取引商品との互換性があります。 トレンドに沿った短期的なポジションオープンのシグナルを提供し、追加の価格変動サポートも提供します。 インジケーターの原理 大きな矢印はトレンドの方向を決定します。 トレンド波の中では、小さな矢印の形でスキャルピングシグナルを生成するアルゴリズムが機能します。 赤い矢印は強気方向、青い矢印は弱気方向です。 トレンドの方向には敏感な価格変動ラインが描かれ、小さな矢印のシグナルと連動します。 シグナルは次のように機能します。適切なタイミングでラインが現れるとエントリーシグナルが形成され、ラインが開いている間はポジションが保持され、完了すると取引が終了します。 推奨される動作時間枠はM1~H4です。 矢印は現在のローソク足に形成され、次のローソク足が開いている場合は、前のローソク足の矢印は再描画されません。 入力パラメータ Trend Wave Period - トレンド方向
トレンドトレーディング は、タイミングのプルバックとブレイクアウトにより、市場で起こっているトレンドから可能な限り利益を得るように設計された指標です。確立されたトレンドの中で価格が何をしているかを分析することにより、取引の機会を見つけます。 [ インストールガイド | 更新ガイド | トラブルシューティング | よくある質問 | すべての製品 ] 自信を持って効率的に金融市場を取引する むち打ちにならずに確立されたトレンドから利益を得る 収益性の高いプルバック、ブレイクアウト、早期の逆転を認識する この指標は、独自の品質とパフォーマンスを分析します 複数時間枠のダッシュボードを実装します インジケーターは再描画されていません 電子メール/音声/視覚アラートを実装します 確立されたトレンドは多くの取引機会を提供しますが、ほとんどのトレンド指標はそれらを完全に無視しています。インジケーターの解釈はかなり簡単です: (1) トレンドの変化 (2) トレンドの方向への後退 (3) トレンドの方向へのブレイクアウト 赤いダッシュ は下降トレンド中の修正です 青いダッシュ は上昇トレンド中
GOLD Impulse with Alert
Bernhard Schweigert
4.67 (12)
このインディケータは、当社の2つの製品 Advanced Currency IMPULSE with ALERT  +   Currency Strength Exotics . のスーパーコンビネーションです。 このインジケーターは全ての時間枠で作動し、8つの主要通貨と1つのシンボルの強弱のインパルスをグラフで表示します。 このインジケータは、金、エキゾチックペア、商品、インデックス、先物など、あらゆるシンボルの通貨強度の加速度を表示することに特化されています。金、銀、原油、DAX、US30、MXN、TRY、CNHなどの通貨強度の加速度(インパルスまたは速度)を表示するために、任意のシンボルを9行目に追加できる、この種の最初のものです。 新しいアルゴリズムに基づいて構築され、潜在的な取引の特定と確認がさらに容易になりました。これは、通貨の強さや弱さが加速しているかどうかをグラフィカルに表示し、その加速の速度を測定するためです。加速すると物事は明らかに速く進みますが、これはFX市場でも同じです。つまり、反対方向に加速している通貨をペアリングすれば、潜在的に利益を生む取引を特定
Advanced Supply Demand
Bernhard Schweigert
4.91 (300)
現在40%オフ 初心者にもエキスパートトレーダーにも最適なソリューション このインジケーターは独自の機能と新しい公式を多数内蔵しており、ユニークで高品質かつ手頃な取引ツールです。このアップデートでは、2つの時間枠ゾーンを表示できるようになります。より長いTFだけでなく、チャートTFとより長いTF(ネストゾーンを表示)の両方を表示できます。すべてのSupply Demandトレーダーの皆さんのお気に召すはずです。:) 重要情報の公開 Advanced Supply Demandの可能性を最大化するには、 https://www.mql5.com/ja/blogs/post/720245 にアクセスしてください。   エントリーまたはターゲットの正確なトリガーポイントを正確に特定できれば取引がどのように改善されるか想像してみてください。新しい基盤となるアルゴリズムに基づいて構築されているため、買い手と売り手の間の潜在的な不均衡をさらに簡単に特定できます。これは、最も強い需要と供給のゾーンと、過去のパフォーマンス(古いゾーンを表示)がグラフィカルに表現されるためです。これらの機能は、最適な
このインディケータは、異なる期間のフラクタルの価格構造を調べて、市場で起こり得る反転ポイントを決定し、すでに基本的または技術的な評価モデルを持っているポジショントレーダーにタイミングを提供します。弟の リバーサルフラクタル とは異なり、このインジケーターは選択された期間のためにリバーサルを逃すことはなく、ジグザグ形式でリバーサルフラクタルを見つけます。 [ インストールガイド | 更新ガイド | トラブルシューティング | よくある質問 | すべての製品 ] ターニングポイントは長いトレンドを開始できます インジケーターは再描画されていません あらゆる種類のアラートを実装します カスタマイズ可能な色とサイズ フラクタルは奇数番目のバーのフォーメーションであり、フォーメーションの最上位または最下位の中間バーであり、フラクタル内のすべてのバーが閉じるとインディケーターが描画されるため、このインジケーターはリアクティブまたは遅れ信号です。ただし、既存の方向バイアスを持つトレーダーは、この指標が非常に有用であり、早期のエントリポイントを取得します。 このインディケーターは、ボイルダウンされた
サポート線と抵抗線のプロットにうんざりしていませんか? サポートレジスタンス は、非常に興味深いひねりを加えてチャート内のサポートとレジスタンスラインを自動検出およびプロットするマルチタイムフレームインジケーターです。価格レベルは時間とともにテストされ、その重要性が高まるにつれて、ラインは太くなり、暗くなります。 [ インストールガイド | 更新ガイド | トラブルシューティング | よくある質問 | すべての製品 ] 一晩でテクニカル分析を強化 チャートを閲覧せずに重要な価格レベルを検出 一目ですべての価格レベルの相対的な強さを認識する すべての取引で最大30時間のプロットラインを節約 インジケーターは、すべての価格レベルの年齢を表示します インジケーターは再描画されていません 過去および現在の価格レベルは近接によって崩壊し、現在の市場行動に合わせて調整されます。動作は、必ずしもピークではない場所に線が引かれます。 価格レベルは、時間とともに拒否されるにつれて、より暗く、より広くなります ノイズを避けるために、重要でない価格レベルは定期的にクリアされます カスタマイズ可能な時間枠の
They say history repeats itself. What if you could prove it in real-time? The Propfolio Ghost Pattern is an advanced algorithmic pattern-matching engine. It empowers you to select any current price action structure on your chart and instantly scan thousands of historical candles to find the exact moment in the past where the market did the exact same thing. Once it finds the highest probability match, it projects the historical outcome into the future as "Ghost Candles"—giving you a highly calcu
現在26%OFF! このインディケータは、当社のメインインディケータ( Advanced Currency Strength 28   &  Advanced Currency IMPULSE with ALERT )の両方のスーパーコンビネーションです。28の外国為替ペアのTICK-UNITSとアラートシグナルの通貨強度の値を示しています。11種類のTick-Unitが使用可能です。1、2、3、4、5、6、10、12、15、20、30秒の11種類です。サブウィンドウのTick-Unitバーは、秒単位のタイマーに1ティック以上含まれる場合に表示され、左側にシフトされます。 たった1枚のチャートで、28のFXペアをスキャルピングできます。スキャルピングのチャンスとなるトリガーポイントを正確に把握することで、スキャルピングが上達することを想像してみてください。 1分足よりも短い期間で動作する市場初の通貨強度インジケーターです! このインジケータは、素早いインとアウトを行い、小さなピップを切り取ることを望む高速スキャルパーのためのものです。 ユーザーマニュアル: ここをクリック h
まず第一に、この取引インジケーターは再描画されず、再描画されず、遅延しないことを強調する価値があります。これにより、手動取引とロボット取引の両方に理想的なものになります。 ユーザーマニュアル:設定、入力、戦略。 アトミックアナリストは、価格の強さとモメンタムを利用して市場でより良いエッジを見つけるためのPA価格アクションインジケーターです。ノイズや誤ったシグナルを除去し、取引ポテンシャルを高めるための高度なフィルターを備えています。複雑なインジケーターの複数のレイヤーを使用して、アトミックアナリストはチャートをスキャンし、複雑な数学的計算をシンプルなシグナルと色に変換します。これにより、どのような初心者トレーダーでも理解して使用し、一貫した取引の決定を行うことができます。 「アトミックアナリスト」は、新規および経験豊富なトレーダー向けにカスタマイズされた包括的な取引ソリューションです。プレミアムインジケーターとトップノッチの機能を1つの取引戦略に組み合わせ、すべてのタイプのトレーダーにとって汎用性のある選択肢にします。 デイリートレーディングとスキャルピング戦略:高速で正確な
購入後、このインジケーターに基づいたボーナスEAを受け取るためにご連絡ください。 Self Optimizing Double MA Strategyは、パラメータ推測の必要性を排除するために設計されたプロフェッショナルグレードの取引ツールです。組み込みの自動最適化エンジンを搭載し、バックグラウンドで何千ものパラメータの組み合わせをシミュレートすることで、変化する市場状況に継続的に適応し、統計的な優位性を維持します。 静的で時代遅れの設定に依存するのではなく、インジケーターは自身のロジックを動的に更新し、現在の時間枠と取引商品にとって最も収益性の高い構成を見つけ出します。 主な機能 組み込みの自動最適化: 選択した更新頻度に基づいて、システムはFast MA、Slow MA、およびRSIの期間を定期的に再計算し、設定が常に現在の市場のリズムと一致するようにします。 MAダイバージェンスフィルター: 移動平均線が明確に乖離している(広がっている)場合にのみシグナルを検証する、トレンド強度のコア指標です。これにより、移動平均線が収束している相場や平坦なレンジ相場での誤ったエントリーを防ぎ
現在40%オフ 初心者やエキスパートトレーダーに最適なソリューション! このインジケーターは、独自の機能と新しい計算式を取り入れた、ユニークで高品質、かつ手頃な価格のトレーディングツールです。たった1枚のチャートで28の為替ペアの通貨強度を読み取ることができます。新しいトレンドやスキャルピングチャンスの引き金となるポイントを正確に特定することができるので、あなたのトレードがどのように改善されるか想像してみてください。 ユーザーマニュアルはこちら  https://www.mql5.com/en/blogs/post/697384 これが最初の1本、オリジナルだ! 価値のないクローンを買わないでください。 特別な サブウィンドウの矢印で強い通貨の勢いを表示 GAPがあなたのトレードを導く! 基準通貨や気配値が売られすぎ・買われすぎのゾーン(外相フィボナッチレベル)にあるとき、個別チャートのメインウィンドウに警告表示。 通貨がレンジの外側から反落した場合、プルバック/リバーサルのアラート。 クロスパターンの特別なアラート 複数の時間枠を選択可能で、トレンドを素早く確認できます
チャートを構成し、周期的な価格変動を識別するテクニカル指標。 どのチャートでも動作します。 いくつかの種類の通知。 グラフ自体に追加の矢印があります。 履歴を再描画せずに、キャンドルのクローズに取り組みます。 M5以上のTFを推奨します。 パラメータの使用と設定が簡単です。 異なるパラメータを持つ 2 つのインジケーターを使用する場合、他のインジケーターなしで使用できます。 入力パラメータは2つあります 周期性と信号持続時間 これら 2 つのパラメータは、チャート構造の処理を扱います。 Cyclicity - 反転サイクルが変化する頻度を調整し、サイクルを滑らかにします。 Signal duration - 最小数では価格変動の衝動を検出し、最大数では長期的なトレンドの動きを検出します。
The indicator is built on a non-standard Zig Zag, it draws accumulations after which if the price leaves this zone and a test of this zone occurs, then a sound signal is given and an arrow appears - after the test candle closes.The indicator does not redraw its signals, it is very easy to use, there are only three settings 1- this is the zig zag parameter 2- this is the minimum price exit from the zone 3- this is the maximum price exit from the zone. The lower the parameter for Zig Zag, the more
Trend Screener
STE S.S.COMPANY
4.79 (95)
トレンドインジケーター、1つのツールに組み込まれたすべての重要なトレンド機能を備えたトレンドトレーディングとフィルタリングのための画期的なユニークなソリューション! これは、すべてのシンボル/商品(外国為替、商品、暗号通貨、インデックス、株式)で使用できる100%再描画されていないマルチタイムフレームおよびマルチ通貨インジケーターです。 期間限定オファー: サポートおよびレジスタンス スクリーナー インジケーターは、たった 65 ドルで永久的にご利用いただけます。(元の価格 250 ドル) (オファー延長) トレンドスクリーナーは、チャート内のドットで矢印トレンドシグナルを提供するインジケーターに続く効率的なインジケーターです。 トレンド分析インジケーターで使用できる機能: 1.トレンドスキャナー。 2.最大利益分析を備えたトレンドライン。 3.トレンド通貨強度メーター。 4.アラート付きのトレンド反転ドット。 5.アラート付きの強いトレンドドット。 6.トレンド矢印 毎日の分析例、毎日のシグナルパフォーマンス...など、トレンドスクリーナーインジケーターを使用して、ここで見つけること
Delta Fusion Pro – 日中取引のための高度なオーダーフロー分析 Delta Fusion Pro は MetaTrader 4 用のプロフェッショナル指標で、アグレッシブな注文フローを明らかにし、機関投資家の圧力の強度と方向をリアルタイムで表示します。従来のボリューム指標とは異なり、Ask と Bid のボリューム差(デルタ)を分析し、反転の予測、トレンドの確認、プロフェッショナルな関心ゾーンの特定を可能にします。 主な特徴 インテリジェント自動調整システム 以下に基づき、すべてのパラメータを自動調整: 銘柄タイプ(FX、暗号資産、指数、コモディティ、株式) 運用タイムフレーム 市場のボラティリティ(ATR) 最近の平均ボリューム 初心者トレーダー向けに手動設定不要 — インジケーターが自動でキャリブレーション! 機能概要 NetDelta と累積デルタ Ask/Bid のアグレッシブボリューム差を計算、カスタマイズ可能な EMA スムージング リアルタイムで方向性圧力を表示 ヒストグラムの色をカスタマイズ(買い/売り) 価格/ボリュームのダイバージェンス 通常お
現在40%オフ! 初心者やエキスパートトレーダーに最適なソリューション! このインジケータは、独自の機能と秘密の数式を組み込んだ、ユニークで高品質かつ手頃な価格のトレーディングツールです。たった1枚のチャートで28の通貨ペアのアラートを表示します。新しいトレンドやスキャルピングチャンスの引き金となるポイントを正確に把握することができるので、あなたのトレードがどのように改善されるか想像してみてください! 新しい基本的なアルゴリズムに基づいて構築されているため、潜在的な取引の特定と確認がより簡単になります。これは、通貨の強さや弱さが加速しているかどうかをグラフィカルに表示し、その加速のスピードを測定するためです。加速すると物事は明らかに速く進みますが、これはFX市場でも同じです。つまり、反対方向に加速している通貨をペアにすれば、利益を生む可能性のある取引を特定することができるのです。 通貨の勢いを示す縦の線と矢印は、あなたの取引の指針となるでしょう。 ダイナミックマーケットフィボナッチ23レベルはアラートトリガーとして使用され、市場の動きに適応します。もしインパルスが黄色のトリガ
Send us a message after your purchase to receive more information on how to get your  BONUS  for FREE  that works in great combination with Bull vs Bear ! Bull versus Bear is an easy-to-use Forex indicator that gives traders clear and accurate signals based on clear trend retests . Forget about lagging indicators or staring at charts for hours because  Bull vs Bear provides real-time entries with no lag and no repaint, so you can trade with confidence. Bull vs Bear  helps you enter trades during
Gold PL MTF - これは優れた株式テクニカル指標です。指標アルゴリズムは、資産価格の動きを分析し、フィボナッチ法 (黄金比) を使用して、指定された時間枠 (TF) の重要なピボット レベルを自動的に反映します。 指標は、選択した時間枠 (日、週、月、年) の価格軌道を完全に表し、トレンドの開始と、逆のトレンドに発展する可能性のある修正の開始を決定します。 指標はまた、価格マグネットとして機能する、さまざまな時間枠の現在の未処理のピボット レベルを表示します。これにより、市場の状況をすばやく評価し、取引の開始または終了を決定できます。各取引の潜在的可能性は、平均 50 ~ 1000 ポイントです。 指標を使用すると、さまざまな時間枠での価格変動の可能性のある方向を評価でき、最も可能性の高いターゲットと価格変動の可能性も示します。 指標の利点: 1. 指標は、高精度で信号を生成します。 2. ピボット レベルは消えず、再描画されません。FPバッファーの確認された矢印シグナルは、トレンドが強い場合にのみ再構築できます。 3. どのブローカーのMetaTrader 4取引
作者のその他のプロダクト
Introducing   Trade Vantage : Professional Market Analyst Trade Vantage   is a highly effective analytical tool that uses a specialized algorithm for trading on the Forex and cryptocurrency markets. Its operating principle is based on price analysis for a certain time interval, identifying the strength and amplitude of price movements using a unique indication system. When a trend loses its strength and changes direction, the expert closes the previous position and opens a new one. The bot also
The Hrum indicator was created to neutralize temporary pauses and rollbacks. It analyzes price behavior and, if there is a temporary weakness in the trend, you can notice this from the indicator readings, as in the case of a pronounced change in trend direction. Entering the market is not difficult, but staying in it is much more difficult. With the Giordano Bruno indicator and its unique trend line, staying on trend will become much easier! Every rise and every fall is reflected in your emoti
Trend Anthropoid is a trend indicator that allows you to effectively determine the direction of the current trend, as well as identify potential reversal points. The indicator makes it possible to classify the direction of price movement by determining its strength. Solving this problem helps to enter the market on time and get the desired result. Let's start with the benefits. Allows you to determine the current trend. You can quickly understand which trend is currently developing in the mark
The Trend Goblin indicator identifies the mainstream trend. They help to analyze the market on a selected time frame. Easy to set up and works on all pairs and all time frames. Trend indicators provide an opportunity to classify the direction of price movement by determining its strength. Solving this problem helps investors enter the market on time and get good returns. It is extremely important for any trader to correctly determine the direction and strength of the trend movement. Unfortunat
Индикатор Adapter определяет господствующую тенденцию, помогает анализировать рынок на выбранном временном интервале. Прост в настройке и работает на всех парах и всех временных интервалах. Индикаторы тренда дают возможность классифицировать направление ценового движения, определив его силу. Решение этой проблемы помогает инвесторам вовремя войти в рынок и получить хорошую отдачу. Для любого трейдера крайне важно правильно определить направление и силу трендового движения. К сожалению, единств
The Analytical Trend indicator can track sustained price movement in a specific direction. In this case, the movement itself can be downward, upward or sideways, when the market movement does not have a pronounced direction. The indicator works on the basis of two moving averages and an oscillator. Using the signal search algorithm, the indicator generates signals in the form of arrows. Flexible settings allow you to receive more accurate signals for opening positions. You can quickly understan
The Supernatural channel is determined using a special algorithm, marker points are used to determine the movement of the channel. The Supernatural channel consists of two lines, red and blue, that make up the channel. Simple, visual and efficient use. Can be used for intra-channel trading. The indicator does not redraw and does not lag. Works on all currency pairs and on all timeframes.
Channel Oscillations is a non-redrawing channel indicator based on moving averages. The key difference between the Channel Oscillations indicator and other channel indicators is that Channel Oscillations does not take into account simple moving averages, but double-smoothed ones, which, on the one hand, makes it possible to more clearly determine the market movement, and on the other hand, makes the indicator less sensitive.
Introducing the Diogenes trend indicator! The indicator analyzes market dynamics for pivot points. Shows favorable moments for entering the market in stripes. The principle of operation of the indicator is to automatically determine the current state of the market when placed on a chart. Ready-made trading system. Can be used as a channel indicator or level indicator! This indicator allows you to analyze historical data and, based on them, display instructions for the trader for further action
The Trend Champion indicator works on all timeframes and currency pairs. The indicator should be used as an auxiliary tool for technical analysis, it helps to determine the direction of the trend: either upward or downward price movement for a particular currency pair. Can be used along with oscillators as filters. Trend Champion is a trend indicator. Arrows indicate favorable moments and directions for entering the market. The indicator can be used both for pipsing on small periods and for lo
The Qubit Trend indicator works using the cyclical-wave dependence function. Thus, all entry points will be optimal points at which movement changes. Entry points should be used as potential market reversal points. The default indicator settings are quite effective most of the time. You can customize them based on your needs. But do not forget that the approach must be complex, the indicator signals require additional information to enter the market.
The regression channel is one of the most popular technical analysis tools among traders. First, the indicator draws a trend line between two points, then on its basis it builds a channel of two parallel lines, which will be at the same distance from the regression line. The term linear regression belongs to the field of statistics. The center line of the channel is the trend line. To calculate it, the least squares method is used. The line above the center line acts as resistance for the pric
Control Shot - Unique indicator for identifying trends. The new system adapts to the market, eliminates additional conditions and copes with its task. A revolutionary new way to identify the start of a trend early. The trend indicator, shows signals, can be used with an optimal risk ratio. It uses reliable algorithms in its calculations. Shows favorable moments for entering the market with arrows, that is, using the indicator is quite simple. Tired of adjusting the indicator settings, wasting
Planned transition is a trend indicator that will help a trader to determine the direction of trade. The indicator has a complex algorithm of work. But for the user, only two lines remain, the red line indicates a sell trend, and the blue line indicates a buy trend. Thus, it is quite simple to interpret the indicator signals. The indicator works on different timeframes; to work with lower timeframes, it is recommended to decrease the indicator period for more frequent entries. To work on higher
Modify Trend - Unique indicator for identifying trends. The indicator has a complex algorithm of work. But for the user there are only two colors of arrows, red indicates a sell trend, blue indicates a buy trend. Thus, it is quite easy to interpret the indicator signals. The indicator works on different timeframes; to work with lower timeframes, it is recommended to decrease the indicator period for more frequent entries. To work on higher timeframes, on the contrary, increase. The new system ad
Just download the Quarter Strike indicator and embrace your dream. Trading within the volatility range has always attracted traders, because most often it is simple instruments that turn out to be the most profitable. The Quarter Strike indicator is a variant of constructing a price channel that gives signals of sufficiently high accuracy on any instruments and time periods. Bias or other additional parameters are not applied, that is, the indicator evaluates only the real dynamics. By default
The Trinity indicator will tell you whether you have configured the indicator correctly, while you can specify the history interval in the bars that interests you. Look at the numbers on the chart near the arrows! These are pips of profit from a series of entries on the indicator. Profit pips are calculated at the specified interval. The signal can be read without any problems by any bot. Trading within the volatility range has always attracted traders, because most often it is simple instrumen
The SPV indicator clearly reflects the cyclical nature of the market. Just one key setting! If it is equal to one, then a fast cycle is displayed, but if, for example, the parameter is 12, then the indicator looks for a cycle in the last 12 bars. You can see the ups and downs of the indicator alternate and have such dependence on the market, which can be used to draw conclusions to predict price behavior. Also, indicators can be combined with each other. Also, the indicator can indicate the qual
The SPV Cross indicator is based on the SPV  indicator. Works as two indicators together on the same chart. With different settings, you can react to the intersection of lines. Clearly reflects the cyclical nature of the market. Just two key settings! It works on the basis of the principle - one is fast and the other is slow. You can see the ups and downs of the indicator alternate and have such a relationship with the market, which can be used to draw conclusions to predict price behavior. The
The SPV Corr indicator displays the average percentage correlation between the bar's body and its shadows. A very effective system for building various filters and market entry confirmations. It fixes cyclicality and can be used in trading in different ways. You can see the ups and downs of the indicator alternate and have such a relationship with the market, which can be used to draw conclusions to predict price behavior. Also, indicators can be combined with each other. The value of the indica
The SPV Body indicator displays the average analysis of the intersection of adjacent bars. The indicator can easily detect unusual market movements which can be used as a filter. For clarity, poke the graphs to the very beginning of the history when the bars were incomplete, and the indicator will easily display this anamaly. A very effective system for building various filters and confirmations of market entry, to exclude anomalies from trading. It also fixes cyclicity, it turns out that the in
The SPV Volatility indicator is one of the most effective filters. Volatility filter. Shows three volatility options. The so-called limit, real, and the last most effective filter for the filter is the percentage filter. Percentage display of folatility shows the ratio of limit to real volatility. And thus, if we trade in the middle of the channel, then it is necessary to set a condition that the percentage is less than a certain indicator value. If we trade on the channel breakout - following t
Mastodon - displays potential market entry points. According to the wave theory, Mastodon displays the course of a large wave, while the oscillator can specify the entry point, that is, catch the price movement inside it, i.e. small “subwaves”. By correctly understanding the wave nature of price movements and using the Mastodon indicator in conjunction with an oscillator, you can create your own trading system, for example, entering the market after a large wave has formed and then exiting whe
The advantage of working with the Gladiator signal indicator is that the trader does not need to conduct technical analysis of the chart on his own. The tool generates ready-made signals in the form of directional arrows. The indicator is considered effective as it does not redraw its signals. This tool is an arrow (signal) one and works without redrawing. Its signals are based on a robust algorithm. Gladiator does not change its readings. Daily and session ranges can be useful for confirming
Signal Casablanca - Arrow technical indicator in the Forex market without redrawing. Able to give hints with minimal errors. It combines several filters, displaying market entry points with arrows on the chart. You can note the accuracy and clarity of the signals of this pointer indicator. Having seen a signal to buy, a trader opens an order without expecting that after a while the initial hint may change to the completely opposite one or simply disappear, having lost its relevance. The signal w
Fargo does not change its readings, it is a technical indicator in the Forex market without redrawing. It combines several filters to display market entry arrows on the chart. You can note the accuracy and clarity of the signals of this pointer indicator. When a suitable moment for buying appears, the indicator generates a signal exactly at the moment of its appearance and not below or above the current candle. The arrow will be exactly at the price where the signal appears and will not change
Trend Expert. It works by entering the market with only one buy order and another sell order. It does not form a series of rendering, and therefore you can work with them starting from $ 100! Which is great for beginners. To enter, it uses a system of indicators and a system of dynamic correction of stops depending on volatility, which can be disabled in the settings, but in this case, you will significantly reduce the efficiency of the bot. The bot implements a money management system, which c
Catch is a reversal indicator and is part of a special category of instruments. it not only analyzes the price movement, but also indicates the points of possible reversals. This facilitates fast and optimal opening of buy or sell orders (depending on the current situation). In this case, the historical data of the analyzed asset must be taken into account. It is the correct execution of such actions that largely helps traders to make the right decision in time and get a profit.
The Matios indicator visually unloads the price chart and saves analysis time: no signal - no deal, if an opposite signal appears, then the current deal should be closed. This is an arrow indicator for determining the trend. According to the wave theory, Matios displays the course of the wave, while the oscillator can specify the entry point, that is, catch the price movement inside it, i.e. small “subwaves”. By correctly understanding the wave nature of price movements and using the Matios in
Sting implements indicator technical analysis and allows you to determine the state of the market in the current period and make a decision on a deal based on certain signals. Sting is the result of mathematical calculations based on data on prices and trading volumes. Sting creates signals to perform operations on strong trend movements; it is more expedient to use it for trading when the trend is weakening or sideways. It is used as an additional one, regardless of the phase of the trend mov
フィルタ:
レビューなし
レビューに返信