Rounded top or bottom MT5
- インディケータ
-
Dmitry Fedoseev
 Новый вариант эксперта exp_iCustom - exp_iCustomNew в маркете: https://www.mql5.com/ru/market/product/5660
 - バージョン: 1.2
- アップデート済み: 25 7月 2021
- アクティベーション: 5
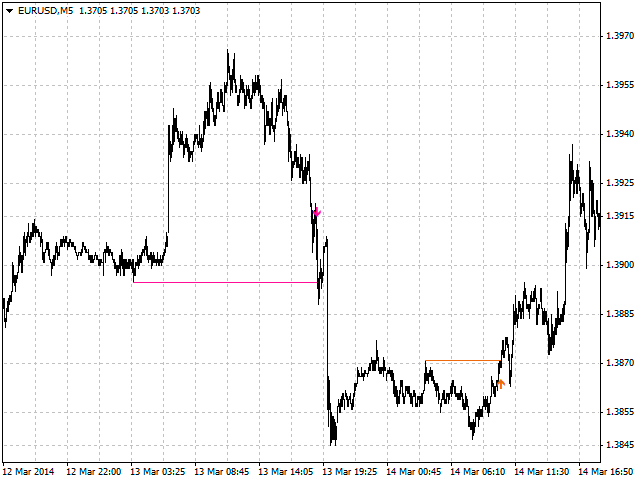
An indicator of patterns #39 and #40 ("Rounding Tops" and "Rounding Bottoms") from Encyclopedia of Chart Patterns by Thomas N. Bulkowski.
Parameters:
- Alerts - show alert when an arrow appears
- Push - send a push notification when an arrow appears (requires configuration in the terminal)
- PeriodBars - indicator period
- K - an additional parameter that influences the accuracy of pattern shape recognition. Changes from 0 to 1
- ArrowType - a symbol from 1 to 17
- ArrowVShift - vertical shift of arrows in pixels
- ShowLevels - show levels
- ColUp - color of arrow up
- СolDn - color of arrow down
Note. Arrows appear at the opening of a new bar based on analysis of formed bars and do not disappear.
It cannot be guaranteed that the indicator recognizes the patterns exactly as implied by the author.
Recommended optimization parameters: PeriodBars, K.