Divergence Notification
- インディケータ
-
Edson Cavalca Junior
 Systems developer for over 30 years. Currently developing financial products for the Metatrader platform.
Site:
https://tinosangue.com.br
Youtube: Aprender a Investir - バージョン: 1.40
- アップデート済み: 3 6月 2021
- アクティベーション: 10
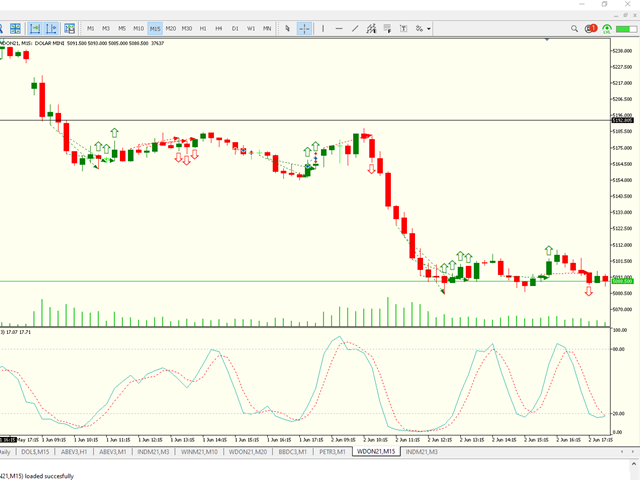
This indicator plots in the candles the divergence found in the selected indicator and can also send a notification by email and / or to the cell phone.
- Works on all TIMEFRAMES.
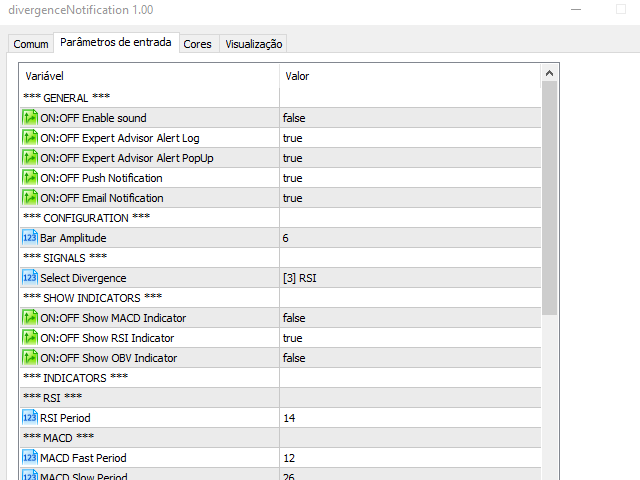
He identifies the divergences in the indicators:
- Relative Strength Index (RSI);
- Moving Average Convergence and Divergence (MACD);
- Volume Balance (OBV) and;.
- iStochastic
Stochastic Oscillator (STOCHASTIC).
It is possible to choose the amplitude for checking the divergence and the indicator has to be used.
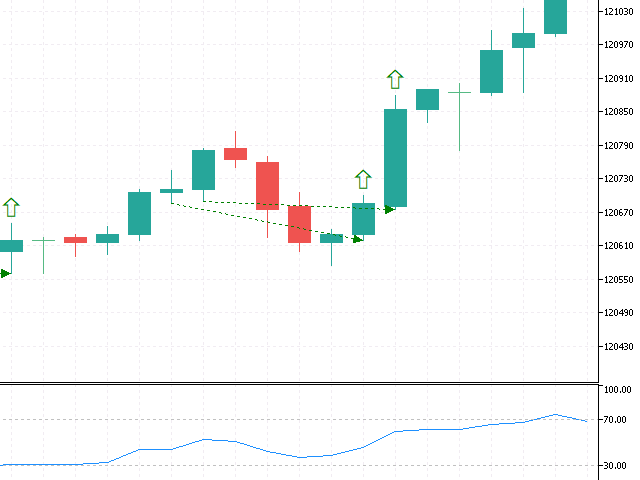
There are 2 types of divergence:
- Bullish Market and;
- Bearish Market.
At Bullish Market the indicator is increasing in value and in contrast the lower price of the candle is decreasing.
In the Bearish Market the indicator is decreasing its value and in contrast the higher price of the candle is increasing.
If you have any questions about the indicators, parameters, signals, join our telegram group:
If you want to learn more about indicators, expert advisor, etc. join our channel:
Follow us on website:
Edson Cavalca Junior
System Analyst