• 概要
  • レビュー
  • コメント

One True Interface

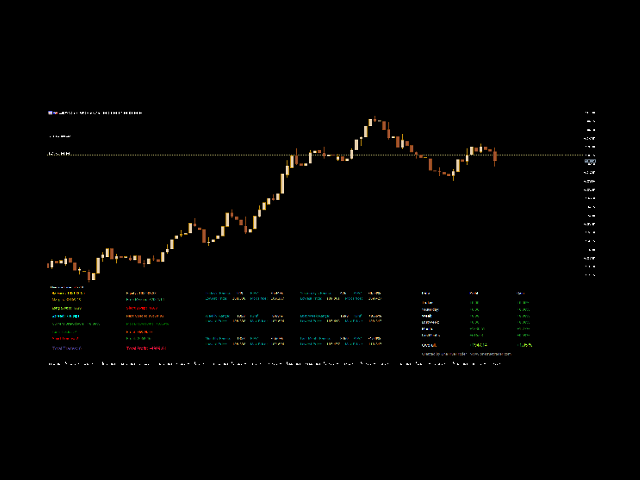
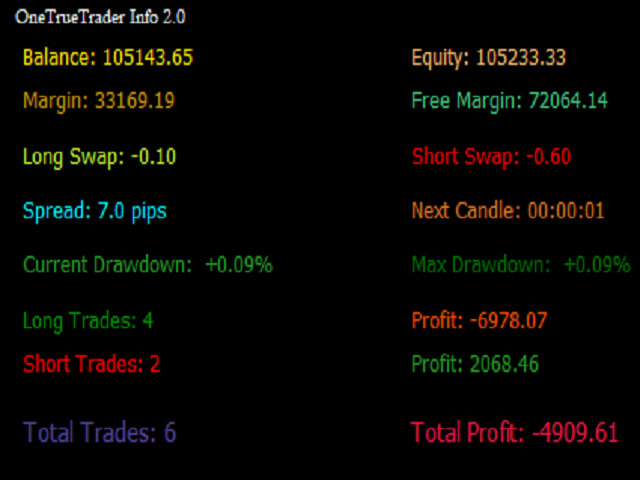
Complete indicator that collects all results from your MT5 trading account.

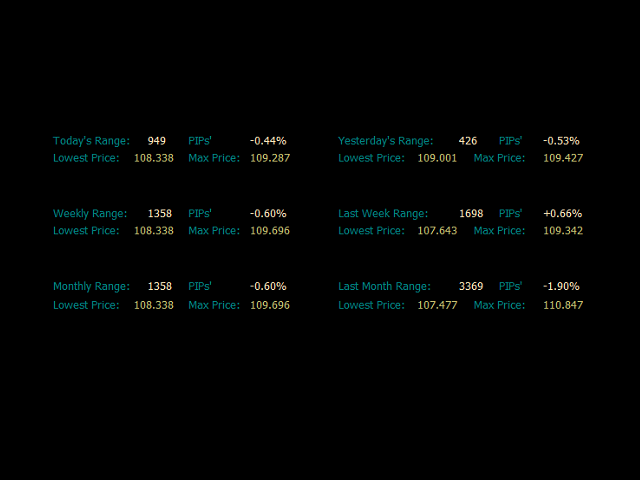
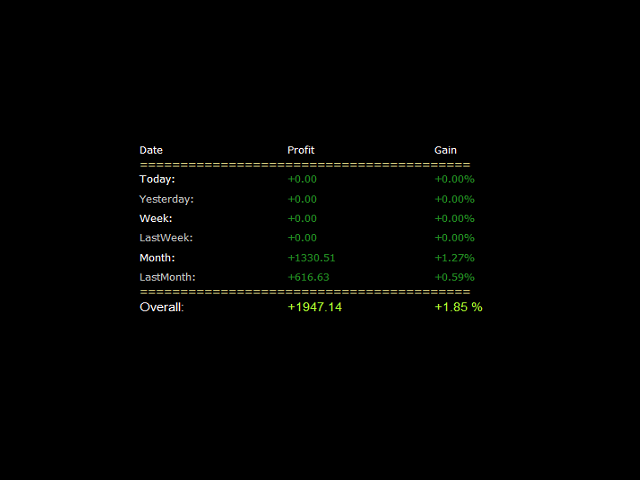
It aggregates your past trading performance, displays historical price ranges.

It also shows key market information, like swaps, current market spread on chosen instrument, floating P&L, number of trades, drowdown etc.

Check out the below video presentation.


If you are interested in more of my products, do not hesitate to PM me.


おすすめのプロダクト
Looking for reliable levels on a price chart? Already tired of searching for similar indicators? Are the levels not working out as they should? Then this is the indicator for you. Volume Prices Universal is a reliable indicator of horizontal volumes. What does it show? First of all, the main idea of ​​the indicator is to display at which price mark the price has been for the longest time. Thus, the display of price volumes on the price chart is formed. With the help of which you can very simp
Unlike any indicator you’ve seen, Trend Volley is an advanced purpose-built trend trading charting system that has been successfully used in nearly every tradable market. It is unique in many ways. Trend Volley’s internal trend detector algorithm studies the market and dynamically chooses the right values for the internal parameters, to adapt to the price and to decrease consecutive trend failures. It can be applied to any financial assets:  forex, cryptocurrencies, metals, stocks, indices.  ITS
Big Player Range
Thalles Nascimento De Carvalho
5 (2)
「BigPlayerRange」インジケーターへようこそ。これは金融機関が市場で示す重要なエリアを特定するために開発されたテクニカル分析ツールです。このインジケーターは、主要な市場参加者が相当な活動と興味を示す価格範囲を正確に分析します。 主な特徴: 1. 金融機関の関心エリアのマッピング:「BigPlayerRange」は金融機関が強い活動を示すチャート上のエリアを正確に強調表示します。これらのポイントは戦略的に重要であり、市場の将来の動きについての洞察を提供します。 2. 出口の基準としてのプロジェクション:関心のあるエリアを特定するだけでなく、このインジケーターはプロジェクションを使用して可能な出口の基準としています。これらのプロジェクションは市場が将来どの方向に動くかに基づいて戦略を計画するのに役立ちます。 3. 識別された範囲に戻るときの引き戻しの確率:「BigPlayerRange」のユニークな機能の1つは、価格が関心のある範囲に戻ったときの引き戻しの確率を計算できることです。これは潜在的なトレンドの反転を評価するのに役立ちます。 「BigPl
HAshi-EはHeiken-Ashiシグナルを分析する強化された方法です。 説明 HAshi-Eは、Heiken-Ashiシグナルを分析するための強化された方法です。HAshi-Eは、Heiken-Ashiシグナルを分析するための強化された方法です。HAshi-Eは、Heiken-Ashiシグナルを分析するための強化された方法です。伝統的なローソク足チャートとは異なり、ヒーケンアシのローソク足は過去のバーの平均値を使って計算されるため、よりスムーズで解釈しやすい視覚的表現が可能です。 その主な利点は、ほとんどの人が本来の読み方をしない理由でもあります。Heiken-Ashiローソク足には平均値に関する情報が含まれており、通常、資産ローソク足の前に配置されているため、色や形に惑わされ、不適切な時間帯や遅い時間帯にエントリーやエグジットを行う人をよく見かける。 HAshi-Eは、伝統的なHeiken-Ashiインジケータの改良版です! HAshi-E(チャート版)の特徴: 同じデータを異なる角度から見る HAshi-Eは、伝統的なHeiken-Ashiローソク足だけでな
Forex Relative Performance indicator This indicator calculates the relative strength of major currencies against the US dollar. The basic idea behind this indicator is "to buy strong currency and to sell weak currency". This indicator allows you to quickly identify the best forex pair to trade according to your trading style (Intraday, Scalping, Swing, or Long Term)
MT4版  |  FAQ Owl Smart Levels Indicator は、 Bill Williams の高度なフラクタル、市場の正しい波構造を構築する Valable ZigZag、エントリの正確なレベルをマークする Fibonacci レベルなどの一般的な市場分析ツールを含む 1 つのインジケーター内の完全な取引システムです。 利益を得るために市場と場所に。 戦略の詳細な説明 インジケータを操作するための指示 顧問-取引助手 プライベートユーザーチャット ->購入後に私に書いて、私はプライベートチャットにあなたを追加し、あなたはそこにすべてのボーナスをダウンロードすることができます 力はシンプルさにあります! Owl Smart Levels 取引システムは非常に使いやすいので、専門家にも、市場を勉強し始めて自分で取引戦略を選択し始めたばかりの人にも適しています。 戦略と指標に秘密の数式や計算方法が隠されているわけではなく、すべての戦略指標は公開されています。 Owl Smart Levels を使用すると、取引を開始するためのシグナルをすばやく確認し、注文を出すため
Bober Real MT5
Arnold Bobrinskii
4.76 (17)
Bober Real MT5 is a fully automatic Forex trading Expert Advisor. This robot was made in 2014 year and did a lot of profitbale trades during this period. So far over 7000% growth on my personal account. There was many updates but 2019 update is the best one. The robot can run on any instrument, but the results are better with EURGBP, GBPUSD, on the M5 timeframe. Robot doesn't show good results in tester or live account if you run incorrect sets. Set files for Live accounts availible only for c
Airplane   Trend   entry points should be used as potential market reversal points. The indicator works using the cyclic-wave dependence function. Thus, all entry points will be optimal points where the movement changes. The simplest way to use the indicator is to open a trade in the direction of an existing trend. The best result is obtained by combining the indicator with fundamental news, it can act as a news filter, that is, it can show how the market reacts to this or that news. The de
Advanced 4xZeovo MT5 Indicator (MetaTrader 5)   Product Description  4xZeovo is a powerful trading indicator system monitoring 24/7 financial markets. Metatrader5 tool designed to find the best buying/selling opportunities and notifies the user.    Making life easy for traders in helping with the two most difficult decisions with the use of advanced innovate trading indicators aiming to encourage users to hold the winning positions and take profit at the best times.    Equipped with a unique tra
Heiken Ashi Smoothed Strategy is a very simple but powerful system to get forex market trend direction. This indicator is actually 2 indicators in 1 pack, Heiken Ashi and Heiken Ashi Smoothed Moving Average both included. Because HA (Heiken Ashi) and HAS (Heiken Ashi Smoothed) are calculated in the same one system event with necessary buffers and loop only, so it is the FAST, OPTIMIZED and EFFICIENT HA having the combined indicator of MetaTrader 5. You can choose to display HA and HAS in the sam
プレミアムレベルは、正しい予測の精度が80%を超える独自の指標です。 この指標は、最高のトレーディングスペシャリストによって2か月以上テストされています。 あなたが他のどこにも見つけられない作者の指標! スクリーンショットから、このツールの正確さを自分で確認できます。 1は、1キャンドルの有効期限を持つバイナリーオプションの取引に最適です。 2はすべての通貨ペア、株式、商品、暗号通貨で機能します 手順: 赤い矢印が表示されたらすぐにダウントレードを開き、青い矢印が表示されたら閉じます。青い矢印の後に開くこともできます。 試してテストしてください!推奨設定はデフォルトです! 日足チャートで最高の精度を示します! インディケータは、2600 Pipsの収益性に対して、約10Pipsという非常に小さなマージンを使用します。
Forex Workstation is a powerful and efficient bot for trading on the Forex market. It is designed to use patterns, price delay levels, volatility analysis and market scaling. This bot provides unique opportunities for automated trading and optimization of strategies on various currency pairs. Let's look at the features and settings of Forex Workstation: Peculiarities: Multi-currency : Forex Workstation supports a wide range of currency pairs for trading, which allows you to diversify your por
Scalper Pivot detects respectable small reversal areas that can be used to mark repeatable opportunity windows. Originally made for M1 timeframe. Setup/inputs: First, set one pip on price, e.g. EURUSD to 0.0001, USDJPY to 0.01, or XAUUSD to 0.1. Set minimum and maximum range on pips, if you want scalp between 10 to 20 pips then set it to 10 and 20 respectively. Set detection window to any candle count you want. Set it too low or too high would be less accurate.
Exp TickSniper PRO FULL
Vladislav Andruschenko
4.04 (51)
Exp-TickSniper- 各通貨ペアのパラメーターを自動的に自動選択する高速ティックスカルパー。 取引パラメータを自動的に計算するアドバイザーを夢見ていますか?自動的に最適化および調整されますか? MetaTrader4のシステムのフルバージョン:       MetaTrader4用の TickSniper   スカルパー TickSniper-完全な説明     +デモ+ PDF EAは、ほぼ10年間のEAプログラミングで得られた経験に基づいて開発されました。 EA戦略はどのシンボルでも機能します。 時間枠は関係ありません。 ロボットは、現在の相場、ティックの到着速度、スプレッドサイズ、およびその他の契約仕様パラメーターに基づいています。 システムは、有利なストップロスとテイクプロフィットレベル、平均ポジションの距離、トレーリングストップ距離などを自動的に定義します。 EAは、トレンドに対して追加のオープニングのシステムを適用します(「平均化」)。 その設定は、実際のアカウントでテストするために最適化されています。 Expert Advisorは、絶対にすべての通貨ペ
Advanced Support and Resistance Support and resistance levels are widely used in trading. They are important as they show some key price levels. Before applying any strategy, one may consider it necessary to draw support and resistance. However, this process can take much time especially if one is to analyse a lot of currency pairs, commodities or indices. This Advanced Support and Resistance tool was designed for traders at any level, amateur to professional. It plots key support and resistance
Daily Pivots Multi Indicator Daily Pivots Multi is an exclusive indicator to draw your pivots levels and much more. Most indicators draw daily pivots for the day. Daily Pivots Multi is able to draw levels for different days. The indicator can do the calculation for unlimited number of days backward. It means that you can draw the levels for today but also for the past days. This is very useful if you want to study a strategy with Pivots levels over a period of time. Another problem is th
HAshi-EはHeiken-Ashiシグナルを分析するための強化された方法です。 説明 HAshi-Eは、Heiken-Ashiシグナルを分析するための強化された方法です。HAshi-Eは、Heiken-Ashiシグナルを分析するための強化された方法です。HAshi-Eは、Heiken-Ashiシグナルを分析するための強化された方法です。伝統的なローソク足チャートとは異なり、ヒーケンアシのローソク足は過去のバーの平均値を使って計算されるため、よりスムーズで解釈しやすい視覚的表現が可能です。 その主な利点は、ほとんどの人が本来の読み方をしない理由でもあります。HAshiローソク足には平均値に関する情報が含まれており、通常、資産ローソク足の前に配置されているため、色や形に惑わされ、不適切な時間帯や遅い時間帯にエントリーやエグジットを行う人をよく見かけます。 このような背景から、HAshi-Eは従来のHeiken-Ashiインジケータの改良版です! HAshi-E(別ウィンドウ版)の特徴: 同じデータを様々な角度から見る: HAshi-Eは伝統的なローソク足だけでなく
The standard Bollinger Bands indicator has been improved by integrating additional indications from the Standard Deviation indicator (StdDev), which gives an additional filter for confirming trading signals. In addition, the color of the indicator's lines shows the beginning of a trend, its development and exhaustion. This indicator has a signal block that notifies the trader of the beginning of the trend on any time frame to which it is attached. Settings Type of messages - select the type of
革新的な MT5 インジケーター、DARWIN Assistant   をご紹介します。これは、トレーディングを成功させる世界への究極のゲートウェイです。精度と専門知識に基づいて設計された DARWIN Assistant   は、RSI、ストキャスティクス、CCI、トレンドなどの高度なテクニカル指標をすべての時間枠にわたって活用する特別な戦略に基づいて動作します。この最先端のインジケーターはエントリーのための最も正確なシグナルを提供し、比類のない自信を持って市場をナビゲートできるようにするため、並外れた取引体験に備えてください。 DARWIN Assistant   を使用すると、最も収益性の高い取引機会を検出するために細心の注意を払って調整された、重要な指標の包括的な分析にアクセスできるようになります。不確実性に別れを告げ、情報に基づいた意思決定の新時代を迎えましょう。 RSI、ストキャスティクス、CCI、トレンドを DARWIN Assistant   内でシームレスに統合することでその力を解き放ち、これまでにないほど市場のダイナミクスを鮮明に描きます。 DARWIN
トレンドラインは、外国為替取引におけるテクニカル分析の最も重要なツールです。残念ながら、ほとんどのトレーダーはそれらを正しく描画していません。自動トレンドラインインジケーターは、市場のトレンドの動きを視覚化するのに役立つ本格的なトレーダー向けのプロフェッショナルツールです。 トレンドラインには、強気トレンドラインと弱気トレンドラインの2種類があります。 上昇トレンドでは、外国為替トレンドラインは価格変動の最低スイングポイントを介して描画されます。 少なくとも2つの「最低安値」を接続すると、トレンドラインが作成されます。 下降トレンドでは、トレンドラインは価格変動の最も高いスイングポイントを介して描画されます。 少なくとも2つの「最高値」を接続すると、トレンドラインが作成されます。 トレンドラインが壊れたとき? 弱気のろうそくが強気のトレンドラインの下で閉じ、ろうそくの高さがトレンドラインの上にあるとき、強気のトレンドラインは壊れます。 強気のろうそくが弱気のトレンドラインの上で閉じ、ろうそくの安値がトレンドラインの下にあるとき、弱気のトレ
The indicator is designed to work on any trading platform. The program is based on proprietary algorithms and W.D.Ganna's mathematics, allowing you to calculate target levels of price movement based on three points with the highest degree of certainty. It is a great tool for stock trading. The indicator has three buttons: NEW - call up a triangle for calculation. DEL - delete the selected triangle. DELS - completely remove all constructions. The probability of achieving the goals is more than 80
NET Z uses a very well-known trend reversal technique to determine position entry with slight modifications by using virtual trade techniques and virtual pending orders so that position entry is not too early or too late. Why NETZ? NET Z does not require complicated settings and is easy to use because user only need to upload a set file that is already available. Currently there are set files for 20 fx pairs. The best GRID EA with the ability to control risks. I will share my personal daily r
A Média Móvel é um indicador que faz parte da Análise Técnica. Com ela, é possível identificar o equilíbrio dos preços no mercado, observando tendências de alta, neutra ou baixa. Este indicador customizado traz opções extras pera definir o método de cálculo podendo-se esclolher entre SMA,EMA,SSMA,LWMA,JJMA,JurX,ParMA,T3,Vidya,AMA,HULL MA. Também conta com varias opções para escolher o método de cálculo para o preço base a ser usado no cáculo da média.
Trend Direction ADX indicator Trend Direction ADX is part of a serie of indicators used to characterize market conditions. Almost any strategy only work under certain market conditions. Therefore it is important to be able to characterize market conditions at any time: trend direction, trend strength, volatility, etc.. Trend Direction ADX is an indicator to be used to characterize trend direction: trending up trending down ranging Trend Direction ADX is based on ADX standard indicator.
The Trendline Trade Panel was created to make it easier to train forex trading skills in backtester and at the same time make it easier to live trade using trendlines with the push of a button. This ea is perfect for beginners who want to learn to trade manually because all of its features are equipped with basic tools for trading forex. Other uses for Trendline Trade Panel: + Can be used to perform recovering loss positions made by other EA or positions that open manually. Fill in magic number
IVISTscalp5
Vadym Zhukovskyi
5 (3)
iVISTscalp5インジケーターをご紹介します。このインジケーターは、トレーディングにおいて独自でありながら効果的です。時間データに基づくこのインジケーターは、多年にわたる経験と金融市場の深い分析の結果です。iVISTscalp5インジケーターは、手動トレーディングにとって優れたツールです。便利さ、簡単さ、可視化 - すべての複雑さが内部に隠されています。私たちは、iVISTscalp5インジケーターの設定と使用を最大限に簡素化しました。このインジケーターは、MT5ターミナルにあるすべての金融商品に適しています。 稼働時間は、4時から20時(UTC+3)です。 iVISTscalp5インジケーターメニュー(スクリーンショット1を参照): History - 引用を計算する週数 dT_min - 時間間隔の選択(分) TFline - 水平ボリュームの作成(時間枠) BARSline - 水平ボリュームの作成(バー数) TFtrend1 - デイリーチャンネルの作成(時間枠) BARStrend1 - デイリーチャンネルの作成(バー数) TFtrend2 - 週次チャンネルの作成(時
The ChanLun or Chan theory is one of the most popular trading theories in China. But it seems like that it has little influence in western countries. Actually, the Chan Theory is based on a sophisticated mathematical model. The basic idea ChanLun is to simplify the bar chart by its model. With the help of ChanLun, a trader can analyze and predict the trend of future goods, stocks. In ChanLun, there are several basic elements called fractals, strokes, line segments and pivots . A trader should p
The SmartTrendMt5 trend indicator generates signals based on the principle of combined analysis of calculated reference points within the Keltner channel. The indicator plots the Keltner channel in a separate window (by default, red lines and a blue line - the middle of the channel), and also draws the histogram of calculated reference points for each candle (by default, the histogram bars are yellow). The should be attached to a chart of any timeframe and any trading symbol in the usual way.
This indicator identifies and displays zones, as it were areas of strength, where the price will unfold. The indicator can work on any chart, any instrument, at any timeframe. The indicator has two modes. The indicator is equipped with a control panel with buttons for convenience and split into two modes. Manual mode: To work with manual mode, you need to press the NEW button, a segment will appear. This segment is stretched over the movement and the LVL button is pressed. The level is displayed
Robotizz Indicator is a powerful trading indicator using price action and moving averages. Robotizz indicares with arrows on long trades ir short trades, showing some TP and SL points too. It works with any symbol, even on forex markets or B3 Brazilian markets. You can configure moving averages periods, besides simple or exponential moving averages. Also it is possible to configure arrow position. Try Robotizz for one month and take a boost on your manual trades.
このプロダクトを購入した人は以下も購入しています
Professional Scalping Tool on Deriv Attention! The indicator will be sold in limited quantities!!! The previous 5 copies were sold for $250 The next 5 copies will be sold for $350 The next price is $500 Description: This trading indicator is designed for professional traders focused on scalping. Designed with the market in mind, it provides highly accurate spike trading signals. It works on the M1 timeframe and supports the following symbols: Boom 300 Index, Boom 500 Index, Boom 1000 Index,
note: this indicator is for METATRADER4, if you want the version for METATRADER5 this is the link:  https://www.mql5.com/it/market/product/108106 TRENDMAESTRO recognizes a new TREND in the bud, he never makes mistakes. The certainty of identifying a new TREND is priceless. DESCRIPTION TRENDMAESTRO identifies a new TREND in the bud, this indicator examines the volatility, volumes and momentum to identify the moment in which there is an explosion of one or more of these data and therefore the mome
ENG-GOLD Scalper It is an auxiliary indicator that identifies potential targets and determines the place of entry with a stop loss that works on Heiken Ashi candles  The green lines are usually the targets, the red lines are the stop loss, and the yellow lines are the entry location.  This file is recognized on small and medium frames, usually less than the watch frame I highly recommend using XAUUSD US100 US30 USOIL 
RAD CRITICAL LEVES RAD indicator tracks “Relevant Volume” in real time, identifying accumulation and distribution processes, projecting them in the chart as SUPPORT or RESISTANCE zones. Natural   support   and resistance levels are generated by Volume Accumulation and Distribution processes. As these processes evolve, levels at which the relevant volume in the market place is positioned, become difficult areas to cross upwards or downwards. By using this information, traders can identify very s
VTrende Pro
Andrii Diachenko
5 (1)
VTrende Pro - MTF indicator for trend trading with a display panel for MT5 *** Videos can be translated into any language using subtitles (video language - Russian) Although the signals of the VTrende Pro indicator can be used as signals of a full-fledged trading system, it is recommended to use them in conjunction with the Bill Williams TS. VTrende Pro is an extended version of the VTrende indicator. Difference between Pro version and VTrende: - Time zones - Signal V - signal 1-2 waves
Weis Wave with Alert MT5
Trade The Volume Waves Single Member P.C.
4.93 (15)
Rental/Lifetime Package Options and Privileges  * For optimum results the yearly or lifetime package is suggested due to live training ! Rent Monthly Six Months   Yearly/Lifetime Weis Wave with Speed with Alert+Speed Index x x x Manual  x x x Quick Set up Video x x x Blog x x x Lifetime Updates x x x Setup and Training Material x x Free Rectangle Break Alert Tool      x Discord Access Channel "The SI traders" x 2-hour live methodology training x How to trade with it:    http://
The indicator is designed to close positions on the market in time. For example: to take profits ahead of schedule if the price has not reached TakeProfit, and the market is turning around. The indicator analyzes the momentum, not the trend. He does not give any information about the trend. The indicator is well suited for finding divergence. The Ershov 38 Parrots indicator dynamically adjusts to the market and detects price movement impulses of medium and high amplitude. It almost does not rea
Tatino Super Signals is Non Repaint Indicator for Binary Option trading and Forex trading. Recommendations: Timeframe: All timeframes. For best results we recommend using it on M1, M5 and M15 timeframes. Currency pairs: All Pairs Account type: All Type Broker time: Any Brokers : Alls Binary Trading : Expired 1 Candle Buffer Buy=1, Sell=0, Entry Next Candle Recommended Forex trading stop loss : 15 pips Recommended  Forex tradingTake profit levels : 15 pips Specifications: Does not repaint  
The Smooth Price technical indicator is used for plotting a smoothed line as close to the price of the financial instrument as possible, and serves to eliminate its noise components. The indicator is part of the Monarch trading system, but here it is presented as an independent technical analysis tool. The indicator is based on the cluster digital filter , which, unlike the ClusterSMA , is applied directly to the price time series. Smooth Price does not redraw (except the very last, zero bar) an
バイナリ オプションの可能なコールおよびプット エントリを生成する人工知能に基づくインジケーター。 このインジケーターは 3 つの異なる戦略で機能します。 1) 出来高を読み取ることで、価格が反転する時期にシグナルを送信します。 2) 価格と出来高の乖離を通じて、トレンドが継続するか反転するかを知らせます。 3) 価格と出来高の収束を通じて、トレンドが継続すべき時期にシグナルを送信します。 この指標はすべての時間枠で機能しますが、最良の結果は 3 分または 5 分の期限で得られます (制度的な攻撃は短い時間枠で見られるため)。 最も流動性の高い時間帯、つまりグリニッジ標準時 7 時からグリニッジ標準時 18 時までが最適です。 このインジケーターは正しいシグナルの 70% 以上を生成しますが、価格を操作する機関同士の争いに遭遇したり、相互に拒否したりして、一連の誤ったシグナルが生成される可能性があります。そのため、適切な資金管理を使用することをお勧めします (Masaniello の例) )
Teniendo una entrada de precios suavizados, los cuales son procesador por un ZigZag en tiempo real, dando como resultado un suavizador ajustado a un ZigZag. Con valores de entrada (periodo) mayores se vuelve un poco lenta en M1,, Ideal para H1, H4, D1 Trabaja bien con otros suavizadores, ya que su intersección es ideal Al iniciar empiza con mayor precisión desde el momento de activación, siendo el historial (anterior) de referencia ----------------------------------------------------------------
Super Suavizador
Cesar Juan Flores Navarro
Indicador en MQL5 que obtiene el promedio de 10 EMAS que son alineadas y procesadas según Fibonacci luego el promedio es suavizado"  Se ingresa un número de 2 a N que multiplica los EMA-Fibonacci y por consiguiente aumenta los fibonacci, resultando un promedio.   Se ingresa un número que suaviza los EMA-Fibonacci. Considerando los números 1/1 seria la suavización minima. Considerando los números 3/5 seria la suavización media. Considerando los números 10/30 seria la suavización alta.....etc
A scalping indicator based on mathematical patterns, which on average gives signals with relatively small SL, and also occasionally helps to catch big moves in the markets (more information in the video) This indicator has three main types of notifications: The first type warns of a possible/upcoming signal on the next bar The second type indicates the presence of a ready signal to enter the market/open a position The third type is for SL and TP levels - you will be notified every time price r
Классификатор силы тренда. Показания на истории не меняет. Изменяется классификация только незакрытого бара. По идее подобен полной системе ASCTrend, сигнальный модуль которой, точнее его аппроксимация в несколько "урезанном" виде, есть в свободном доступе, а также в терминале как сигнальный индикатор SilverTrend . Точной копией системы ASCTrend не является. Работает на всех инструментах и всех временных диапазонах. Индикатор использует несколько некоррелируемых между собой алгоритмов для класси
Currency Index Watcher is a simple and user-friendly tool for whoever wish to trade Forex using currencies indexes. Currency Index Watcher is configurable and usable directly from the panel. Indexes of 8 custom currencies EUR, USD, GBP, JPY, CHF, AUD, CAD, NZD (default) Any 3-chars symbol from your market watch could be used (BTC = bitcoin, RUB = ruble, CNH = yuan etc ...) : double click the symbol label  Ability to select which currencies and made-of pairs will be analyzed : check/uncheck want
Indicador en base a la pendiente de la linea de precio, dibuja una línea de color cuando sube a base de los precios que previamente has sido procesados o linealizados, y cuando baja la pendiente la linea linealizada toma otro color. En este caso se a considerado 6 lineas de diferentes procesos desde pendientes largas hacia las cortas, observándose que cuando coincidan las pendientes se produce un máximo o mínimo, lo que a simple vista nos permitirá hacer una COMPRA O VENTA.
Индикатор Coefficient Of Determination (COD) представляет собой значение коэффициента детерминации или квадрат коэффициента корреляции между зависимой переменной — ценой и объясняющей переменной — тиковым объемом. Что это дает нам на практике? COD отлично распознает кульминацию трендовых движений, что позволяет подбирать оптимальные точки и ловить развороты рынка. Как использовать индикатор: Наиболее популярная торговая стратегия строится совместно с трендовым индикатором Moving Average (MA), пе
Fibonacci Múltiple 12, utiliza la serie fibonacci plasmado en el indicador fibonacci, aumentadolo 12 veces según su secuencia. El indicador fibonacci normalmente muestra una vez, el presente indicador se mostrara 12 veces empezando el numero que le indique siguiendo la secuencia. Se puede utilizar para ver la tendencia en periodos cortos y largos, de minutos a meses, solo aumentado el numero MULTIPLICA.
Recommended TimeFrame >= H1. 100% Non Repainted at any moment.  Use it carefully, only with Trend Direction. Trading Usage: 2 Variants: as Range System or as BreakOut System (Both Only With Trend Direction)::: (Always use StopLoss for minimise Risk); [1] as Range System: (Recommended) in UP TREND:  - BUY in Blue Line , then if price goes down by 50 points (on H1) open Second BUY.   Close in any Profit you wish: TrailingStop(45 points) or Close when Price touches upper Gold Line. in DOWN TR
En base a cálculos matemáticos de determino una linea Horizontal que cruza a todas las señales de trading, mostrando los máximos y mínimos. La linea horizontal parte en dos las subidas y bajadas de las señales de trading, de tan manera que es fácil identificar los máximos y mínimos, y es inteligente por que es sensible a las subidas y bajadas, afín de no quedarse en un solo lado por siempre, trabaja excelentemente con otros indicadores suavizadores ya que les garantiza que en un intervalo de tie
this indicator is a Spike detector indicator, it is specially designed to trade Boom 1000, Boom 500, Crash 1000 and Crash 500 We recommend using it on Deriv Boom and Crash indices only Its setting is intuitive, familiar, easy to use it has notification functions; audible notifications and push notifications. this tool is simple to use, easy to handle This update is based on different strategies for spikes
Limitless MT5 is a universal indicator suitable for every beginner and experienced trader. works on all currency pairs, cryptocurrencies, raw stocks Limitless MT5 - already configured and does not require additional configuration And now the main thing Why Limitless MT5? 1 complete lack of redrawing 2 two years of testing by the best specialists in trading 3 the accuracy of correct signals exceeds 80% 4 performed well in trading during news releases Trading rules 1 buy signa
Indicador en MQL5, recibe la información del precio SUAVIZADO, lo procesa anulando los picos inteligentemente, y el resultado lo envía al desarrollo de la escalera que iniciara y subirá o bajara según el peldaño o INTERVALO ingresado Ingreso PERIODO = 50 (variar segun uso) Ingreso MULTIPLICA AL PERIODO = 1 (variar segun uso) Segun la configuración la escalera puede pegarse o separarse de los precios,, Se aplica toda la linea de tiempo, y a todas las divisas, etc.  
Indicador en MQL5, que obtiene el promedio de 10 EMAS, que son alineadas según Fibonacci, obteniendo un promedio, que sera suavizado.  Se puede ingresar un numero desde 2 a N, que multiplica a los EMA-Fibonacci. Funciona en cualquier criptomoneda, etc. etc... pudiendo calcular el futuro segun la tendencia de las EMAS. Funciona excelentemente en tramos largos, determinando exactamente el mejor inicio/salida. El precio inicial por apertura sera por un periodo de tiempo, luego aumentará.
Micro  ******************* Секундные графики MT5 ********************** Более точного инструмента для входа в сделку вы не найдёте. Входные параметры: Timeframe, sek - период построения графика, секунды Displayed bars - отображаемые бары Step of price levels, pp, 0-off - шаг отрисовки ценовых уровней, пункты Scale points per bar, 0-off - масштаб в пунктах на бар Show lines - отображение текущих уровней Show comment - отображение комментария Standard color scheme - стандартная цветовая сх
QuantXMarketScanner is a multi assets indicator for MT5 - Mathematical model based on 7 custom moving averages indicators  - Adaptable on Currencies, Stocks and Crypto - Automatic setup, self optimized About QuantXsystem Products: –         Simple installation & integration into MT5   –         Unlimited License after purchase (for one user) –         Automatic pattern recognition to identify the best timing and price levels. –         Trading indicators are displayed directly and automatica
QuantXSTocks Trading Range Indicator for MT5: INSTRUCTIONS TO USE OUR INDICATOR:- User needs to take trade on Arrow or after an Arrow CandleStick, You can achieve up-to 35-125 pips target by this Indicator. Best Timeframes for Stocks and Indices are M30 and H1: AMAZON M30 (50 pips) TESLA M30 (50 pips) APPLE M30 (50 pips) ADOBE M30 (50 pips) NASDAQ100 H1 (125 pips) The above are the approximate amount of pips you can achieve by this Indicator, Green arrow appears to be buy arrow while the Red a
Trend and Signals MT5  indicator scans  30 trading Instruments (Forex, Metals and Indices).     It uses special algorithm on the  current market   based on   Pure Price Action   and display the overall trend and signal on the dashboard. When signals are produced the indicator sends alert and notification. Strategy for Signals This indicator uses the daily timeframe to determine the direction of the trend. The hourly timeframe is used to identify possible entries. Main trend and is determined by
This indicator is based on a mathematical formula and an ANN combined, designed to make a model(using previous prices) of the most recent market condition (any chart*) in order to use the model as a forecasting tool. *This indicator can operate on any chart/timeframe, but it's suggested you use multiple timeframes for each trade because this method relies solely on the time factor, you can not use this indicator to predict price volatility, but if it's fit correctly it will show you when the nex
Big promotion on the Robos, Get yours now Robos Indicator The   ROBOS   indicator is a multi timeframe oscillator that targets the   overbought   and   oversold  regions of a price chart, a signal is indicated by the two lines crossing, compatible with all tradable instruments Latest Release The latest release is the version 4.0 #What's new in version 4.0 ? Features Extreme oversold and overbought levels ROBOS version  4.0  comes with cool new feature , the ability to target on
フィルタ:
レビューなし
レビューに返信