Pct Retraction Indicator MT5
- インディケータ
- バージョン: 1.9
- アップデート済み: 19 8月 2022
- アクティベーション: 5

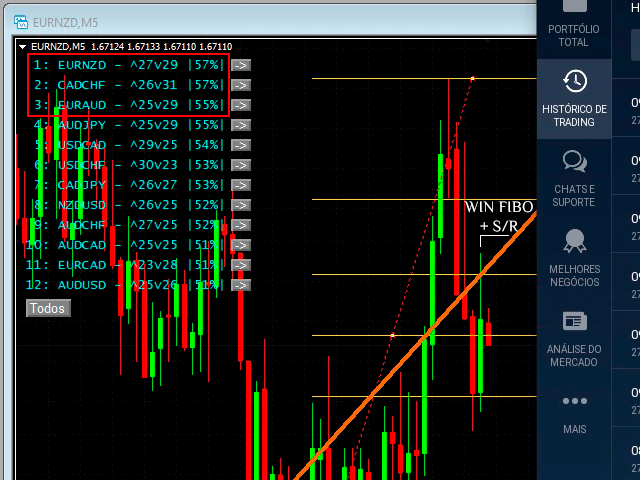
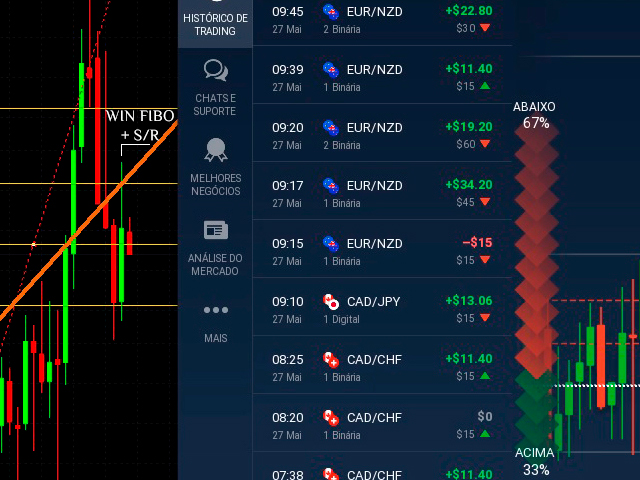
Developed to assist in binary options retraction operations, this indicator will show the best assets to operate retractions!
How it works:
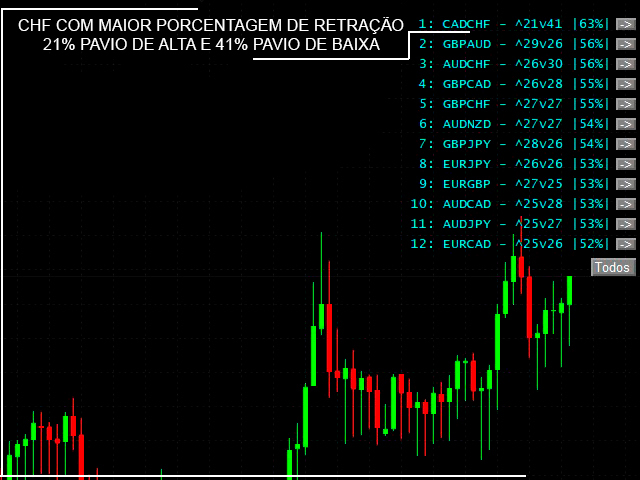
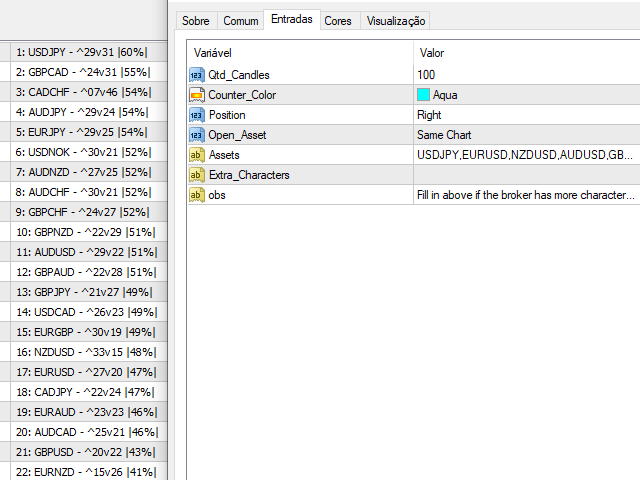
The indicator will calculate the total length of each candle from low to high, the total of the body and total of shadows (up and down) and calculate a total shadows percentage of various configurable assets. The counter is updated with each new candle.
ATENTION: Demo on the estrategy tester is not functional to show other assets, but still can show how the indicator works! Use one or two candles on the configuration to see how the percentage change on the chart!