Pct Retraction Indicador de Retracao para MT4
- インディケータ
- バージョン: 1.9
- アップデート済み: 19 8月 2022
- アクティベーション: 5

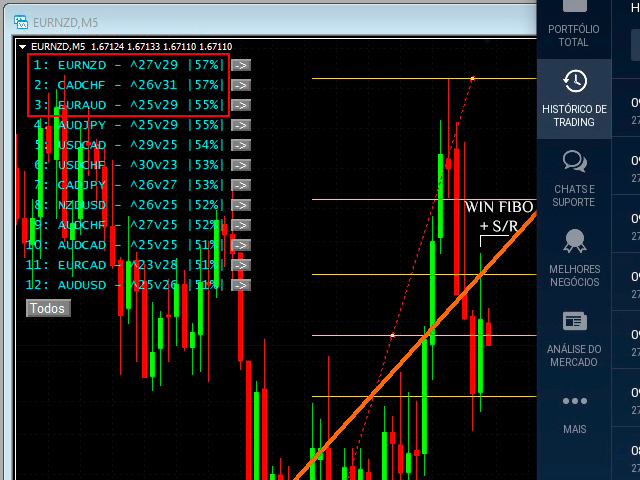
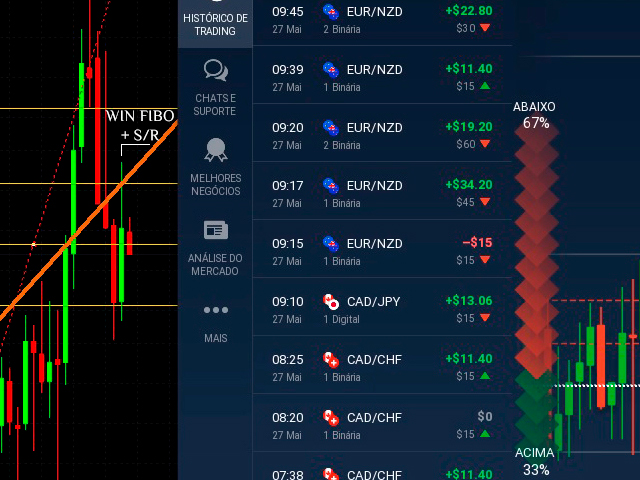
Developed to assist in binary options retracement operations, this indicator will show the assets with the best retracement percentages!
How it works:
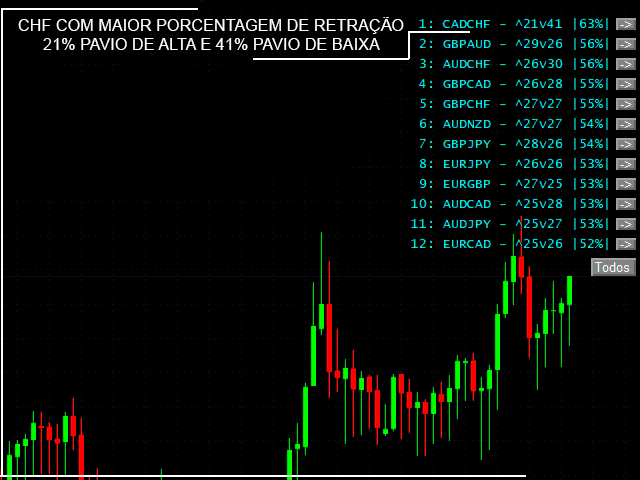
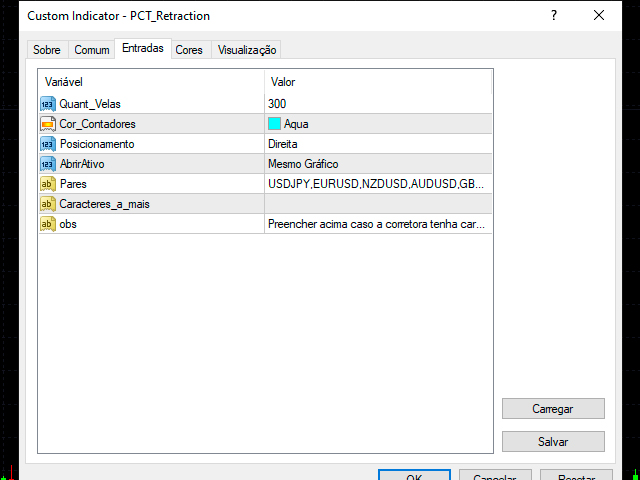
The indicator will calculate the total length of each candle from low to high, the total of the body and total of shadows (up and down) and calculate a total shadows percentage of various configurable assets. The counter is updated with each new candle.
ATENTION: Demo on the estrategy tester is not functional to show multiple assets.
Muito útil o indicador.