Jpivot
- インディケータ
-
Jing Zi Yi Teng
 どうもこんにちは!
日本の個人投資家 FXトレーダーのタツロンです!
この度、MQL5で販売者登録が完了したましたので、
日本AI総合研究所が提供する至極のインディケーターをご紹介します。
日々のトレードにどうぞお役立てください。
伊藤 達朗(イトウ タツロウ) 1986年7月15日生まれ
FXトレーダー:トレード歴10年以上
TATSURO TOKYO 代表取締役社長
日本AI総合研究所 エグゼクティブ研究員
FXアカデミー校長
運用額MAX10億円以上。現役のFXトレーダーであり「タツロン」として、メディア出演。 - バージョン: 1.0
どうもこんにちは!
私は日本の個人投資家のタツロンです。FXで10億円以上運用していました。
そこで、私が使っていてとても便利なインディケータをご紹介しましょう。
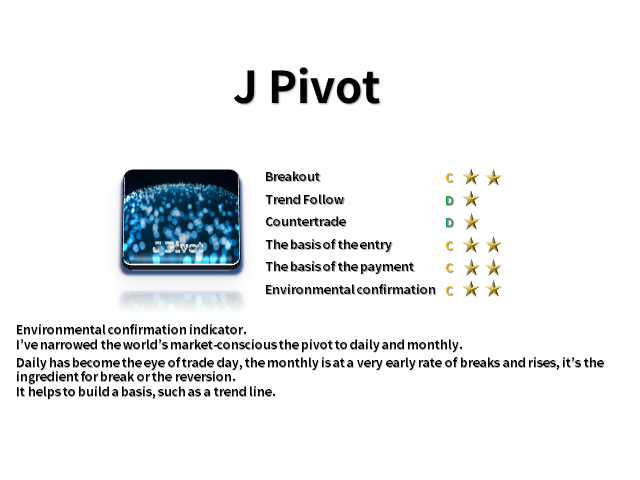
環境確認型インディケーター。
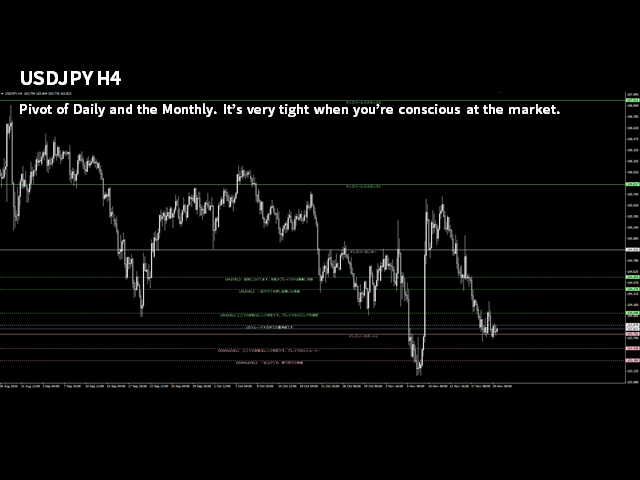
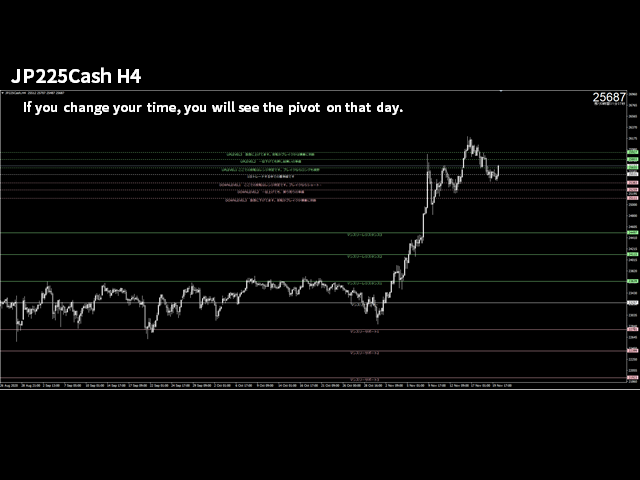
世界のマーケットが意識するpivotをデイリーとマンスリーの二つに絞りました。
デイリーは1日のトレードの目安になり、マンスリーはスピードの速いブレイク相場でブレイクまたは反転の材料となります。
自信のトレンドラインと重なった場合など、根拠の積み上げとして役に立ちます!
他のインディケーターと一緒にお使いください!
日本語のスクリーンショットのサポートが必要な場合は、こちらをご覧ください。
実際にインディケータが動いている動画もありますのでご確認ください。
Jpivotは1:48付近からスタートします。


This is really useful for me. Thank you!