Harmonic Patterns Detector MT5
- インディケータ
- バージョン: 1.4
- アップデート済み: 9 6月 2024
- アクティベーション: 5

Leave a review for this product, and receive another "Free" product that you choose.
You can see my other products here:
https://www.mql5.com/en/users/zakri/seller
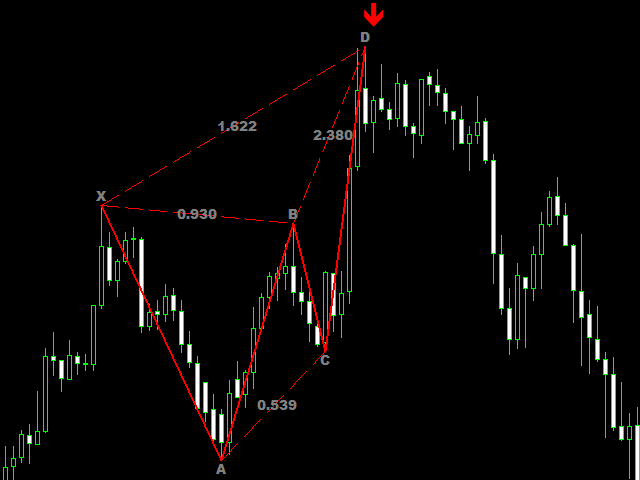
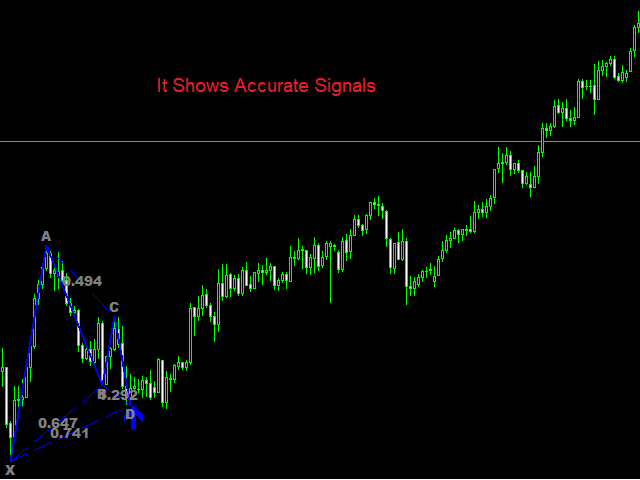
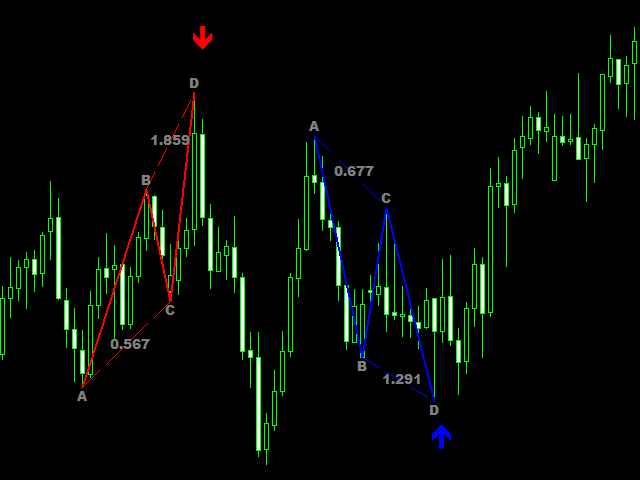
Harmonic Patterns Detector indicator draws harmonic patterns on chart.
Harmonic patterns have a high hit-rate of around 80% and are excellent for trade entries.
They are used as price reversal points.
Some of them have a long history of usage and were created by famous traders like H. M. Gartley.
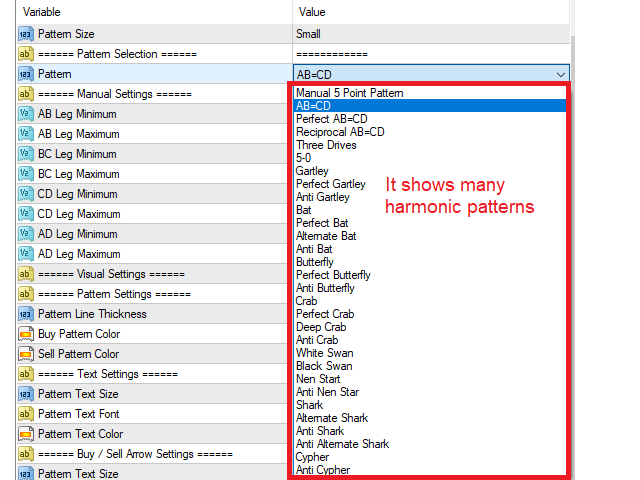
Many harmonic patterns are included in this indicator.
The patterns include:
- AB=CD
- Perfect AB=CD
- Reciprocal AB=CD
- Three Drives
- 5-0
- Gartley
- Perfect Gartley
- Anti Gartley
- Bat
- Perfect Bat
- Alternate Bat
- Anti Bat
- Butterfly
- Perfect Butterfly
- Anti Butterfly
- Crab
- Perfect Crab
- Deep Crab
- Anti Crab
- White Swan
- Black Swan
- Nen Start
- Anti Nen Star
- Shark
- Alternate Shark
- Anti Shark
- Anti Alternate Shark
- Cypher
- Anti Cypher
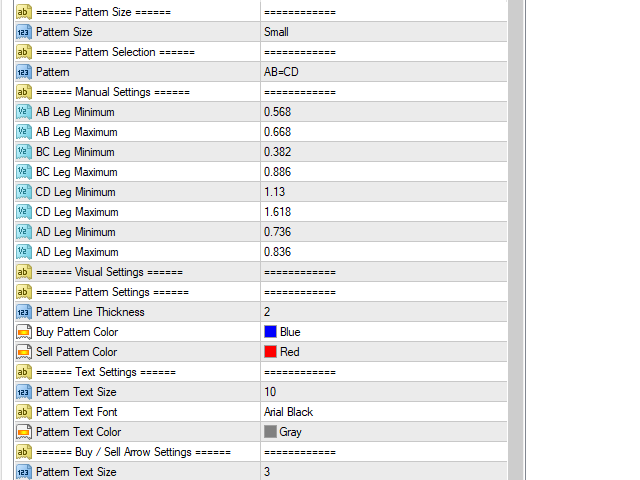
Indicator Parameters
Pattern Size: - You can choose to show smaller/medium/big patterns on chart.
- Small
- Medium
- Big
Pattern Selection:
- Pattern - You can choose the pattern type you want to be drawn on chart.
Manual Settings:
- AB Leg Minimum - Minimum Fibonacci retracement of XA leg which produces AB leg.
- AB Leg Maximum - Maximum Fibonacci retracement of XA leg which produces AB leg.
- BC Leg Minimum - Minimum Fibonacci retracement of AB leg which produces BC leg.
- BC Leg Maximum - Maximum Fibonacci retracement of AB leg which produces BC leg.
- CD Leg Minimum - Minimum Fibonacci retracement of BC leg which produces CD leg.
- CD Leg Maximum - Maximum Fibonacci retracement of BC leg which produces CD leg.
- AD Leg Minimum - Minimum Fibonacci retracement of XA leg which produces AD leg.
- AD Leg Maximum - Maximum Fibonacci retracement of XA leg which produces AD leg.
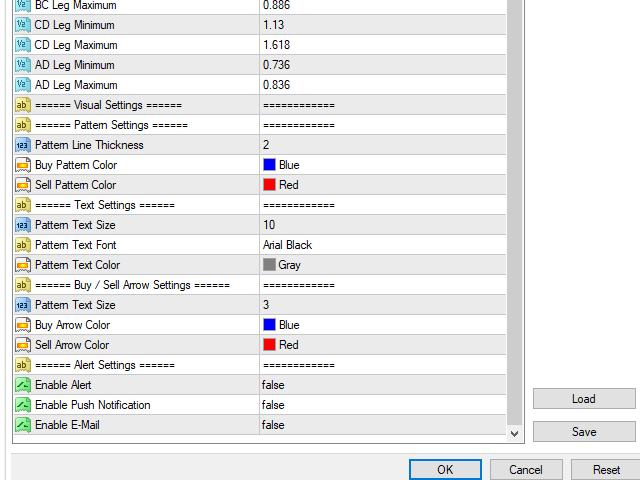
There are some options for changing visual appearance of the indicator.
Also you can enable different Alerts for new patterns shown on chart.


Very nice indicator