StochScanner 3 Modes
- インディケータ
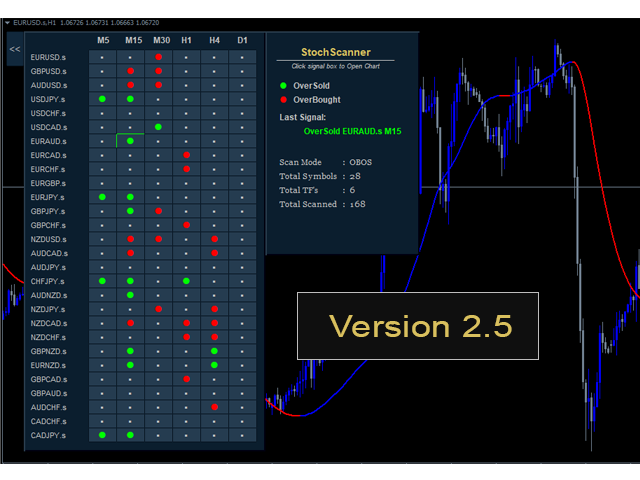
- バージョン: 2.50
- アップデート済み: 17 3月 2023
- アクティベーション: 6

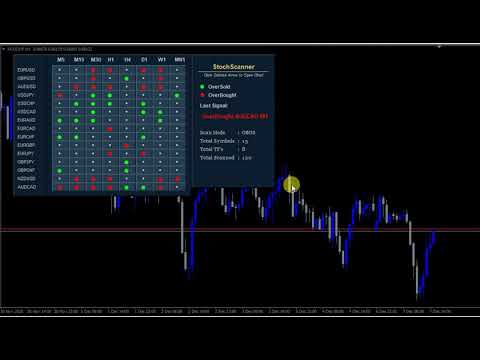
This is MT4 version of StochScanner
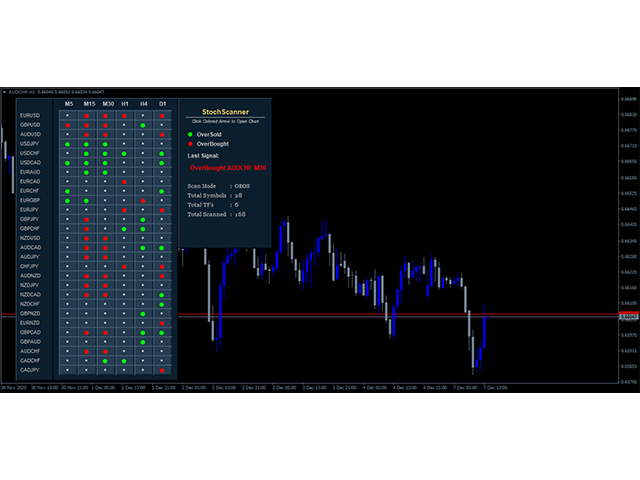
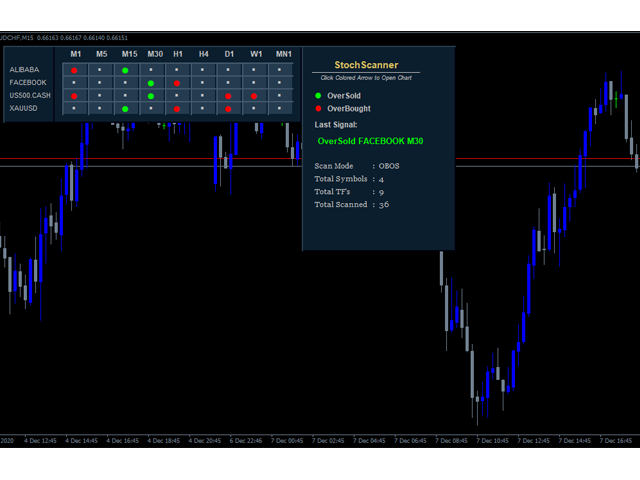
It scans Stochastic from Multi Symbols and Multi Timeframes and displayed on the dashboard on a single chart. .
4 scanning modes:
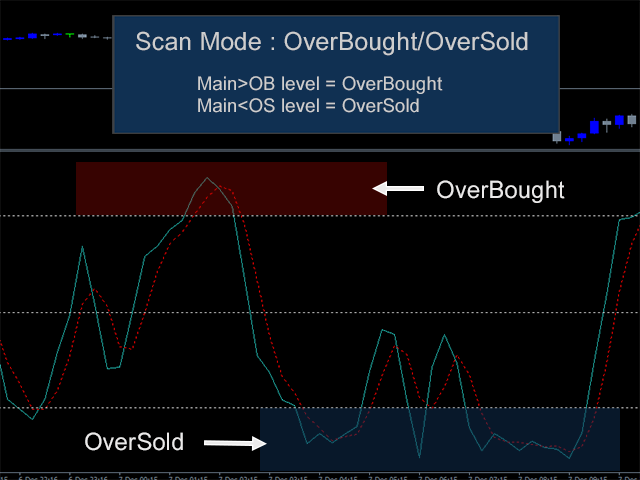
1. Mode OverBought/OverSold
Indicator scans Overbought and OverSold . OverBought : current stochastic is above level 80 and OverSold : current stochastic is below level 20
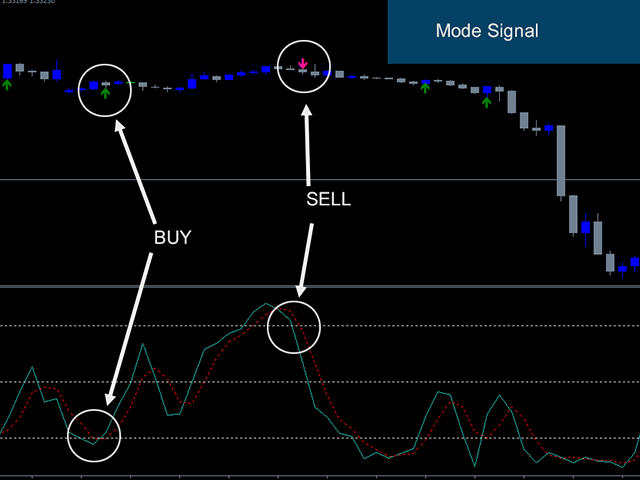
2. Mode Signal
It means if the previous stochastic is on OverBought or OverSold ( either Main Line and Signal Line ) and the current Main Line cross over the current Signal Line.
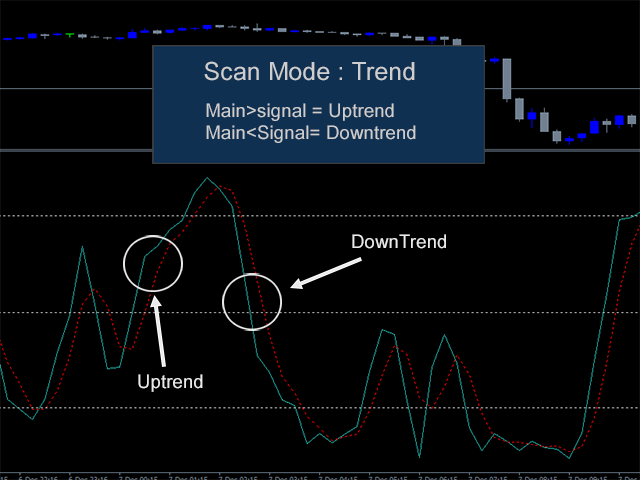
3.Mode Trend
Indicator scans the stochastic trend direction, if Main Line is above Signal Line then it is Uptrend and vice versa, if Main Line is below Signal Line then it is Downtrend
4.FirsOut [New]
If Main Line is Inside OverBought or OverSold Area and the previous Main Line is Outside OverBought or OverSold Area. The other words, it is the first time for Main Line to come in to OverBought or OverSold Area.
Features
- Able to Show or Hide the Dashboard. In case you want to see the main chart for better analysis without having to be covered by Dashboard.
- The Last Signal with highlight on the appropriate box. It may be useful to take action immediately when the signal occurs.
- Additional Trend Line on the chart. Combining Stochastic Signals and Trend Line could be the best decision.
- Able to set the minimum total signals to send alerts. By using this method can avoids continuous alerts due to the selected signal mode and timeframes. And the alerts that are sent will indicate a stronger signal because it is a combination of signals from multi timeframes.
Parameters
- Scans Symbols: The symbols to be scanned, separated by commas.
- Symbol Prefix: The prefix of the symbol if available. This is some words before the symbol.
- Symbol Suffix: The words after symbol if available. Example: EURUSD.m, in this case the suffix is ".m" without quotes.
- Scans TimeFrames: Timeframes to be scanned. Separated by commas. They can be M1,M5,M15 and so on or 1,5,15 and so on.
- Scan Mode: Select Scan Mode here as previously explained above.
- Candle to use for analysis: This is a bar shift to get the stochastic values. There are 2 choices; close candle or current candle.
- KPeriod.
- DPeriod.
- Slowing.
- Overbought.
- Oversold.
- Show Trend Line: Option to show Trend Line.
- Trend Period.
- Method.
- ApplyPrice.
- Minimum Total TFs to alert/symbol: This is the minimum total signals in the same symbols for indicator to send alert.
- PopUp Alert: Alert on the Chart Window on the platform.
- Mobile Alert: Sending notification to metatrader mobile platform.
- Email Alert: Send a message to email.
It is useful for trader to identify the Market Condition based on the Stochastic Indicator. Faster to find stochastic condition from Multi Symbols and Timeframes on the single chart.
For Example: You want to get the reversal price of certain symbol then use Mode SIgnal and see on the dashboard to find at least 3 signals with the same direction or set the parameter input the Minimum Total TFs to alert/symbol=3 as default, so it will alert you when the condition is fulfilled. Trade Scalping for lower timeframes and higher timeframes for longer trading term.
- Adding Scan Mode FirstOut.
- Improve the trendline algorithm.
- Improve the coding structure.
- Add Hide/Show Button.
- Add highlights to the box for the last signal and improve the logic of the last signal.
- Every Signal Box (Matrix Box) is clickable to switch symbol and timeframe as previously not.