• 概要
  • レビュー (3)
  • コメント (3)
  • 最新情報

Golden Retracement Power

5

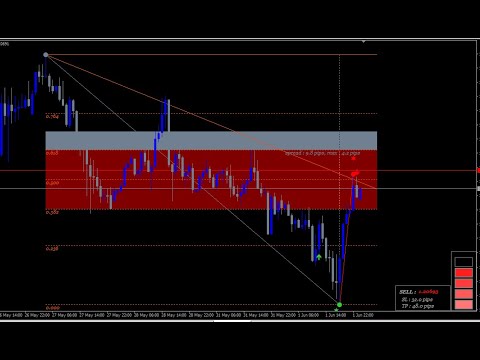
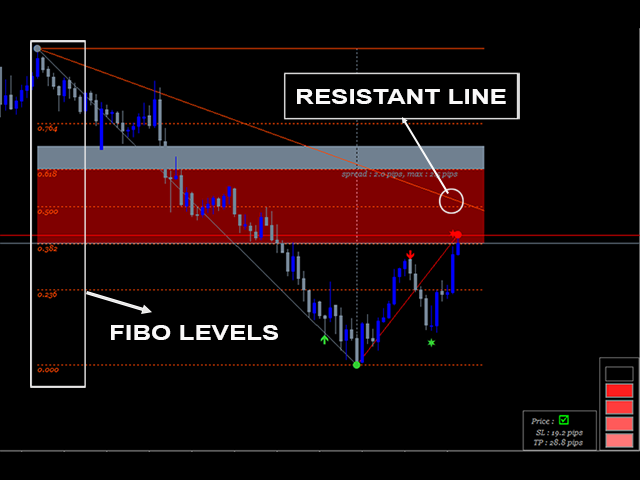
GOLDEN RETRACEMENT POWER indicator draws fibonacci levels automatically. Defines the golden entry buy/sell area, support and resistant lines , signals arrows and strength 'Power Bars Level' based on price action . Some indicators also work behind the chart: Stochastic,RSI,MFI,DeMarker and WPR .

Fibonacci retracements are a popular form of technical analysis used by traders in order to predict future potential prices in the financial markets. If used correctly, Fibonacci retracements and ratios can help traders to identify upcoming support and resistance​ levels based on past price action.

From those ratios , we believe there is the best one that provide the strong retracement signal that we call it as the golden retracement area. 

GOLDEN RETRACEMENT POWER indicator is the combination of price action , high-low strategy and fibonacci 'golden' retracement.  


Recommended Timeframes : M15-H1. Even though it can work on any timeframe

Symbols: Any


INDICATOR SETTING

Select Timeframe = There are 2 option : Defined and Higher. Defined means that we can define certain timeframe for fibonacci levels calculation. Higher means that indicator calculates fibonacci levels from higher timeframe. Example : current timeframe is M15 then fibonacci levels is from M30. Current timeframe is H1 then fibonacci levels is from H4,etc.

In case Select Timeframe = Defined then we need to define timeframe below

Timeframe = determine timeframe here. It can be from M1 to Monthly

Slow Period =  Slower Period of Trend

Fast Period =  Faster Period Of Trend

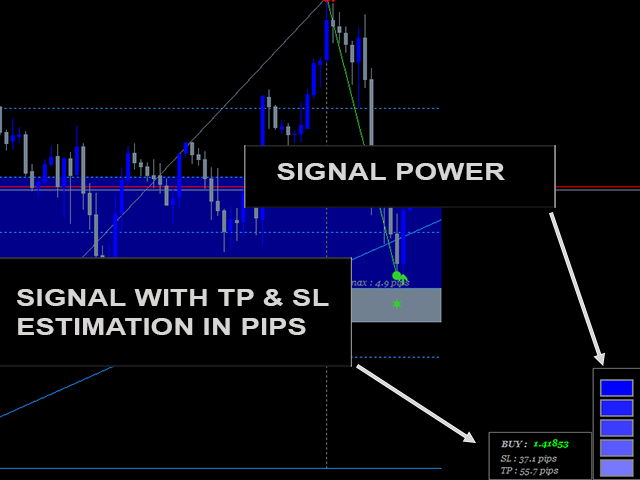
Reward Ratio = Indicator will automatically calculate SL in pips and in this case we can set reward ratio to show on the chart

Show Fibo Lines = Show /Hide Fibo Levels

Up Area Color = Golden area color for uptrend

Down Area Color =  Golden area color for downtrend

Up Line Color =  Fibo level color for uptrend

Down Line Color = Fibo level color for downtrend

Up Text Color = Text color for uptrend

Down Text Color = Text color for downtrend

Minimum Signal strength to Alert = Minimum value of Strength power levels for indicator to alert

-- Below is input true/false for alert. -- 

PopUp Alert

Mobile Notification Alert

Email Alert


HOW TO TRADE

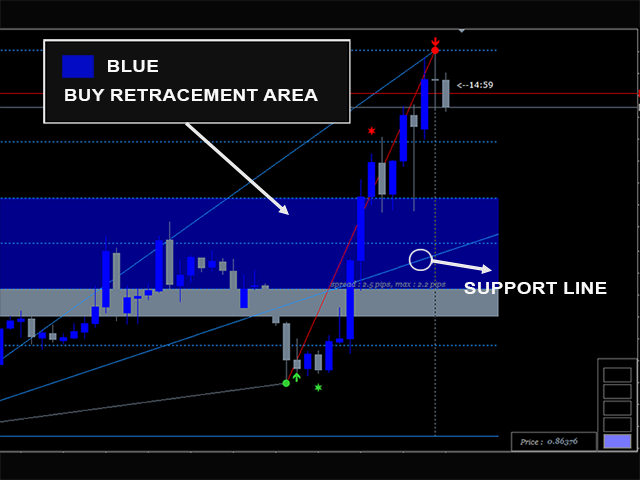
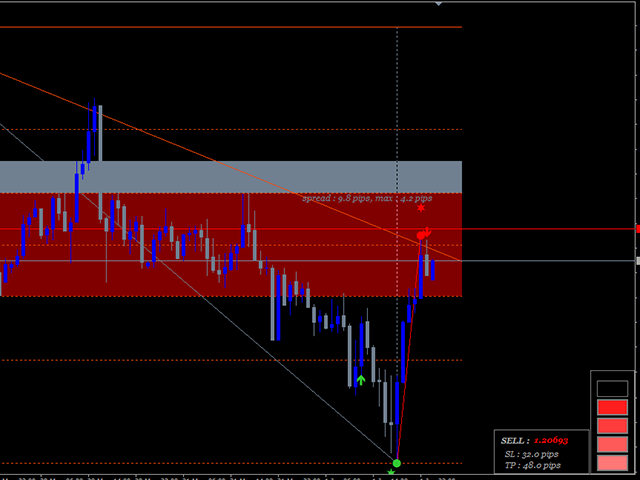
There are 3 kind of arrows on the chart. Arrows,circles and stars. Arrows provide entry momentum ,circles indicate highest/lowest price in the faster period and stars is to ensure that price currently oversold /overbought . Then 2 colors "template" : Blue and Red that we can change thru external inputs , is a trend. By default , blue is uptrend and red is downtrend. 

Trendlines as a support and resistant line (see images ) and 'Power Bars Level' in the bottom right as an indication of signal strength.

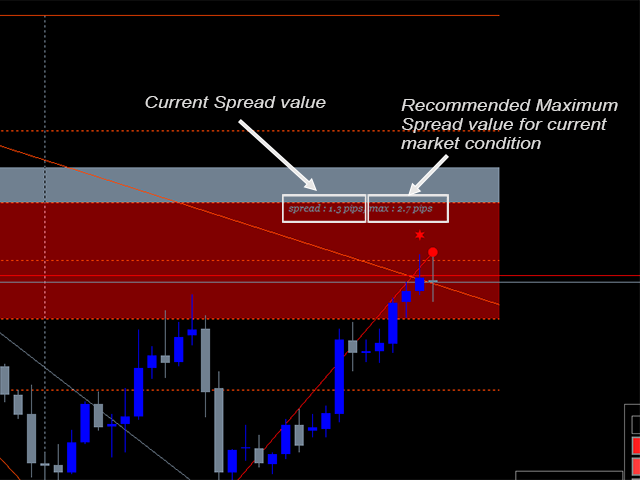
We provide the recommendation of maximum spread value for current market condition. Maximum spread value is recommended as long you are using SL value provided by indicator because the SL is calculated by range of current fibo level. It may be high possibility to reach stoploss other than takeprofit when spread is too high . 

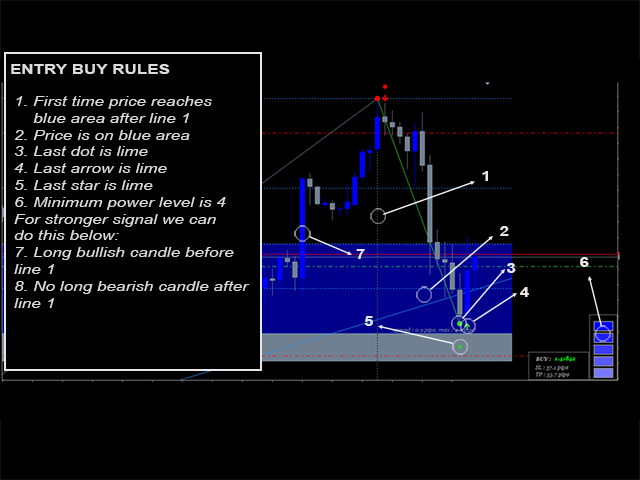
Below is the details of entry buy rules. Simply do vise versa for entry sell.


BUY RULES

1. Uptrend. By default color is Blue.

2.  Last Arrow color is lime

3. Last  Circle color is lime

4. Last  Star color is lime

5. Price is in ' Golden area' . Where the golden area is the blue rectangle. In this case price is Ask for buy and Bid for Sell

6. Minimum Power strength level bars = 4

For stronger signal we can do these below:

7. There is at least 1 long bullish /marubozu/ any other other bullish candle patterns before vertical line. See image

8. There is not long bearish/marubozu/ any other other bearish candle patterns after vertical line. See image. Small candles in the last is better.

9. There is not candle close below gray rectangle after vertical line. 

Please watch video for more details

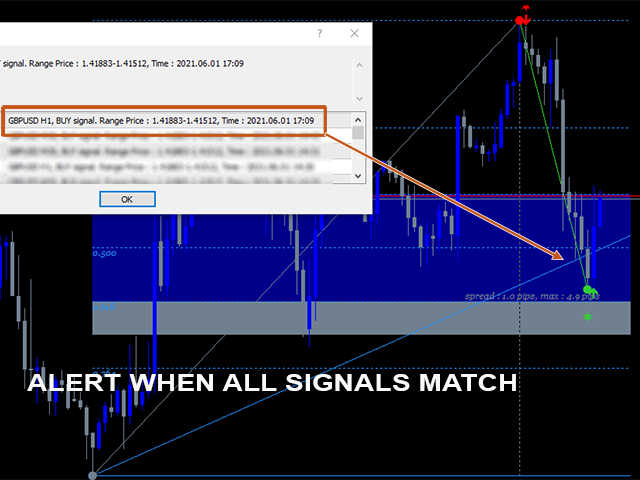
OR WE CAN SIMPLY FOLLOW THE ALERT. All rules above are summarized by alert. You can set minimum power level for indicator to alert you.


レビュー 3
elite luis
3331
elite luis 2023.03.22 17:09 
 

Looks Good, Author very helpful and prompt to support, Excellent 5 stars!

dev1981
337
dev1981 2023.03.02 11:30 
 

First trade....indicator cost covered...excellent technical indicator...need to play more with settings for using it on HTF

Aravind Kolanupaka
8835
Aravind Kolanupaka 2022.07.21 19:48 
 

Good one! Nicely done indicator.

おすすめのプロダクト
The Th3Eng PipFinite indicator is based on a very excellent analysis of the right trend direction with perfect custom algorithms. It show the true direction and the best point to start trading. With StopLoss point and Three Take Profit points. Also it show the right pivot of the price and small points to order to replace the dynamic support and resistance channel, Which surrounds the price. And Finally it draws a very helpful Box on the left side on the chart includes (take profits and Stop loss
フィボナッチリトレースと拡張ラインツール DiNapoliポイント取引方法とゴールデンセクション取引を使用するトレーダーにとって理想的なMT4プラットフォームのフィボナッチリトレースと拡張ラインツール 主な特長: あなたはフィボナッチリトレースメントの複数のセットを直接描くことができ、重要なリターンポイント間の関係は一目瞭然です。 2.フィボナッチ拡張を描画することができます。 3.フィボナッチフォールドバックとラインの延長は、簡単な観察と数値表示のために左右に動かすことができます。 4.チャートは非常に爽やかな 5.数字キーでサイクルを切り替えることができます。 ファンクションキー: 1。 [戻るを押す、要求に応じて描画する、最大8つのグループにする 2。拡張]を描くには[押す] 3。 \を押すと、現在のサイクルの下にあるすべての拡張機能と折り畳みが削除されます 4。フォールドバックを移動して削除して展開する (1)最初のフォールドバックセットのF5行をクリックします。 一度クリックすると(黄色に変わります)、キーボードのDel
VR Cub
Vladimir Pastushak
VR Cub は、質の高いエントリーポイントを獲得するためのインジケーターです。このインジケーターは、数学的計算を容易にし、ポジションへのエントリーポイントの検索を簡素化するために開発されました。このインジケーターが作成されたトレーディング戦略は、長年にわたってその有効性が証明されてきました。取引戦略のシンプルさはその大きな利点であり、初心者のトレーダーでもうまく取引することができます。 VR Cub はポジション開始ポイントとテイクプロフィットとストップロスのターゲットレベルを計算し、効率と使いやすさを大幅に向上させます。取引の簡単なルールを理解するには、以下の戦略を使用した取引のスクリーンショットを見てください。 設定、設定ファイル、デモ版、説明書、問題解決方法は、以下から入手できます。 [ブログ] レビューを読んだり書いたりすることができます。 [リンク] のバージョン [MetaTrader 5] エントリーポイントの計算ルール ポジションをオープンする エントリーポイントを計算するには、VR Cub ツールを最後の高値から最後の安値までストレッチする必要があります。
This is a trend indicator without redrawing Developed instead of the binary options strategy (by the color of the Martingale candlestick) Also works well in forex trading When to open trades (binary options) A signal will appear in the place with a candle signaling the current candle It is recommended to open a deal for one candle of the current timeframe M1 and M5 When a blue dot appears, open a deal up When a red dot appears, open a trade down. How to open trades on Forex. When a signal is rec
Gioteen Volatility Index (GVI)   - your ultimate solution to overcoming market unpredictability and maximizing trading opportunities. This revolutionary indicator helps you in lowering your losing trades due to choppy market movements. The GVI is designed to measure market volatility, providing you with valuable insights to identify the most favorable trading prospects. Its intuitive interface consists of a dynamic red line representing the volatility index, accompanied by blue line that indicat
This unique multi-currency strategy simultaneously determines the strength of trends and market entry points, visualizing this using histograms on the chart. The indicator is optimally adapted for trading on the timeframes М5, М15, М30, Н1. For the convenience of users, the indicator renders the entry point (in the form of an arrow), recommended take profit levels (TP1, TP2 with text labels) and the recommended Stop Loss level. The take profit levels (TP1, TP2) are automatically calculated for
Owl smart levels
Sergey Ermolov
4.63 (54)
MT5版  |   FAQ Owl Smart Levels Indicator   は、 Bill Williams   の高度なフラクタル、市場の正しい波構造を構築する Valable ZigZag、エントリの正確なレベルをマークする Fibonacci レベルなどの一般的な市場分析ツールを含む 1 つのインジケーター内の完全な取引システムです。 利益を得るために市場と場所に。 戦略の詳細な説明 インジケータを操作するための指示 顧問-取引助手 プライベートユーザーチャット ->購入後に私に書いて、私はプライベートチャットにあなたを追加し、あなたはそこにすべてのボーナスをダウンロードすることができます 力はシンプルさにあります! Owl Smart Levels   取引システムは非常に使いやすいので、専門家にも、市場を勉強し始めて自分で取引戦略を選択し始めたばかりの人にも適しています。 戦略と指標に秘密の数式や計算方法が隠されているわけではなく、すべての戦略指標は公開されています。 Owl Smart Levels を使用すると、取引を開始するためのシグナルをすばやく確認し、
Title : Market Bias Indicator - Oscillator-Based Trading Tool Introduction : Discover the potential of the "Market Bias Indicator," a revolutionary oscillator-based trading tool designed for precise market analysis. If you're in search of a robust alternative to traditional bias indicators, your quest ends here. Market Bias Indicator offers unparalleled accuracy in identifying market sentiment and is your gateway to confident trading decisions. Recommended Trading Pairs : Market Bias Indicator i
The CCI Divergence is a reasonably useful indicator in itself, but it is even more effective when used with divergence pattern trading. The CCI Divergence indicator signal is one of the most potent signals among the indicators that exist in the market. Here is new version for Divergence Indicator using CCI method, with more improvements. Divergences indicate a potential investment point because the directional moment does not confirm the price. A bullish divergence occurs when the underlying
Noize Absorption Index - is the manual trading system that measures the difference of pressure between bears forces and bulls forces. Green line - is a noize free index that showing curent situation. Zero value of index shows totally choppy/flat market.Values above zero level shows how powerfull bullish wave is and values below zero measures bearish forces.Up arrow appears on bearish market when it's ready to reverse, dn arrow appears on weak bullish market, as a result of reverse expectation. S
Market Trend Catcher indicator analyzes the duration of trend movements and, with a certain development of the current trend, offers market entry points in the form of arrows with recommended profit targets. The indicator is very easy to use and does not require a lot of information to understand how it works. It has a minimum of settings and is transparent in understanding the principle of its operation, fully displaying the information on the basis of which it makes decisions on recommending e
Was: $249  Now: $99   Market Profile defines a number of day types that can help the trader to determine market behaviour. A key feature is the Value Area, representing the range of price action where 70% of trading took place. Understanding the Value Area can give traders valuable insight into market direction and establish the higher odds trade. It is an excellent addition to any system you may be using. Blahtech Limited presents their Market Profile indicator for the MetaTrader community. Ins
This indicator monitors the market for a flat state and possible breakout. The flat state is detected as a predefined number of consecutive bars during which price fluctuates inside a small range. If one of the next bars closes outside the range, breakout is signaled. The indicator shows 3 lines: blue - upper bound of flat ranges AND consecutive breakout areas; red - lower bound of flat ranges AND consecutive breakout areas; yellow - center of flat ranges (NOT including breakout areas). When a b
Fibonacci indicator based on fractal.This software can automatically draw the golden section proportional line of two trend lines, and mark all the recent high and low prices.And the percentage value of volatility is a multi-cycle, multi-currency oscillation indicator.It is very effective for traders to find support and resistance lines and find entry and exit points near them.
Bermaui Bands
Muhammad Elbermawi
4.94 (89)
Bermaui Bands(BB)は、レンジとトレンドの価格変動をフィルタリングするのに役立つテクニカル分析ツールです。この指標の背後にある考え方は、次のステップで説明できます。 標準偏差を0〜100の間で移動するオシレーターとして計算します。これをBermaui偏差パーセント(BD%)と名付けます。 「BD%」がゼロに近い場合、ボラティリティは極端になります。さらに、「BD%」が100に近い場合、ボラティリティは非常に低くなります。 ボラティリティが高いということは、トレンド市場の可能性が高いことを意味し、ボラティリティが低いということは、横向きまたはレンジング市場を意味します。 標準偏差はSMAに基づいて計算されるため、中央の線は単純移動平均(SMA)です。 計算で同じバー数の単純移動平均に「BD%」を追加して、アッパーベルマウイバンドを取得します。 計算で同じ数のバーを使用した単純な移動平均から「BD%」を減算して、Lower BermauiBandsを取得します。 重要な情報 Bermaui Bandsユーザーズマニュアル: https://www.mql5.com/en/b
[ZhiBiCCI]インディケータは全てのサイクル使用に適しており、そして全ての市場品種にも適しています。 [ZhiBiCCI]緑色の実線は強気の発散の逆転です。緑色の点線は古典的な強気の発散です。 [ZhiBiCCI]赤への実線は逆弱気の発散である。赤い点線は古典的な弱気の発散です。 [ZhiBiCCI]はパラメータ(アラート、メール送信、通知送信)で設定でき、(true)に設定するとインスタント信号をアラームウィンドウに送信し、Eメール、インスタントメッセージを送信できます。 パラメータ設定の説明 [displayAlert]:これはアラームスイッチで、trueに設定され、矢印が表示されればプロンプトに自動的に警告され、falseに設定されれば警告されません。 [sendmail_NO_OFF]:これはメールを送信するためのスイッチで、trueに設定します。矢印が表示されていればMT4で設定したメールボックスにメールを送信し、falseに設定されていればメールを送信しません。 [sendnotification_NO_OFF]:これはインスタントメッセー
Perfect Trade System   indicator is designed for trend and signal trading. This indicator generates trend signals.  It uses many algorithms and indicators to generate this signal. It tries to generate a signal from the points with the highest trend potential. This indicator is a complete trading product. This indicator does not need any additional indicators.  You can only trade with this indicator. The generated signals are displayed on the graphical screen.  Thanks to the alert features you ca
This   Real Magic Trend   indicator is designed for signal trading. This indicator generates trend signals. It uses many algorithms and indicators to generate this signal. It tries to generate signals from the points with the highest trend potential. This indicator is a complete trading product. This indicator does not need any additional indicators. The indicator is never repainted. The point at which the signal is given does not change.      Features and Recommendations Time Frame
Improved version of the free HMA Trend indicator (for MetaTrader 4) with statistical analysis. HMA Trend is a trend indicator based on the Hull Moving Average (HMA) with two periods. HMA with a slow period identifies the trend, while HMA with a fast period determines the short-term movements and signals in the trend direction. The main differences from the free version: Ability to predict the probability of a trend reversal using analysis of history data. Plotting statistical charts for analyz
Super Gator
Agustinus Biotamalo Lumbantoruan
This indi shows the following 1. Supertrend 2. Alligator (Not a regular alligator) 3. ZigZag 4. Moving Average 5. Trend Continuation/Mini correction Signal (plotted in X) (See screenshots in green background color 6. Early Signal Detection (See screenshots in green background color) You may treat Alligator as the lagging indicator The leading indicator is the supertrend. The zig zag is based on the leading indicator where it gets plotted when the leading indicator got broken to the opposite.
This indicator predicts rate changes based on the chart display principle. It uses the idea that the price fluctuations consist of "action" and "reaction" phases, and the "reaction" is comparable and similar to the "action", so mirroring can be used to predict it. The indicator has three parameters: predict - the number of bars for prediction (24 by default); depth - the number of past bars that will be used as mirror points; for all depth mirroring points an MA is calculated and drawn on the ch
Renko, Heiken Ashi, Ticks Bar, Range Bar.    Easy switching, easy setup, all in one window.        Place the Custom Chart indicator and view Renko, Heiken Ashi, Tick bar, Range bar charts in real time at real chart.    Position the offline chart window so that the indicator control panel is visible.    Switch the chart mode by click of a button.    Connect to the output chart any indicator, expert advisor without any restrictions.    No, it doesn't work in the tester.    Yes, you can use an
Trend lines master
The Trading Team Ltd
5 (1)
Launch promotion For a limited time only:  30$ instead of 157$ Summary Create precise trend lines in a second Description This indicator will draw your trend lines automatically with great precision, saving you some precious time. It uses Bill Williams Fractals to identify the key points and draws both inner and outer trend lines. Features Automatically draws precise trend lines
The indicator displays the data of the Stochastic oscillator from a higher timeframe on the chart. The main and signal lines are displayed in a separate window. The stepped response is not smoothed. The indicator is useful for practicing "manual" forex trading strategies, which use the data from several screens with different timeframes of a single symbol. The indicator uses the settings that are identical to the standard ones, and a drop-down list for selecting the timeframe. Indicator Parame
Heiken Ashi candle chart is an improved version of The Japanese candle chart, which can effectively filter the market "noise" of the Japanese candle chart. It is favored by many traders for its simplicity and intuition. For trend traders, the HA candle chart is a magic tool. Unlike the traditional Japanese candle chart, Heikenashi does not reflect the opening price, high price, low price and closing price of the market. Instead, Heikenashi calculates the value of a single K line in the dominant
Gvs Undefeated Trend   indicator is designed for trend and signal trading. This indicator generates trend signals.  It uses many algorithms and indicators to generate this signal. It tries to generate a signal from the points with the highest trend potential. This indicator is a complete trading product. This indicator does not need any additional indicators.  You can only trade with this indicator. The generated signals are displayed on the graphical screen.  Thanks to the alert features you ca
This indicator displays Stochastic osc signals on the price chart and allows the user to receive notifications of such signals. The Stochastic indicator is a classic and proven indicator of the technical analysis of the markets. Despite its age, it is still relevant today. Depending on the settings, the indicator allows you to work effectively on various TFs and any markets. Signals are given on fully formed bars and are not redrawn. Custom Parameters: Stochastic_Price (0-1) - The applied pric
FREE
Bintang Binary Indicator work all pairs Time Frame : M5 Expaired : 1 Candle No Repaint, No Delay and Alerts Use manual and auto trading  Easy to use Trial Version, Rent Version and Full Version avaliable Trial Version >>> download here  https://www.mql5.com/en/market/product/54602 Trial Version not have Alerts Rent version 1 month, 3 month, 6 month, 9 month, and 1 years Auto trading is better use MT2 Trading Platform (Contact me for discount 10 % MT2 trading licence) Work good for forex trading
トレンドトレーディング は、タイミングのプルバックとブレイクアウトにより、市場で起こっているトレンドから可能な限り利益を得るように設計された指標です。確立されたトレンドの中で価格が何をしているかを分析することにより、取引の機会を見つけます。 [ インストールガイド | 更新ガイド | トラブルシューティング | よくある質問 | すべての製品 ] 自信を持って効率的に金融市場を取引する むち打ちにならずに確立されたトレンドから利益を得る 収益性の高いプルバック、ブレイクアウト、早期の逆転を認識する この指標は、独自の品質とパフォーマンスを分析します 複数時間枠のダッシュボードを実装します インジケーターは再描画されていません 電子メール/音声/視覚アラートを実装します 確立されたトレンドは多くの取引機会を提供しますが、ほとんどのトレンド指標はそれらを完全に無視しています。インジケーターの解釈はかなり簡単です: (1) トレンドの変化 (2) トレンドの方向への後退 (3) トレンドの方向へのブレイクアウト 赤いダッシュ は下降トレンド中の修正です 青いダッシュ は上昇ト
このプロダクトを購入した人は以下も購入しています
Gann Made Easy は、ミスター・ギャンの理論を使用した取引の最良の原則に基づいた、プロフェッショナルで使いやすい外国為替取引システムです。 W・D・ガン。このインジケーターは、ストップロスとテイクプロフィットレベルを含む正確な買いと売りのシグナルを提供します。 PUSH通知を利用して外出先でも取引可能です。 購入後はご連絡ください!私の取引のヒントと素晴らしいボーナスインジケーターを無料で共有します! おそらく、ギャンの取引手法についてはすでに何度も聞いたことがあるでしょう。通常、ギャンの理論は初心者のトレーダーだけでなく、すでにある程度の取引経験がある人にとっても非常に複雑なものです。なぜなら、ギャンの取引手法は理論的にはそれほど簡単に適用できるものではないからです。私はその知識を磨き、最良の原則を私の外国為替インジケーターに組み込むために数年を費やしました。 このインジケーターは非常に簡単に適用できます。必要なのは、それをチャートに添付し、簡単な取引推奨事項に従うだけです。このインジケーターは常に市場分析の仕事を行い、取引の機会を探します。適切なエントリーポイントを検出
まず第一に、この取引インジケーターは再描画されず、再描画されず、遅延しないことを強調する価値があります。これにより、手動取引とロボット取引の両方に理想的なものになります。 アトミックアナリストは、価格の強さとモメンタムを利用して市場でより良いエッジを見つけるためのPA価格アクションインジケーターです。ノイズや誤ったシグナルを除去し、取引ポテンシャルを高めるための高度なフィルターを備えています。複雑なインジケーターの複数のレイヤーを使用して、アトミックアナリストはチャートをスキャンし、複雑な数学的計算をシンプルなシグナルと色に変換します。これにより、どのような初心者トレーダーでも理解して使用し、一貫した取引の決定を行うことができます。 「アトミックアナリスト」は、新規および経験豊富なトレーダー向けにカスタマイズされた包括的な取引ソリューションです。プレミアムインジケーターとトップノッチの機能を1つの取引戦略に組み合わせ、すべてのタイプのトレーダーにとって汎用性のある選択肢にします。 デイリートレーディングとスキャルピング戦略:高速で正確なデイトレーディングおよび短期トレード
TPSpro TRENDPRO  - is a trend indicator that automatically analyzes the market and provides information about the trend and each of its changes, as well as giving signals for entering trades without redrawing! The indicator uses each candle, analyzing them separately. referring to different impulses - up or down impulse. Exact entry points into transactions for currencies, crypto, metals, stocks, indices!  -  Version MT5               DETAILED DESCRIPTION        /       TRADING SETUPS           
現在26%オフ 初心者やエキスパートトレーダーに最適なソリューション! このインジケーターは、独自の機能と新しい計算式を取り入れた、ユニークで高品質、かつ手頃な価格のトレーディングツールです。たった1枚のチャートで28の為替ペアの通貨強度を読み取ることができます。新しいトレンドやスキャルピングチャンスの引き金となるポイントを正確に特定することができるので、あなたのトレードがどのように改善されるか想像してみてください。 ユーザーマニュアルはこちら  https://www.mql5.com/en/blogs/post/697384 これが最初の1本、オリジナルだ! 価値のないクローンを買わないでください。 特別な サブウィンドウの矢印で強い通貨の勢いを表示 GAPがあなたのトレードを導く! 基準通貨や気配値が売られすぎ・買われすぎのゾーン(外相フィボナッチレベル)にあるとき、個別チャートのメインウィンドウに警告表示。 通貨がレンジの外側から反落した場合、プルバック/リバーサルのアラート。 クロスパターンの特別なアラート 複数の時間枠を選択可能で、トレンドを素早く
Scalper Vault は、スキャルピングを成功させるために必要なすべてを提供するプロフェッショナルなスキャルピング システムです。このインジケーターは、外国為替およびバイナリー オプションのトレーダーが使用できる完全な取引システムです。推奨される時間枠は M5 です。 システムは、トレンドの方向に正確な矢印シグナルを提供します。また、トップとボトムのシグナルとギャン マーケット レベルも提供します。 インジケーターは、プッシュ通知を含むすべてのタイプのアラートを提供します。 インジケータの購入後にご連絡ください。私の個人的な取引の推奨事項と素晴らしいボーナス指標を無料で共有します! 幸せで有益な取引をお祈りします!
まず第一に、この取引ツールはノンリペイント、ノンリドロー、ノンラグの指標であり、プロの取引に理想的ですことを強調する価値があります。 スマートプライスアクションコンセプトインジケーターは、新米から経験豊富なトレーダーまで、非常 に強力なツールです。Inner Circle Trader AnalysisやSmart Money Concepts Trading Strategiesなど、20以上の有用な指標を1つに組み合わせています。このインジケーターはスマートマネーコンセプトに焦点を当て、大手機関の取引方法を提供し、彼らの動きを予測するのに役立ちます。 特に、流動性分析に優れており、機関がどのように取引しているかを理解しやすくしています。市場のトレンドを予測し、価格の動きを慎重に分析するのに優れています。機関の戦略とトレードを合わせることで、市場の動向についてより正確な予測ができます。このインジケーターは多目的であり、市場構造を分析し、重要な注文ブロックを特定し、さまざまなパターンを認識するのに優れています。 このインジケーターはBOSやCHoCHなどのパターンの識
現在20%OFF! 初心者やエキスパートトレーダーのためのベストソリューション! このダッシュボードソフトウェアは、28の通貨ペアで動作しています。それは私達の主要な指標(高度な通貨の強さ28と高度な通貨インパルス)の2に基づいています。それは全体の外国為替市場の大きい概観を与えます。それは、すべての(9)時間枠で28の外国為替ペアのための高度な通貨の強さの値、通貨の動きの速度と信号を示しています。チャート上で1つのインディケータを使用して市場全体を観察し、トレンドやスキャルピングの機会をピンポイントで見つけることができたら、あなたのトレードがどのように改善されるか想像してみてください。 このインディケータには、強い通貨と弱い通貨の識別、潜在的な取引の識別と確認がより簡単になるような機能が搭載されています。このインディケータは、通貨の強さや弱さが増加しているか減少しているか、また、すべての時間枠でどのように機能しているかをグラフィカルに表示します。 新機能として、現在の市場環境の変化に適応するダイナミックなマーケットフィボナッチレベルが追加され、すでに当社のAdvan
SALE NOW! Limited Time Offer! An exclusive indicator that utilizes an innovative algorithm to swiftly and accurately determine the market trend. The indicator automatically calculates opening, closing, and profit levels, providing detailed trading statistics. With these features, you can choose the most appropriate trading instrument for the current market conditions. Additionally, you can easily integrate your own arrow indicators into Scalper Inside Pro to quickly evaluate their statistics and
A key element in trading is zones or levels from which decisions to buy or sell a trading instrument are made. Despite attempts by major players to conceal their presence in the market, they inevitably leave traces. Our task was to learn how to identify these traces and interpret them correctly. Reversal First Impulse levels (RFI)   -  Version MT5                INSTRUCTIONS                 RUS                 ENG                                       R ecommended to use with an indicator   -  
ご紹介   クォンタム トレンド スナイパー インジケーターは 、トレンド反転を特定して取引する方法を変革する画期的な MQL5 インジケーターです。 13年以上の取引経験を持つ経験豊富なトレーダーのチームによって開発されました。     クォンタムトレンドスナイパーインジケーター   は、非常に高い精度でトレンドの反転を識別する革新的な方法で、あなたのトレーディングの旅を新たな高みに押し上げるように設計されています。 ***Quantum Trend Sniper Indicatorを購入すると、Quantum Breakout Indicatorを無料で入手できます!*** クォンタム ブレイクアウト インジケーターは、トレンドの反転を特定するとアラートを発し、矢印を示し、3 つのテイクプロフィットレベルを提案します。 初心者トレーダーにもプロのトレーダーにも適しています。 量子EAチャネル:       ここをクリック MT5のバージョン:       ここをクリック 推奨事項: 期間: すべての時間枠。最良の結果を得るには、
ご紹介     Quantum Breakout PRO は 、ブレイクアウト ゾーンの取引方法を変革する画期的な MQL5 インジケーターです。 13年以上の取引経験を持つ経験豊富なトレーダーのチームによって開発された Quantum Breakout PROは 、革新的でダイナミックなブレイクアウトゾーン戦略により、あなたの取引の旅を新たな高みに押し上げるように設計されています。 クォンタム ブレイクアウト インジケーターは、5 つの利益ターゲット ゾーンを備えたブレイクアウト ゾーン上のシグナル矢印と、ブレイクアウト ボックスに基づいたストップロスの提案を提供します。 初心者トレーダーにもプロのトレーダーにも適しています。 量子EAチャネル:       ここをクリック MT5バージョン:   ここをクリック 重要!購入後、インストールマニュアルを受け取るためにプライベートメッセージを送ってください。 推奨事項: 時間枠: M15 通貨ペア: GBPJPY、EURJPY、USDJPY、NZDUSD、XAUUSD アカウントの種類: ECN、Raw、また
Advanced Supply Demand
Bernhard Schweigert
4.92 (310)
現在33%オフ 初心者にもエキスパートトレーダーにも最適なソリューション このインジケーターは独自の機能と新しい公式を多数内蔵しており、ユニークで高品質かつ手頃な取引ツールです。このアップデートでは、2つの時間枠ゾーンを表示できるようになります。より長いTFだけでなく、チャートTFとより長いTF(ネストゾーンを表示)の両方を表示できます。すべてのSupply Demandトレーダーの皆さんのお気に召すはずです。:) 重要情報の公開 Advanced Supply Demandの可能性を最大化するには、 https://www.mql5.com/ja/blogs/post/720245 にアクセスしてください。   エントリーまたはターゲットの正確なトリガーポイントを正確に特定できれば取引がどのように改善されるか想像してみてください。新しい基盤となるアルゴリズムに基づいて構築されているため、買い手と売り手の間の潜在的な不均衡をさらに簡単に特定できます。これは、最も強い需要と供給のゾーンと、過去のパフォーマンス(古いゾーンを表示)がグラフィカルに表現されるためです。これらの機能は、最適
通貨強さウィザードは、取引を成功させるためのオールインワン ソリューションを提供する非常に強力な指標です。このインジケーターは、複数の時間枠のすべての通貨のデータを使用して、このまたはその外国為替ペアのパワーを計算します。このデータは、使いやすい通貨インデックスと通貨パワーラインの形式で表され、特定の通貨のパワーを確認するために使用できます。 必要なのは、取引したいチャートにインジケーターを接続することだけです。インジケーターは、取引する通貨の実際の強さを示します。このインジケーターは、トレンドに合わせて取引するときに有利に利用できる売買高の圧力の極値も示します。このインジケーターには、フィボナッチに基づく可能なターゲットも表示されます。 このインジケーターは、PUSH 通知を含むあらゆるタイプのアラートを提供します。 購入後ご連絡下さい。私の取引のヒントをあなたと共有し、素晴らしいボーナスインジケーターを無料で提供します! 幸せで有益な取引をお祈りします。
カスタムMT4インジケーターで外国為替取引を成功させるための秘密を発見してください! 外国為替市場で成功を達成し、リスクを最小限に抑えながら一貫して利益を得る方法を疑問に思ったことはありますか? これがあなたが探している答えです! 取引へのアプローチに革命をもたらす独自のMT4インジケーターを導入できるようにします。 ユニークな汎用性 私たちのインジケータは、RenkoとRangeBarのろうそくのフォーメーションを好むユーザー向けに特別に設計されています。 これらのチャートタイプは多くの経験豊富なトレーダーに好まれていることを理解しています。そのため、私たちのインジケーターはそれらとシームレスに統合され、比類のない市場分析を提供します。 クリアトレンドシグナル 複雑な分析を忘れてください! 私たちのインジケーターは、鮮やかな色と明確なドット構造を利用して、市場の動向を明確に示しています。 赤と青の点は、価格の動きの方向性について疑いの余地がなく、取引の迅速な意思決定を可能にします。 HH/HL HL/LL戦略とのアライメント HH/HLおよびHL/LL構
Break & Retest is unstoppable when combined with our other divergence indicator. After purchase, send us a message and you could get this  2nd indicator  for  FREE  as a  BONUS! ‍You can visually backtest Break & Retest to see how it behaved in the past!    Manual guide:   Click here $59  for the first 25 copies ( 4  left)! Next price is $120 .  After many months of hard work and dedication, we are extremely proud to present you our  Break and Retest price action indicator crea
驚異的なFXインジケーター「Miraculous」をご紹介します。完璧な結果を得るための1時間足を含むすべてのタイムフレームで効果的に機能する、最強の強力な特殊MT4フォレックスインジケーターです。 すべてのタイムフレームで優れた結果を提供する最高のFXインジケーターを探し続けるのに疲れましたか?これ以上探す必要はありません!「Miraculous」フォレックスインジケーターをご紹介します。このインジケーターは、トレーディングの経験を変革し、収益を新たなレベルに引き上げるために設計されました。 先進のテクノロジーと長年にわたる緻密な開発に基づいて構築された「Miraculous」フォレックスインジケーターは、FX市場における力と正確さの頂点となります。この素晴らしいツールは、すべてのレベルのトレーダーのニーズを満たすように設計されており、一貫した収益性を追求する上で比類のない優位性を提供します。 「Miraculous」フォレックスインジケーターの他との違いは、その非常に適応性にあります。デイトレーダー、スウィングトレーダーであろうと、長期ポジションを好む方であろうと、このインジケータ
これはMT4のインジケーターで、再描画なしで取引に参入するための正確なシグナルを提供します。 外国為替、暗号通貨、金属、株式、インデックスなど、あらゆる金融資産に適用できます。かなり正確な見積もりを提供し、取引を開始して終了するのに最適な時期を教えてくれます。1つのシグナルを処理しただけでインジケーターの元が取れた例の 動画 (6:22)をご覧ください。Entry PointsPro インジケーターの助けを借りたほとんどのトレーダーの最初の1週間の結果が改善しています。 Telegramグループ に登録してください。Entry Points Proインジケーターのメリットは次の通りです。 再描画のないエントリーシグナル 再描画されるインジケーターでは一度表示されたシグナルが削除されて大きな金銭的損失につながることがありますが、これと異なり、表示されて確認されたシグナルは消えることがありません。 エラーなしの取引開始 インジケーターアルゴリズムによって取引を開始する(資産を売買する)理想的な瞬間を見つけることができます。それを使用するすべてのトレーダーの成功率が向上します。
TrendDecoder Premium
Christophe, Pa Trouillas
5 (3)
レンジと次の動きを特定    |  トレンドの最も早いシグナルと強さを得る   |  反転の前に明確な出口を得る   |  価格がテストするフィボ・レベルを見つける。 非リペイント、非遅延インディケータ - マニュアルおよび自動売買に最適 - すべての資産、すべての時間単位に対応 期間限定キャンペーン   >> 50%OFF 購入後、 推奨セッティングについては、このチャンネルで私に連絡してください。 MT5 バージョン: ここをクリック BladeSCALPER   と   PowerZONES   を使った完全な方法を入手する どのようなものですか? TrendDECODERは、トレンド監視をシンプルかつ簡単にするための複数のイノベーションを集約したものです。 Projective TrendLine (投影トレンドライン) - 今後のトレンドのスピードリファレンス。 RealTime TrendLine vs. Projective TrendLine (リアルタイムトレンドライン vs. Projective TrendLine) - 市場が同じ方
複数通貨と複数フレームの売買に関するアラート。 自動トレーリングストップとリスク報酬で利益を獲得! インジケーターが市場をスキャンして分析するため、何もする必要はありません。 1 つのチャートですべての通貨を取引しましょう!   購入後、コメントを残して私に連絡してください。トレードアシスタントEAをお送りします。 このインジケーターはいくつかのオシレーターと付属のフィルターを使用して、最良の確認されたエントリーポイントを見つけますので、それについて心配する必要はありません。 警告が表示され、監視することを選択したすべての時間枠と通貨のボタンが描画されます。 ボタンを押すだけでチャートに移動し、取引を開始できます。 このインジケーターは、すべての基本通貨と市場監視通貨の強さパネルも描画します (設定で調整可能)。これにより、すべてのペアの通貨と選択されたより高い時間枠が表示されます。 インジケーターウィンドウ: チャート通貨のトレンドフィルターとマルチタイムフレームトレンドパネルを備えた特別なMACDヒストグラム! すべての通貨と時間枠の取引アラートを提供し、
TrendMaestro
Stefano Frisetti
5 (2)
note: this indicator is for METATRADER4, if you want the version for METATRADER5 this is the link: TRENDMAESTRO recognizes a new TREND in the bud, he never makes mistakes. The certainty of identifying a new TREND is priceless. DESCRIPTION TRENDMAESTRO identifies a new TREND in the bud, this indicator examines the volatility, volumes and momentum to identify the moment in which there is an explosion of one or more of these data and therefore the moment in which prices have strong probability of f
FX Volume
Daniel Stein
4.6 (35)
mql5と Telegramの モーニング・ブリーフィングで、詳細とスクリーンショットを含む毎日のマーケット・アップデートをご覧 ください! FX Volumeは、ブローカーの視点から市場のセンチメントをリアルに洞察する、最初で唯一の出来高インジケーターです。 ブローカーのような機関投資家が外国為替市場でどのようなポジションをとっているか、COTレポートよりもはるかに速く、素晴らしい洞察を提供します。 この情報をチャート上で直接見ることは、あなたの取引にとって真のゲームチェンジャーであり、画期的なソリューションです。 以下のようなユニークなマーケットデータ洞察から利益を得てください。 比率は 、通貨のロングポジションとショートポジションの比率をパーセントで表示します。 比率の変化は 、選択した期間内のロング比率とその変化率を表示します。 Volumes Totalは 、通貨の取引量(ロングとショート)の合計をロット単位で表示します。 Volumes Long :全通貨のロングポジションの取引量を表示します。 Volumes(ショート )は、全通貨のショートポジションの取引量を表示
Price Action Entry Alerts
Stephen Sanjeeve Sahayam
5 (3)
このインジケーターは、売買圧力についてすべてのバーをスクリーニングし、最大量の 4 種類のローソク足パターンを特定します。次に、これらのローソク足はいくつかの線形フィルターを使用してフィルター処理され、買いまたは売りのシグナルが表示されます。シグナルは、より高い時間枠の方向と組み合わせて、取引量が多い時間帯に取引される場合に最も効果的に機能します。すべてのフィルターはカスタマイズ可能で、独立して動作します。ボタンをクリックするだけで単一方向の信号を表示できます。 このインジケーターには、意思決定プロセスに役立つ最も重要な価格アクションとスマート マネーの概念も組み込まれています。 シグナルとトレードに関する教育をすべて 1 つのツールにまとめました。 特徴: 信号は再描画されません。 飲み込むキャンドル、拒否キャンドル、拡張範囲キャンドル、ピンバーを識別します。 有効なシグナルごとに複数のエントリー、ストップロス、複数のテイクプロフィットレベルを表示します。 大容量セッションでフィルタリングします。 サポート/レジスタンスレベルとローソク足の構造でフィルターします。 MACD ヒ
現在31%オフ! 初心者やエキスパートトレーダーに最適なソリューション! このインジケータは、独自の機能と秘密の数式を組み込んだ、ユニークで高品質かつ手頃な価格のトレーディングツールです。たった1枚のチャートで28の通貨ペアのアラートを表示します。新しいトレンドやスキャルピングチャンスの引き金となるポイントを正確に把握することができるので、あなたのトレードがどのように改善されるか想像してみてください! 新しい基本的なアルゴリズムに基づいて構築されているため、潜在的な取引の特定と確認がより簡単になります。これは、通貨の強さや弱さが加速しているかどうかをグラフィカルに表示し、その加速のスピードを測定するためです。加速すると物事は明らかに速く進みますが、これはFX市場でも同じです。つまり、反対方向に加速している通貨をペアにすれば、利益を生む可能性のある取引を特定することができるのです。 通貨の勢いを示す縦の線と矢印は、あなたの取引の指針となるでしょう。 ダイナミックマーケットフィボナッチ23レベルはアラートトリガーとして使用され、市場の動きに適応します。もしインパルスが黄色
How to use Pair Trading Station Pair Trading Station is recommended for H1 time frame and you can use it for any currency pairs. To generate buy and sell signal, follow few steps below to apply Pair Trading Station to your MetaTrader terminal. When you load Pair Trading Station on your chart, Pair Trading station will assess available historical data in your MetaTrader platforms for each currency pair. On your chart, the amount of historical data available will be displayed for each currency pai
mql5と Telegramの モーニング・ブリーフィングで、詳細とスクリーンショットを含む毎日のマーケット・アップデートをご覧 ください! FX Power MT4 NGは 、長年の人気を誇る通貨強度計FX Powerの次世代モデルです。 この次世代ストレングスメーターは何を提供するのでしょうか?初代FXパワーの魅力すべて プラス GOLD/XAUの強さ分析 より正確な計算結果 個別に設定可能な分析期間 カスタマイズ可能な計算上限値により、さらに優れたパフォーマンスを実現 もっと見たい人のための特別なマルチインスタンス設定 すべてのチャートでお好みの色を無限に設定可能 数え切れないほどの通知オプションにより、重要なことを見逃すことはありません。 Windows 11とmacOSのスタイルで角を丸くした新しいデザイン 魔法のように動くインジケーターパネル FXパワーの主な機能 すべての主要通貨の強さの完全な履歴 すべての時間枠における通貨の強さの履歴 すべてのブローカーとチャートで同一の計算結果 100%信頼できるリアルタイム計算 -> リペイントなし ドロップダウン・リストから
PRO Renko Systemは、特別にRENKOチャートを取引するために設計された高精度の取引システムです。 これは、様々な取引商品に適用することができる普遍的なシステムです。 システムは効果的に正確な逆転信号へのアクセスを与えるいわゆる市場の騒音を中和する。 表示器は非常に使いやすく、信号の生成に責任がある1つの変数だけがあります。 あなたは簡単にお好みの任意の取引ツールとレンコバーのサイズにツールを適応させることができます。 私はいつもあなたが私のソフトウェアで収益性の高い取引を支援するために余分なサポートを提供する準備ができています! 私はあなたに幸せで収益性の高い取引をしたいです! ご購入後にご連絡ください! 私はあなたに私のレンコチャートジェネレータを送信します。 私はまた、私の個人的な推奨事項やシステムの他のモジュールを無料で共有します!
まず最初に、このトレーディングシステムがリペイントされず、再描画されず、遅延しないことを強調する価値があります。これにより、プロのトレーディングに最適な状態になります。 「スマートサポートアンドレジスタンストレーディングシステム」は、新規および経験豊富なトレーダー向けにカスタマイズされた高度なインジケーターです。この包括的なシステムは、7以上の戦略、10のインジケーター、およびデイトレード戦略、スイングトレード戦略、サポートおよびレジスタンス戦略、ローソク足パターン戦略、VWAP戦略、マルチタイムフレームトレンド戦略など、さまざまなトレーディングアプローチを組み合わせています。これは、矢印信号、エントリーポイント、出口ポイント、トレードアラート、より高い時間枠のトレンド分析、リアルタイムのトレードモニタリング、そして洞察力のあるトレンドとボリュームキャンドルの着色を提供します。自動的なサポートとレジスタンスの検出により、さまざまな市況下でトレーダーが的確な決定を下すのを支援する多面的なインジケーターとなっています。 スマートサポートアンドレジスタンストレーディングシステムは、
Cycle Sniper
Elmira Memish
4.4 (35)
NEW YEAR SALE PRICE FOR LIMITED TIME!!! Please contact us after your purchase and we will send you the complimentary indicators to complete the system Cycle Sniper is not a holy grail but when you use it in a system which is explained in the videos, you will feel the difference. If you are not willing to focus on the charts designed with Cycle Sniper and other free tools we provide, we recommend not buying this indicator. We recommend watching the videos about the indiactor and system before pu
プレシジョン・インデックス・オシレーター(Pi-Osc)は、Precision Trading SystemsのRoger Medcalfによるものです。 バージョン2は、チャートにスーパーファストでロードされるように注意深く再コードされ、その他の技術的な改良も組み込まれて、エクスペリエンスを向上させています。 Pi-Oscは、市場が強制的に行かなければならない、すべての人のストップを取り除くためのポイントである、極限のエクソースト・ポイントを見つけるために設計された正確な取引タイミング信号を提供するために作成されました。 この製品は、極限のポイントがどこにあるかを知るという古代の問題を解決し、トレーダーの生活をはるかにシンプルにします。 これは、業界標準のオシレーターとは異なる強力な要素を持つ高度なコンセンサス・インジケーターです。 使用されている一部の機能には、需要指数、マネーフロー、RSI、スティリング、パターン認識、出来高分析、標準偏差の極値などがあり、異なる長さでこれらのバリエーションが多く含まれています。 初めて見ると、訓練されていない目には、他の
TakePropips Donchian Trend Pro
Eric John Pajarillaga Aldana
4.82 (17)
TakePropips Donchian Trend Pro   (MT4) は、ドンチャン チャネルを使用してトレンドの方向を自動的に検出し、エントリーとエグジットの取引シグナルを提供する強力で効果的なツールです! この多機能インジケーターには、トレンド スキャナー、取引シグナル、統計パネル、スクリーナー、取引セッション、およびアラート履歴ダッシュボードが含まれます。取引シグナルを提供し、チャートを分析する時間を節約するように設計されています! ユーザー マニュアルとインストール ガイドは、ブログ投稿 (   https://www.mql5.com/en/blogs/post/751368   ) からダウンロードできます。 今日は 50% オフ! 98ドルから49ドルに値下げ! このインジケーターは、ストラテジー テスターでテストできます (ビジュアル モードを有効にします)。ライブ チャートでテストしたい場合は、7 日間の試用版を入手するようにメッセージを送ることもできます。 詳細については、説明の下にあるビデオ チュートリアルも利用できます。 ご不明な点やサポートが必
作者のその他のプロダクト
It identifies the pivot, support, and resistance price levels of the selected timeframe and then draws lines onto the chart. FEATURES: Option to specify the Timeframe Period in the PivotSR calculation. Option to display the PivotSR of the last candle, of every candle, or of the current candle. Options for displaying labels, line thickness, and line color. PivotSR can be interpreted as reversal levels or past price reactions that can be used as the basis for current price analysis. Some traders b
FREE
It works based on the Stochastic Indicator algorithm. Very useful for trading with high-low or OverSold/Overbought swing strategies. StochSignal will show a buy arrow if the two lines have crossed in the OverSold area and sell arrows if the two lines have crossed in the Overbought area. You can put the Stochastic Indicator on the chart with the same parameters as this StochSignal Indicator to understand more clearly how it works. This indicator is equipped with the following parameters: Inputs d
FREE
PullbackMatrix provides the key information of the trading transactions when it finds the right market moment based on its built-in logic algorithm. The high accuracy signals including Trading Symbol, Entry Price, Entry Time, TakeProfit, Stoploss, and more. And that's all will be available instantly in your chart panel, drawing the position lines and also sending signal notification to email, mobile phone, and screen popup. More important is that also saves signals into a .csv file which is usef
It is a custom non-repaint indicator to identify trade opportunities in swing action as prices move within an upper and lower band. Inspired by the Keltner Channel, the most popular channel Indicator introduced by Chester Keltner. It is different with a Bollinger Bands. It represents volatility using the high and low prices, while Bollinger's studies rely on the standard deviation. The algorithm for this indicator is also available in the EntryMaximator EA. Including the option to use it or not.
FREE
Provides instant signals on the chart in panel form. Equipped with signal description and trading analysis tools such as drawing auto trendlines, support/resistance area, regression channel, Fibonacci levels, Pivot levels and current signal price, signal time, signal expiry and stoploss recommendation. Also sending alert messages to all available mt4 alert tool. A detailed description panel provides information about where the signal comes from and what indicators are behind the signal. Includin
All in one Indicator. Multiple market analysis tools. Non-Repaint Oscillator signals, Trend lines, Price channel, Fibonacci levels, Support and Resistance, Regression, Pivot levels, Candle Strength and Oversold/Overbought line detector. Includes buttons to hide or show. Advanced algorithms to detect important reversal points and draw trend lines or shapes automatically in appropriate areas. A simple and professional chart display, user friendly and easier to understand for faster and accurately
This is the countdown of the last candle Indicator. How much time remains in the current candle of your chart CTime display exactly how many hours, minutes and seconds remain before the current candle closes, and a new one opens. This allows you to be on the ball as soon as the next candle appears It could be useful for a trader who trades with candles as the main attention Available option to change the text color to suit the chart background. This Indicator is related to the system here .
FREE
It is based on Multiple EMA indicators. The idea is that how to display multiple Exponential Moving Averages on the chart easily without placing them one by one. It has also BLUE-RED trend lips to define UPTREND and DOWNTREND whichas BLUE is UPTREND and RED is DOWNTREND.You can change the colors by going to Indicator properties --- colors. There are 2 external setting. They are Period and Shift. When you change them (period and or shift ) then all will automatically adjust. For any currency pair
Range Multi Alligators provides Range Channel High Low Information and the market trend indicated by the blue-red Histogram in the middle of range channel. The range channel lines is useful to define stoploss and take profit. This is trend follower indicator based on the Multi Alligators. Attach it on the chart and change one or all setting then all lines will move synchronously with the current one. Parameters Period : the number of bars used for the indicator calculations. Default: 120 used
Stochastic Candles Indicator   It will convert the stochastic indicator from separate window to the chart window by drawing oversold-overbought coloring candles. Red is overbought and blue is oversold by default.And you can change the color later on the external indicator setting.This is Multi timeframe  indicator that means it can show appearance result from another timeframe.E.g: If you set timeframe H1 then it will draw candles from Timeframe H1 whatever timeframe you attach on. It will be us
Autobot Retracement Code (ARC) A robot trading that works based on retracement strategy while following the market trend.It has  made average profits up to 25% /month that is relatively a High Return of Investment.Real Account proof. Fully automation. Auto Lot sizing, Auto TakeProfit Calculation, Auto StopLoss Calculation. Currently Running on Real account , it has more than 100% growth / 5 months. NEW UPDATE RELEASED, VERSION 3.0  FEATURES on Version 3: FIFO rules Auto LotSize Auto StopLoss
Order Management EA (OME). The software will manage your trades based on 2 options: Magic Number or Order Comment. Both the Trades from the other EA or from Manual Trading. Drawing Stop Loss/Take Profit, Close All the positions, manages Multiple Orders, determining grid range and entry signals automatically.  Sending Martingale Orders, if necessary, that can be turn off/on. Including 2 options lot calculation: Multiplication or Addition.  You install OME in your account, you place order, and it
Strategy – Bollinger Band, Moving Average and Price Actions. Bollinger Bands to identify High-Low Price, Moving Average to identify Trend and Price Action is to synchronize both of them.  SardaFx 4.1 has average holding time 24 hours (1 day) on timeframe H1. It is not a Martingale EA or Averaging EA. The work is simple, BUY and Exit or SELL and Exit. No recurring BUY and or SELL in the same time and the same symbol except you adjust Max BUY/SELL  more than 1,default setting is 1 BUY and 1 SELL.
Some informations on the chart with the single attachment. RangeBorder Buy Sell (RBBS) Non Repaint Indicator will provide trend line, buy sell arrows,reversal arrows, range channel, order exit area,high average price line and low average price line.All arrows and lines don't repaint and not lagging. Once candle closed it won't  repaint. Reading Indicator: 1. Small Stars , Indicates oversold and overbought with certain logic and price may reverse when this small star triggers. Useful to identif
Oversold and Overbought Candles, Trendlines, and BUY-SELL arrows in the single Indicator. Built from 8 default MT4 Indicators. Stochastic,RSI,SAR,CCI,RVI,DeMarker,WPR and MA. It is " NON REPAINT " indicator. All buffers do not repaint.  Double Trendline buffers that can also be used to identify sideway market and support resistance area.  Any timeframes and any currency pairs. Parameters: Show Trend . TRUE/FALSE to show trendlines on the chart Follow Trend. If TRUE , Dapitrend will show on
TrendWavePattern  an another way to trade with a harmonic pattern, a maestro classic pattern . I made some improvements and combinations with my own strategy. Trend direction, buy-sell signal ,hi-low area and pivot line. These will be helpful for trader to read the current market condition. So it is not blindly following the pattern itself but also following other informations from the market. Readable chart appearance . Designed to be user friendly even you are a new trader. BUY-SELL zone, Ta
This is MT4 version of StochScanner It scans Stochastic from Multi Symbols and Multi Timeframes and displayed on the dashboard on a single chart. . 4 scanning modes: 1. Mode OverBought/OverSold Indicator scans Overbought and OverSold . OverBought : current stochastic is above level 80 and OverSold : current stochastic is below level 20 2. Mode Signal It means if the previous stochastic is on OverBought or OverSold ( either Main Line and Signal Line ) and the current Main Line cross over the curr
It is an expert advisor that scans the last patterns on defined symbols and timeframes . Multi Symbols /pairs , Multi timeframes .  There are 2 ways to specify symbols : Automatically scan all symbols available on the market watch (true/false) Type any symbols ,separated by comma.   There are also 2 ways to specify timeframes : Automatically scan all timeframes available on mt4 (true/false) Type any timeframes,separated by comma.   Unlimited symbols available in an account and unlimited timefr
Lemurian Trader is a multi symbols  EA/robot. User can input symbols in the external parameter separated by comma. Only need to place on the single chart, no need to open multiple chart,no limited symbols as long the symbol is available on the market watch. Sweeping signals from timeframe M15 to H4 on each symbol to find the best high/low price while it also keeps to follow the trend. Lower TF M15 as a signal and higher(M30,H1,H4) to indentify trend and high low. It means whatever timeframe we p
RSI Scanner Plus Indicator scans RSI values in multiple symbols and timeframes. Plus trend line buffer on the chart.  Features: -Trend Line :  We add trend line on the chart in the hope it help you to see current trend on the chart while following oversold and overbought  from RSI. This is additional feature in the indicator. We consider that following the trend is very important in trading. -Changeable Panel Display :  Change the value of Max.Symbols/Panel and  the indicator will adjust the d
TrendScanner XTra scans market trends from Multi Symbols and Multi Timeframes with extra additional Entry Point Signals arrow on the current chart. Features: -Entry Point SIgnals :  This is additional feature in the indicator. No repaint arrows. The Trading system in the single indicator. MTF Trend informations and Entry Signals. In order to make it easier for trader to get trading moments from a single chart and  deciding entry time.  -Changeable Panel Display :  Change the value of Max.Symbo
Non-repaint indicator    to identify trade opportunities in swing action as prices move within an upper and lower band. Inspired by the Keltner Channel, the most popular channel Indicator introduced by Chester Keltner. It is different with a Bollinger Bands. It represents volatility using the high and low prices, while Bollinger's studies rely on the standard deviation. Customized by adding the trends exactly in the middle line, arrows when price cross over the outer lines and Fibonacci Levels L
A professional trading indicator with double-entry options. Valuable Smooth Channel Lines on the separated window, Trend Lines both on the main window, and separated window and entry arrows. Good for trading scalping in the lower timeframes. Even also it can work and provide signals in the higher timeframes for longer-term trading periods.  INDICATOR SETTINGS: 1.  Signal Mode. There are 2 options: Default and Compact. If Default, it will provide 3 different arrow codes on the main window. This o
Provides Regression Channel on the current chart. Combined by Trend of Moving Averages and Multi timeframes Oscillator Indicators: CCI, RSI, Stochastic, and MACD with specific working logic . It could make us easier to identify swing high-low as an entry point, the retracement area while following the current trend. Consists of 2 types of signal, main and secondary. The main signal will draw very clearly triangle and lines on the chart with the word " BUY" or 'SELL'. and the secondary is the sta
It could help to calculate Risk-Reward easily before placing a BUY-SELL position. TradeSizeCalculator is a Multi-Tasking Calculator. It will calculate the others when we define the value in one of the columns. Stoploss, risk percentage, risk-money, lot size, take-profit , reward-money, and reward-ratio. Depending on which value is changed. All values in the columns are editable. Also, we can get those calculation results by drag-drop the stop-loss/take-profit line. Parameter: The inputs below ar
MACD Scanner provides the multi symbols and multi-timeframes of MACD signals. It is useful for trader to find the trading idea quickly and easily. User-friendly, visually clean, colorful, and readable. Dynamic dashboard display that can be adjusted thru the external input settings. Total Timeframes and Total symbols as well as the desired total rows/panel, so it can maximize the efficiency of using the chart space. The Highlight Stars on the certain matrix boxes line based on the selected Scan M
It has 3 capabilities at once and can be adjusted according to needs. Full Auto, Semi-Auto, or Warning Signals only. You can choose it by setting the parameters provided. Built to help Traders work much easier than doing it manually. Sharpen the accuracy of market analysis performed by a Trader by only executing in certain price areas and adjustable signal parameters. Features Ability to manage trading management, including automatically determining stop loss/take profit, calculating lot size ba
GU Spot is a One Shot One Kill EA. A  Scalping EA   for GBPUSD .   No Martingale, No Averaging, No Grid or other high-risk strategies.  Working with up to the best 100 trading signals algorithm from various Trading Systems. The combination of Price Action, High Low, Trend, Range Levels, Pullback /  Retracement and Reversal. This is Fully Automatic Trading Robot . High Accuracy Entry Signals and protected by a proper Money Management. A tight Stop Loss with SL:TP ratio 1:3 by default, Trailing an
SignalPinner is a trend line Indicator which can detect market trends early by including three types of signal arrows. Non repaint and trend following. Signals on the strong trend, signals in the beginning of trend and signals with multiple market analysis algorithm as the main signals. Supported by alert notification message to keep you getting signals while on the go. Symbols: Any Timeframes: Any Features Histogram buffers as a sign the trend is started. It can help the trader knowing the ma
Scanning   Multi Symbols Scalping Signals based on 3 kinds of Market Analysis methods. Trend, Signal, and Reversator. And each method consists of its own multi timeframes algorithm functions. Summarized to become clear signals direction BUY/SELL, including the signals strength scoring and sending message to all available alert tools. Displayed on a User Friendly and customizable Dashboard. Size, colors, coordinates, highlight, hidden/show and more. Base Timeframe: M15. And M5 to Daily to confirm
フィルタ:
elite luis
3331
elite luis 2023.03.22 17:09 
 

Looks Good, Author very helpful and prompt to support, Excellent 5 stars!

dev1981
337
dev1981 2023.03.02 11:30 
 

First trade....indicator cost covered...excellent technical indicator...need to play more with settings for using it on HTF

Wartono
12005
開発者からの返信 Wartono 2023.03.06 18:19
Great to hear that. Happy Trading and Good Luck!
Aravind Kolanupaka
8835
Aravind Kolanupaka 2022.07.21 19:48 
 

Good one! Nicely done indicator.

Wartono
12005
開発者からの返信 Wartono 2023.03.06 18:21
Thank you Aravind Kolanupaka. Always success for you
レビューに返信
バージョン 1.40 2023.03.22
Improving the codes arrangement
バージョン 1.30 2021.06.04
Fix a bug to delete objects
バージョン 1.20 2021.06.04
No need ZigZag Indicator anymore. The logic is built in the codes
Faster and smooth