SessionLines US
- インディケータ
- バージョン: 1.0
- アクティベーション: 5
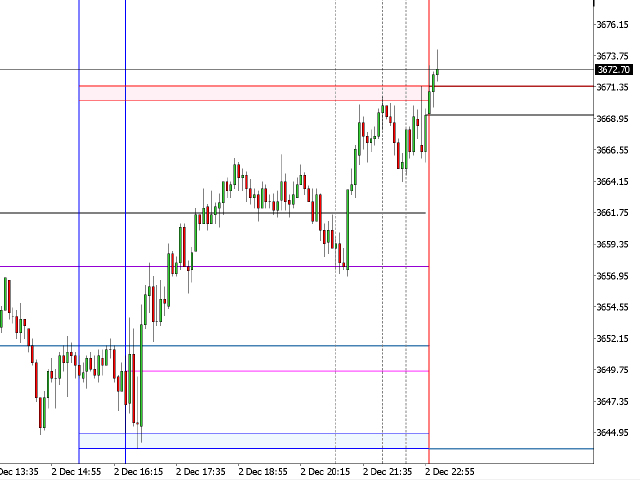
The SessionLines indicator for MT5 shows up the most important time intervalls and price levels in the US-Indices .
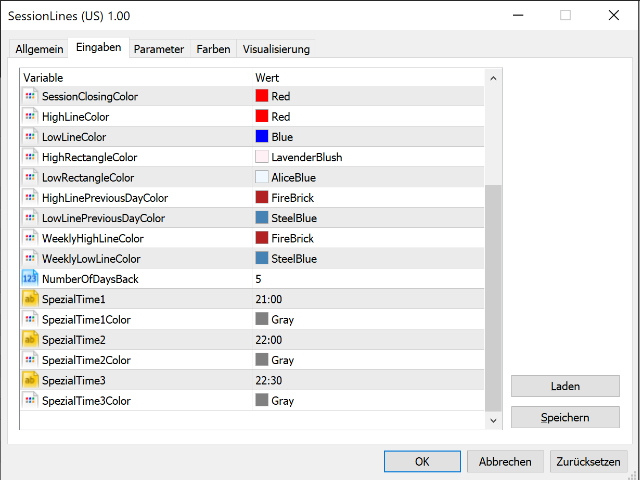
The following times get marked: Opening Time US Futures, Opening Time US Kassas, Closing Time US Kassas, Spezial Times,
The following price levels get marked: Daily High/Low, Previous Daily High/Low, Weekly High/Low, Opening and Cloth Levels of Futures Daily (inkl. Previous Day).