• 概要
  • レビュー (22)
  • コメント (63)
  • 最新情報

Support and resistance levels

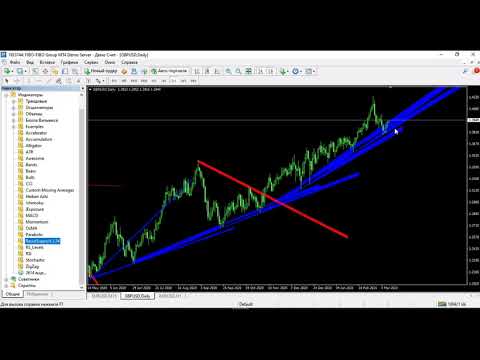
サポート と 抵抗レベルインジケーター( Support and resistance )をダウンロードできます。

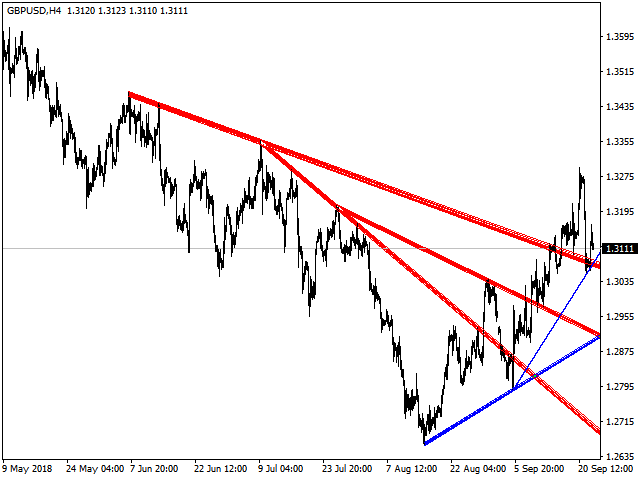
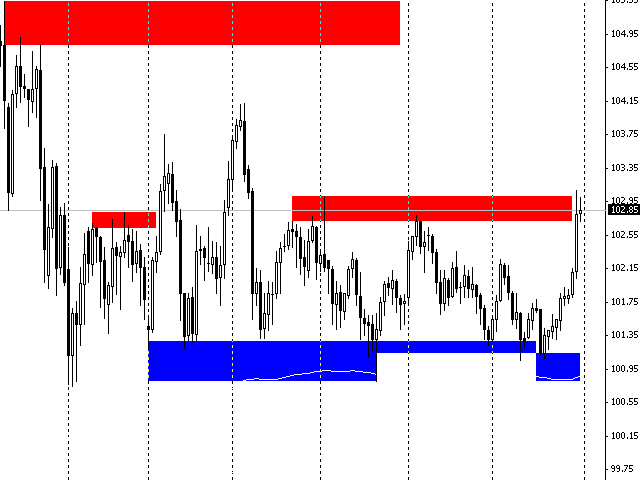
インジケーターは、水平とトレンドのサポートと抵抗レベルを 表示します 。

インジケーター設定:

  • トレンド( Trends

  • トレンド又は水平のサポートと抵抗レベルの表示モード設定

    • はい( Yes )-トレンドレベルしか表示しない

    • いいえ( No )- 水平 レベルしか表示しない

  • リソース使用( UseResource

  • インジケーターに組み込まれているリソースの使用モード設定。

    • はい( Yes )-商品リソースからのジグザグ( ZigZag )インジケーターを使用すること。

    • いいえ( No )-ジグザグ( ZigZag )ユーザーインジケーターを使用すること。

  • 履歴バー( HistoryBar

  • レベルが表示される履歴バーの数

  • バー数( CountBar

  • 現在のバーを始め、サポートと 抵抗レベル が検索されるバーの数

  • 商品で使用されている ジグザグ ( ZigZag ) インジケーターの設定 :

    • デプス( Depth

    • 前の値 より 偏差( Deviation )によってそれぞれ小さい(又は大きい)場合にジグザグ ( ZigZag )インジケーターが 2 番目の最大値(又は最小値)を構築しないローソク足の最小値;

    • 偏差( Deviation

    • ジグザグ( ZigZag ) インジケーターがローカルのトップ / ボトムを形成するための 2 つの隣のローソク足の 最大値 / 最小値 の間のポイント最小数;

    • バックステップ( Backstep

    • ローカルの最大値 / 最小値 の間のローソク足の最小数。


おすすめのプロダクト
デイリートレンドスカルパー(DTS) このインジケーターはRPTradeProSolutionsシステムの一部です。 DTSは、プライスアクション、ダイナミックサポート、レジスタンスを使用した毎日のトレンドインジケーターです。 誰でも使用できるように設計されており、トレーディングの初心者でも使用できます。 決して塗り直さないでください。 表示は近いものから近いものへと示されます。 単独で使用するように設計されているため、他のインジケーターは必要ありません。 一日の初めにトレンドと潜在的なテイクプロフィットを提供します。 どのように機能しますか DTSは、価格アクションと動的なサポートおよびレジスタンスを組み合わせたブレイクアウト戦略を使用しています。 夜のトレンドとボラティリティが分析され、翌日に使用されます。 この分析から、ブレイクアウト制限(青と濃いオレンジの線)とTakeProfitが決定されます 履歴データのおかげで、戦略と設定の「成功」を即座に確認できます。 履歴部分では、戦略に「穴」があるかどうかをすぐに確認し、最終的にはより適切な別のタイムフレームまたはシン
これは、従来のMACDよりも正確で使いやすいユニークなMACD指標です。 それはあらゆるチャートサイクルに適しており、あらゆる市場の種類に適しています。 赤い列は(Buy)バンドの信号、青い列は(Sell)バンドの信号です。 黄色と緑色の線は傾向線で、2本の線は交差しません。 購入する:青い列で、真ん中の0軸を通る緑色の線を見てください。 売り:赤い列で、真ん中の0軸の下の黄色い線を見てください。 MACDの形態信号からの偏差は99%正確です。 購入フォームからの逸脱:バンドの価格がバンドより低く、インディケータのインデックスがますます高くなっていますこの場合、すぐに買い注文をすることができます。 売りからの逸脱:バンドの価格がバンドより高く、インディケータのインデックスが小さくなってきているこの場合、売りシングルはすぐに実行できます。 注:指標の五芒星は、価格の変動により変化します。
The main idea of this indicator is rates analysis and prediction by Fourier transform. Indicator decomposes exchange rates into main harmonics and calculates their product in future. You may use the indicator as a standalone product, but for better prediction accuracy there is another related indicator - FreqoMaster - which uses FreqoMeterForecast as a backend engine and combines several instances of FreqoMeterForecast for different frequency bands. Parameters: iPeriod - number of bars in the ma
Trend PA
Mikhail Nazarenko
5 (3)
The Trend PA indicator uses   Price Action   and its own filtering algorithm to determine the trend. This approach helps to accurately determine entry points and the current trend on any timeframe. The indicator uses its own algorithm for analyzing price changes and Price Action. Which gives you the advantage of recognizing, without delay, a new nascent trend with fewer false positives. Trend filtering conditions can be selected in the settings individually for your trading style. The indicator
This is an arrow indicator without a future function,developed based on the most advanced profit trading algorithms.It has the most innovative and advanced dual trend analysis module, as well as the latest and highly effective market trend prediction algorithm.Trends are your friends, and following larger trends can earn the maximum profit in foreign exchange. This indicator helps traders identify current trends and track them. Someone once made a profit of 10 times in a week by relying on it.No
The indicator displays the signals of the RSX oscillator on the price chart. (To display these signals in a separate window, along with the oscillator, another indicator is used -  RSX Osc 4 AM ). It is optimal to use the indicator signals as signals to open a trade when the price overcomes the maximum or minimum of the bar at which the signal was given. An opposite signal cancels the previous signal. Settings: Data period for indicator calculation - data period for indicator calculation; Data
Owl smart levels
Sergey Ermolov
4.63 (54)
MT5版  |   FAQ Owl Smart Levels Indicator   は、 Bill Williams   の高度なフラクタル、市場の正しい波構造を構築する Valable ZigZag、エントリの正確なレベルをマークする Fibonacci レベルなどの一般的な市場分析ツールを含む 1 つのインジケーター内の完全な取引システムです。 利益を得るために市場と場所に。 戦略の詳細な説明 インジケータを操作するための指示 顧問-取引助手 プライベートユーザーチャット ->購入後に私に書いて、私はプライベートチャットにあなたを追加し、あなたはそこにすべてのボーナスをダウンロードすることができます 力はシンプルさにあります! Owl Smart Levels   取引システムは非常に使いやすいので、専門家にも、市場を勉強し始めて自分で取引戦略を選択し始めたばかりの人にも適しています。 戦略と指標に秘密の数式や計算方法が隠されているわけではなく、すべての戦略指標は公開されています。 Owl Smart Levels を使用すると、取引を開始するためのシグナルをすばやく確認し、
This unique multi-currency strategy simultaneously determines the strength of trends and market entry points, visualizing this using histograms on the chart. The indicator is optimally adapted for trading on the timeframes М5, М15, М30, Н1. For the convenience of users, the indicator renders the entry point (in the form of an arrow), recommended take profit levels (TP1, TP2 with text labels) and the recommended Stop Loss level. The take profit levels (TP1, TP2) are automatically calculated for
Trend Scanner
Vladimir Kalendzhyan
4.38 (8)
By purchasing this indicator, you have the right to receive a free copy of one of   my other indicator's or advisor’s!  (All future updates are included. No limits) . To get it , please contact me by  mql5 message ! The Trend Scanner trend line indicator displays the trend direction and its changes. The indicator works on all currency pairs and  timeframes. The indicator simultaneously displays multiple readings on the price chart: the support and resistance lines of the currency pair, the exist
This product is a part of  ON Trade Waves Patterns Harmonic Elliot Wolfe you can test free version on EURJPY from this link  Wolf Waves Indicator ウルフウェーブを発見しよう - あなたの究極の取引ツール! どんな時間軸でも簡単にウルフウェーブを見つけるための強力なツールを探していますか?もう探す必要はありません!私たちのウルフウェーブインジケーターは、その仕事を簡単にこなします。なぜこのインジケーターがあなたにぴったりか、以下でご紹介します。 主な特徴: 自動検出: ウルフウェーブインジケーターは、複雑なアルゴリズムを使用して、チャート上のキーポイントを自動的に見つけ、対応するラインを描画します。手動でパターンを探す手間が不要です。 使いやすさ: このインジケーターはシンプルなデザインで、経験豊富なトレーダーからウルフウェーブ初心者まで、誰でも簡単に利用できます。 高精度: 数多くのウルフウェーブインジケーターの中で、当社のものは完璧
インディケータは現在のクオートを作成し、これを過去のものと比較して、これに基づいて価格変動予測を行います。インジケータには、目的の日付にすばやく移動するためのテキスト フィールドがあります。 オプション: シンボル - インジケーターが表示するシンボルの選択; SymbolPeriod - 指標がデータを取る期間の選択; IndicatorColor - インジケータの色; HorisontalShift - 指定されたバー数だけインディケータによって描画されたクオートのシフト; Inverse - true は引用符を逆にします。false - 元のビュー。 ChartVerticalShiftStep - チャートを垂直方向にシフトします (キーボードの上下矢印)。 次は日付を入力できるテキストフィールドの設定で、「Enter」を押すとすぐにジャンプできます。
これは、キャンドルの終値を予測する指標です。 このインジケータは、主にD1チャートでの使用を目的としていますが. この指標は、従来の外国為替取引とバイナリオプション取引の両方に適しています。 インジケーターは、スタンドアロンのトレーディングシステムとして使用することも、既存のトレーディングシステムへの追加として機能させることもできます。 このインジケーターは、現在のキャンドルを分析し、キャンドル自体の内部の特定の強度係数と、前のキャンドルのパラメーターを計算します。 したがって、この指標は、市場の動きのさらなる方向性と現在のキャンドルの終値を予測します。 この方法のおかげで、この指標は、短期の日中取引だけでなく、中期および長期の取引にも適しています。 インジケーターを使用すると、市場の状況の分析中にインジケーターが生成する潜在的な信号の数を設定できます。 インジケーターの設定には、このための特別なパラメーターがあります。 また、インジケーターは、チャート上のメッセージの形式で、電子メールで、およびPUSH通知の形式で、新しい信号について通知することができます。 購入後は必ず私に書いて
フィボナッチリトレースと拡張ラインツール DiNapoliポイント取引方法とゴールデンセクション取引を使用するトレーダーにとって理想的なMT4プラットフォームのフィボナッチリトレースと拡張ラインツール 主な特長: あなたはフィボナッチリトレースメントの複数のセットを直接描くことができ、重要なリターンポイント間の関係は一目瞭然です。 2.フィボナッチ拡張を描画することができます。 3.フィボナッチフォールドバックとラインの延長は、簡単な観察と数値表示のために左右に動かすことができます。 4.チャートは非常に爽やかな 5.数字キーでサイクルを切り替えることができます。 ファンクションキー: 1。 [戻るを押す、要求に応じて描画する、最大8つのグループにする 2。拡張]を描くには[押す] 3。 \を押すと、現在のサイクルの下にあるすべての拡張機能と折り畳みが削除されます 4。フォールドバックを移動して削除して展開する (1)最初のフォールドバックセットのF5行をクリックします。 一度クリックすると(黄色に変わります)、キーボードのDel
Was: $249  Now: $99   Market Profile defines a number of day types that can help the trader to determine market behaviour. A key feature is the Value Area, representing the range of price action where 70% of trading took place. Understanding the Value Area can give traders valuable insight into market direction and establish the higher odds trade. It is an excellent addition to any system you may be using. Blahtech Limited presents their Market Profile indicator for the MetaTrader community. Ins
Forex Gump
Andrey Kozak
2.83 (6)
Forex Gump is a fully finished semi-automatic trading system. In the form of arrows, signals are displayed on the screen for opening and closing deals. All you need is to follow the instructions of the indicator. When the indicator shows a blue arrow, you need to open a buy order. When the indicator shows a red arrow, you need to open a sell order. Close orders when the indicator draws a yellow cross. In order to get the most effective result, we recommend using the timeframes H1, H4, D1. There
Simple to read and powerful, no fancy lines and drawings to clutter your chart or distract you. The trend probability oscillator estimates how likely a trend will continue in a certain period. The cummulator period controls how many bars in the past to use and is a proxy for the timescale the trend probability should hold. The use of a Max Line improves this further by indicating when a trend is likely to reverse. In most cases a trend must lose momentum before reversing. Hence, a trend probabil
The indicator provides a superior alternative to price action analysis. It enables the identification of normalized patterns, which are then transformed into a graphical representation to forecast future steps within a time series. In the top-left corner, you'll find information regarding the expected prediction accuracy, determined through a complex MSQE calculation. You have the flexibility to adjust the time window, making it easy to validate the indicator's performance. Additionally, you can
This is a trend indicator without redrawing Developed instead of the binary options strategy (by the color of the Martingale candlestick) Also works well in forex trading When to open trades (binary options) A signal will appear in the place with a candle signaling the current candle It is recommended to open a deal for one candle of the current timeframe M1 and M5 When a blue dot appears, open a deal up When a red dot appears, open a trade down. How to open trades on Forex. When a signal is rec
The indicator shows the potential trend direction by cyclical-wave dependence. Thus, all the rays of the intersection will be optimal rays, in the direction of which the price is expected to move, taking into account the indicator period. Rays can be used as a direction for potential market movement. But we must not forget that the approach must be comprehensive, the indicator signals require additional information to enter the market.
The arrows are calculated with: -     2 Parabolic  parameters -     2 ADX parameters -     4 Stochastic parameters We recommend to combine it with Parabolic, ZigZag or Elliot waves indicator. Always trade the trend! If you make sure to draw your trend lines and support/resistance zones you will just have to wait for the signal to appear. Take the trade. For Binary Options it is advisable to set the expiry time to 5-15 min in M1 chart. THIS INDICATOR IS ZERO REPAINT Best assets to trade: -
This indicator is another variant of the famous powerful indicator Fibonacci-SS https://www.mql5.com/en/market/product/10136 but has different behaviour in placing Pending Order and TP Line. Automatically places Fibonacci retracement lines from the last highest and lowest visible bars on the chart with: An auto Pending Order (Buy/Sell). Taking Profit 1, Taking Profit 2 is pivot point and Taking Profit 3 for extended reward opportunity. The best risk and reward ratio. Simple and powerful indica
Strong Retracement Points Pro demo edition! SRP (Strong Retracement/Reversal Points) is a powerful and unique support and resistance indicator. It displays the closest important levels which we expect the price retracement/reversal! If all level are broken from one side, it recalculates and draws new support and resistance levels, so the levels might be valid for several days depending on the market! If you are still hesitating to start using this wonderful tool, you can check this link to see h
The Th3Eng PipFinite indicator is based on a very excellent analysis of the right trend direction with perfect custom algorithms. It show the true direction and the best point to start trading. With StopLoss point and Three Take Profit points. Also it show the right pivot of the price and small points to order to replace the dynamic support and resistance channel, Which surrounds the price. And Finally it draws a very helpful Box on the left side on the chart includes (take profits and Stop loss
Gartley Hunter MT4
Siarhei Vashchylka
3.67 (3)
Gartley Hunter - An indicator for searching for harmonic patterns (Gartley patterns) and their projections. The indicator is equipped with a system of alerts and push notifications. Manual (Be sure to read before purchasing) | Version for MT5 Advantages 1. 12 harmonic patterns: 7 classical and 5 exotic. New patterns will be added as the indicator develops. 2. Constant automatic search for harmonic patterns. The indicator is capable of finding from the smallest to the largest patterns. 3. Autom
コアラフィボベースタイムへようこそ     コアラフィボタイムゾーンへようこそ     コアラフィボ時間延長へようこそ     メタトレードのための逃したツールへようこそ! 簡単な紹介: フィボナッチタイムゾーンは、フィボナッチ数列に基づく垂直線です。これらの線は、経過時間に基づいて逆転を予測するメカニズムとして、X軸(日付軸)に沿って伸びています。 多くの場合、開始点としてメジャーローまたはハイが選択されます。距離は比較的小さく始まり、フィボナッチ数列が伸びるにつれて大きくなります。 チャーティストは、フィボナッチタイムゾーンを将来に拡張して、潜在的な逆転ポイントを予測することができます。 このインジケーターは、グーグル検索「Fibo Base Time、Fibo Time Zone、FiboTimeExtention」を介してこれらの名前で見つけることができます。 詳細情報としての基本的な定義:     フィボナッチタイムゾーンは、高、低、または反転が発生する可能性のある潜在的な領域を表す垂直線です。     フィボナッチのタイムゾ
FREE
"The trend is your friend" is one of the best known sayings in investing, because capturing large trendy price movements can be extremely profitable. However, trading with the trend is often easier said than done, because many indicators are based on price reversals not trends. These aren't very effective at identifying trendy periods, or predicting whether trends will continue. We developed the Trendiness Index to help address this problem by indicating the strength and direction of price trend
Dark Sniper arrow indicator. complete lack of redrawing percentage of correct indicator predictions from 80 85% The arrow indicates the direction of the next candle and the possible direction of the trend in the future.  suitable for small m1 timeframes. It is recommended to open deals from 1 to 2 candles. The signal appears on the last candle advantages of the indicator: 1. leading signals. 2.complete lack of redrawing 3. high signal accuracy.
The perfect tool for Scalng in the Forex markets You can trade both from signal to signal and using take profit  The algorithm does not use Zigzag!  No redrawing!  This is a channel instrument that uses a moving average as a filter. Moving Average  There are 2 parameters for the settings Ma Period = 5 period Moving Average  Channel 1.0 distance of channel lines from the chart Price Signal Filter - calculation of signal opening and filter There is a complete set of Alert There is a multi-timefram
M W Pattern Pro
Nesimeye Oswald
4.14 (7)
M & W Pattern Pro is an advanced scanner for M and W patters , it uses extra filters to ensure scanned patterns are profitable. The indicator can be used with all symbols and time frames. The indicator is a non repaint indicator with accurate statistics calculations. To use , simply scan the most profitable pair using the statistics dashboard accuracy , then enter trades on signal arrow and exit at the TP and SL levels. STATISTICS : Accuracy 1 : This is the percentage of the times price hit
このプロダクトを購入した人は以下も購入しています
The breakout algorithm is a technique based on price, price features, to shape a breakout strategy. The strategy in this indicator will not be redrawn (none-repaint indicator), it is suitable for short or long term traders In the screenshot is the EURUSD pair, these currency pairs, commodities or stocks, it have similar strength *Non-Repainting (not redrawn) *For Metatrader4 Only *Great For Scalping *Great For Swing Trading *Arrow Entry, Green is Long, Red is Short *Works On Any Timeframe *Work
The [GRAFF] III manual trading system is based on multiple MetaTrader (MT4) indicators. Together, the entire PACK of GRAFF III indicators makes an advanced trading tool. The system consists of over 20 different custom-built indicators which have been carefully selected and tested in the long term to produce strong and efficient trading signals. The particular indicators are based on different mathematical formulas, so the entire system is calibrated to remove false signals from its own indicator
Let´s try to make some real money! Call me profit addicted. I thought why not try to make THE dream come reality. With discipline, a clear strategy and this indicator I focus on entering the perfect trades. This indicator is very easy to use as you will get perfect entry points for Put or Call trades. The arrows are calculated with: -     Momentum  parameters -     Candle stick patterns -     Fundamental Price action We recommend to combine it with Parabolic, ZigZag or Elliot waves indic
Golden Chip provides Basic Market Structure, Fibonacci, supply and Demand Zones. Letting you identify when a sell off point is approaching or whne a buy opportunity is arriving. The awesome thing about Golden Chip is that, you will see rejection levels or continuation before ANYBODY ! This indicator moves directly with price and lines up perfectly with the Chart. Some indicators would lag but NOT this one ! Golden Chip is amazing for Clean chart (Naked Chart). GOLDEN CHIP IS ONLY ON METATRADER (
Axebagsh
Batsukh Sumchin Khuyagbaatar
Only work on Crude Oil H1  time frame  Swing follow trend.  do not trade against trends Specifies the first destination and entry and exit points For 16 years, I only traded on CrudeOil. Crude oil is one of the most extreme combinations in the world and it is safe to say that such a good indicator has never been made before.   This indicator will save you a lot of money because it introduces a new type of approach, Good luck
Forex Signal Generator is a cutting edge technology for Trend Trading, and filtering all inbuilt in one tool. The Signal Generator  analysis the market like a Pro  by using its smart algorithms to detect  the trend, filter out market noise  and display on  your chart with the : ENTRY, STOPLOSS AND TARGET PROFIT Advantages You Get     Access to the proven reliable trend indicator based     Easy and  effective trend detection.     Gives you the ability to filter  out  'NOISE' from the ma
Premium support and resistance - the best combination of different indicators allowed us to create the best product on the market! And that's Premium support and resistance! A convenient and flexible tool that will help you in trading! Shows where the price will go from the support and resistance levels! The arrows Blue buy Red sell will help you with this! Alert is already built into the indicator for your convenience! Alert in order not to miss the "Own" signal! It is already co
MMM Gold Sniper
Gilang Wardhana Purnama Putra
指標はマーケットメーカー戦略に基づいています。再塗装なし。 MM はトレーダーであり、彼らの目的はお金を稼ぐことです。これには、小売トレーダーとの取引戦略が含まれます。彼らと他のトレーダーとの主な違いは、大量の取引量にアクセスすることで、自由に価格を動かす能力があることです。そのため、利益を得るために、彼らはより低い価格で購入し、より高い価格で販売することを目指しています。 彼らは次の方法でこれを達成します。 1. トレーダーにポジションを取るように誘導する。これは、一連の価格変動を使用して、トレーダーを「だまして」特定の方向にポジションを取り、その後再び反転させることによって達成されます。これは、MM が特定の通貨を特定の価格で売却し、リテール トレーダーが通貨の価値が後退して再び売却したいという苦痛を感じたときに、より低い価格で買い戻すことができることを意味します (たとえば、ストップ ロスを介して)。 ) 2. パニックと恐怖を引き起こし、トレーダーが感情的になったり、不合理に考えたりするように仕向けます。多くの場合、これには次のことが含まれます。 ⋅ 素早い動き ⋅ スパイクキ
Place the indicator on the chart, preferably with a timeframe of H1 or H4. If you are trading in the daily range or, conversely, on lower timeframes, you will need to adjust the RSI and ATR levels accordingly.  The blue arrows of the indicator will be a signal to open a long position, the red arrows will be a signal to open a short position: 1) Blue arrow for longs (growth) and red arrow for shorts (decline). 2) Two horizontal lines for current positions (one for entry and one for stop). 
WARNING!! THIS SWORD IS TOO SHARP!    ONLY 10 COPIES LEFT FOR THE NEXT PRICE TO BE 8,000$ FOR UNLIMITED PLAN. Dear traders I am very glad once again to introduce to you my other tool called "Forex Sword Indicator". In short this tool is meant to give you an edge over the market that you have been waiting for  so long. Now, here it is. It is a very very simple tool but yet a dangerous sword. I call it a  Holy grail indicator!. I will not talk a lot about this tool. Just let the tool speak by itse
IconTradeSL.  Возможность выставлять sl по уровням. В индикаторе установлена возможность показывать историю уровней на графике. Возможность выставлять sl по уровням. Настройки индикатора: ЦВЕТ_BAR - цвет баров по которым ищем SL ЦВЕТ_Тек_BAR - Purple;//цвет текущего бара BAR - поиск в последних BAR барах (по умолчанию 200) show_bar - показывать бары по которым ищем SL
FxBears Super Trading Indicator を使用した高度な取引の世界へようこそ。 MT4 プラットフォーム専用に設計されたこの革新的なツールは、エリオット波動、需要供給ゾーン、内部インジケーターの力を組み合わせて、情報に基づいた取引決定のための高品質のシグナルをトレーダーに提供します。 90% 以上の成功率を誇る FxBears Super は、あなたの取引戦略に新たなレベルの精度と収益性をもたらします。 Of Corse は再描画も再描画もありません。 エリオット波動分析:      FxBears Super はエリオット波動の予測可能性を活用し、市場サイクルとトレンドを特定します。 特徴的な5波動インパルスと3波動修正パターンを分析し、潜在的な転換点や継続パターンを高精度に抽出します。 需要と供給のゾーン:      需要ゾーンと供給ゾーンの重要性を認識し、FxBears Super はチャート上の重要なサポートとレジスタンスのレベルを正確に示します。 市場センチメントが変化するこれらのゾーンは、潜在的な価格反転やブレイクアウトに関する貴重な洞
Gann Made Easy は、ミスター・ギャンの理論を使用した取引の最良の原則に基づいた、プロフェッショナルで使いやすい外国為替取引システムです。 W・D・ガン。このインジケーターは、ストップロスとテイクプロフィットレベルを含む正確な買いと売りのシグナルを提供します。 PUSH通知を利用して外出先でも取引可能です。 購入後はご連絡ください!私の取引のヒントと素晴らしいボーナスインジケーターを無料で共有します! おそらく、ギャンの取引手法についてはすでに何度も聞いたことがあるでしょう。通常、ギャンの理論は初心者のトレーダーだけでなく、すでにある程度の取引経験がある人にとっても非常に複雑なものです。なぜなら、ギャンの取引手法は理論的にはそれほど簡単に適用できるものではないからです。私はその知識を磨き、最良の原則を私の外国為替インジケーターに組み込むために数年を費やしました。 このインジケーターは非常に簡単に適用できます。必要なのは、それをチャートに添付し、簡単な取引推奨事項に従うだけです。このインジケーターは常に市場分析の仕事を行い、取引の機会を探します。適切なエントリーポイントを検出
驚異的なFXインジケーター「Miraculous」をご紹介します。完璧な結果を得るための1時間足を含むすべてのタイムフレームで効果的に機能する、最強の強力な特殊MT4フォレックスインジケーターです。 すべてのタイムフレームで優れた結果を提供する最高のFXインジケーターを探し続けるのに疲れましたか?これ以上探す必要はありません!「Miraculous」フォレックスインジケーターをご紹介します。このインジケーターは、トレーディングの経験を変革し、収益を新たなレベルに引き上げるために設計されました。 先進のテクノロジーと長年にわたる緻密な開発に基づいて構築された「Miraculous」フォレックスインジケーターは、FX市場における力と正確さの頂点となります。この素晴らしいツールは、すべてのレベルのトレーダーのニーズを満たすように設計されており、一貫した収益性を追求する上で比類のない優位性を提供します。 「Miraculous」フォレックスインジケーターの他との違いは、その非常に適応性にあります。デイトレーダー、スウィングトレーダーであろうと、長期ポジションを好む方であろうと、このインジケータ
現在20%OFF! 初心者やエキスパートトレーダーのためのベストソリューション! このダッシュボードソフトウェアは、28の通貨ペアで動作しています。それは私達の主要な指標(高度な通貨の強さ28と高度な通貨インパルス)の2に基づいています。それは全体の外国為替市場の大きい概観を与えます。それは、すべての(9)時間枠で28の外国為替ペアのための高度な通貨の強さの値、通貨の動きの速度と信号を示しています。チャート上で1つのインディケータを使用して市場全体を観察し、トレンドやスキャルピングの機会をピンポイントで見つけることができたら、あなたのトレードがどのように改善されるか想像してみてください。 このインディケータには、強い通貨と弱い通貨の識別、潜在的な取引の識別と確認がより簡単になるような機能が搭載されています。このインディケータは、通貨の強さや弱さが増加しているか減少しているか、また、すべての時間枠でどのように機能しているかをグラフィカルに表示します。 新機能として、現在の市場環境の変化に適応するダイナミックなマーケットフィボナッチレベルが追加され、すでに当社のAdvan
まず第一に、この取引インジケーターは再描画されず、再描画されず、遅延しないことを強調する価値があります。これにより、手動取引とロボット取引の両方に理想的なものになります。 アトミックアナリストは、価格の強さとモメンタムを利用して市場でより良いエッジを見つけるためのPA価格アクションインジケーターです。ノイズや誤ったシグナルを除去し、取引ポテンシャルを高めるための高度なフィルターを備えています。複雑なインジケーターの複数のレイヤーを使用して、アトミックアナリストはチャートをスキャンし、複雑な数学的計算をシンプルなシグナルと色に変換します。これにより、どのような初心者トレーダーでも理解して使用し、一貫した取引の決定を行うことができます。 「アトミックアナリスト」は、新規および経験豊富なトレーダー向けにカスタマイズされた包括的な取引ソリューションです。プレミアムインジケーターとトップノッチの機能を1つの取引戦略に組み合わせ、すべてのタイプのトレーダーにとって汎用性のある選択肢にします。 デイリートレーディングとスキャルピング戦略:高速で正確なデイトレーディングおよび短期トレード
現在26%オフ 初心者やエキスパートトレーダーに最適なソリューション! このインジケーターは、独自の機能と新しい計算式を取り入れた、ユニークで高品質、かつ手頃な価格のトレーディングツールです。たった1枚のチャートで28の為替ペアの通貨強度を読み取ることができます。新しいトレンドやスキャルピングチャンスの引き金となるポイントを正確に特定することができるので、あなたのトレードがどのように改善されるか想像してみてください。 ユーザーマニュアルはこちら  https://www.mql5.com/en/blogs/post/697384 これが最初の1本、オリジナルだ! 価値のないクローンを買わないでください。 特別な サブウィンドウの矢印で強い通貨の勢いを表示 GAPがあなたのトレードを導く! 基準通貨や気配値が売られすぎ・買われすぎのゾーン(外相フィボナッチレベル)にあるとき、個別チャートのメインウィンドウに警告表示。 通貨がレンジの外側から反落した場合、プルバック/リバーサルのアラート。 クロスパターンの特別なアラート 複数の時間枠を選択可能で、トレンドを素早く
TPSpro TRENDPRO  - is a trend indicator that automatically analyzes the market and provides information about the trend and each of its changes, as well as giving signals for entering trades without redrawing! The indicator uses each candle, analyzing them separately. referring to different impulses - up or down impulse. Exact entry points into transactions for currencies, crypto, metals, stocks, indices!  -  Version MT5               DETAILED DESCRIPTION        /       TRADING SETUPS           
A key element in trading is zones or levels from which decisions to buy or sell a trading instrument are made. Despite attempts by major players to conceal their presence in the market, they inevitably leave traces. Our task was to learn how to identify these traces and interpret them correctly. Reversal First Impulse levels (RFI)   -  Version MT5                INSTRUCTIONS                 RUS                 ENG                                       R ecommended to use with an indicator   -  
ご紹介   クォンタム トレンド スナイパー インジケーターは 、トレンド反転を特定して取引する方法を変革する画期的な MQL5 インジケーターです。 13年以上の取引経験を持つ経験豊富なトレーダーのチームによって開発されました。     クォンタムトレンドスナイパーインジケーター   は、非常に高い精度でトレンドの反転を識別する革新的な方法で、あなたのトレーディングの旅を新たな高みに押し上げるように設計されています。 ***Quantum Trend Sniper Indicatorを購入すると、Quantum Breakout Indicatorを無料で入手できます!*** クォンタム ブレイクアウト インジケーターは、トレンドの反転を特定するとアラートを発し、矢印を示し、3 つのテイクプロフィットレベルを提案します。 初心者トレーダーにもプロのトレーダーにも適しています。 量子EAチャネル:       ここをクリック MT5のバージョン:       ここをクリック 推奨事項: 期間: すべての時間枠。最良の結果を得るには、
Gold Stuff
Vasiliy Strukov
4.89 (249)
Gold Stuff は、金専用に設計されたトレンド指標であり、あらゆる金融商品にも使用できます。 インジケーターは再描画せず、遅れません。 推奨時間枠 H1. それインディケータでフルオートExpert Advisor EA Gold Stuffが動作します。 あなたは私のプロフィールでそれを見つけることができます. 設定と個人的なボーナスを得るために、購入後すぐに私に連絡してください!   設定 矢印を描く - オンオフ。 チャートに矢印を描く。 アラート - 可聴アラートのオンオフ。 メール通知 - オンオフ。 電子メール通知。 プチ通知 - オンオフ。 プッシュ通知。 次に、色域を調整します。 Gold Stuff は、金専用に設計されたトレンド指標であり、あらゆる金融商品にも使用できます。 インジケーターは再描画せず、遅れません。 推奨時間枠 H1. それインディケータでフルオートExpert Advisor EA Gold Stuffが動作します。 あなたは私のプロフィールでそれを見つけることができます. 設定と個人的なボーナスを得るために、購入後
An exclusive indicator that utilizes an innovative algorithm to swiftly and accurately determine the market trend. The indicator automatically calculates opening, closing, and profit levels, providing detailed trading statistics. With these features, you can choose the most appropriate trading instrument for the current market conditions. Additionally, you can easily integrate your own arrow indicators into Scalper Inside Pro to quickly evaluate their statistics and profitability. Scalper Inside
TrendMaestro
Stefano Frisetti
5 (2)
note: this indicator is for METATRADER4, if you want the version for METATRADER5 this is the link: TRENDMAESTRO recognizes a new TREND in the bud, he never makes mistakes. The certainty of identifying a new TREND is priceless. DESCRIPTION TRENDMAESTRO identifies a new TREND in the bud, this indicator examines the volatility, volumes and momentum to identify the moment in which there is an explosion of one or more of these data and therefore the moment in which prices have strong probability of f
ご紹介     Quantum Breakout PRO は 、ブレイクアウト ゾーンの取引方法を変革する画期的な MQL5 インジケーターです。 13年以上の取引経験を持つ経験豊富なトレーダーのチームによって開発された Quantum Breakout PROは 、革新的でダイナミックなブレイクアウトゾーン戦略により、あなたの取引の旅を新たな高みに押し上げるように設計されています。 クォンタム ブレイクアウト インジケーターは、5 つの利益ターゲット ゾーンを備えたブレイクアウト ゾーン上のシグナル矢印と、ブレイクアウト ボックスに基づいたストップロスの提案を提供します。 初心者トレーダーにもプロのトレーダーにも適しています。 量子EAチャネル:       ここをクリック MT5バージョン:   ここをクリック 重要!購入後、インストールマニュアルを受け取るためにプライベートメッセージを送ってください。 推奨事項: 時間枠: M15 通貨ペア: GBPJPY、EURJPY、USDJPY、NZDUSD、XAUUSD アカウントの種類: ECN、Raw、また
まず第一に、この取引ツールはノンリペイント、ノンリドロー、ノンラグの指標であり、プロの取引に理想的ですことを強調する価値があります。 スマートプライスアクションコンセプトインジケーターは、新米から経験豊富なトレーダーまで、非常 に強力なツールです。Inner Circle Trader AnalysisやSmart Money Concepts Trading Strategiesなど、20以上の有用な指標を1つに組み合わせています。このインジケーターはスマートマネーコンセプトに焦点を当て、大手機関の取引方法を提供し、彼らの動きを予測するのに役立ちます。 特に、流動性分析に優れており、機関がどのように取引しているかを理解しやすくしています。市場のトレンドを予測し、価格の動きを慎重に分析するのに優れています。機関の戦略とトレードを合わせることで、市場の動向についてより正確な予測ができます。このインジケーターは多目的であり、市場構造を分析し、重要な注文ブロックを特定し、さまざまなパターンを認識するのに優れています。 このインジケーターはBOSやCHoCHなどのパターンの識
Advanced Supply Demand
Bernhard Schweigert
4.92 (310)
現在33%オフ 初心者にもエキスパートトレーダーにも最適なソリューション このインジケーターは独自の機能と新しい公式を多数内蔵しており、ユニークで高品質かつ手頃な取引ツールです。このアップデートでは、2つの時間枠ゾーンを表示できるようになります。より長いTFだけでなく、チャートTFとより長いTF(ネストゾーンを表示)の両方を表示できます。すべてのSupply Demandトレーダーの皆さんのお気に召すはずです。:) 重要情報の公開 Advanced Supply Demandの可能性を最大化するには、 https://www.mql5.com/ja/blogs/post/720245 にアクセスしてください。   エントリーまたはターゲットの正確なトリガーポイントを正確に特定できれば取引がどのように改善されるか想像してみてください。新しい基盤となるアルゴリズムに基づいて構築されているため、買い手と売り手の間の潜在的な不均衡をさらに簡単に特定できます。これは、最も強い需要と供給のゾーンと、過去のパフォーマンス(古いゾーンを表示)がグラフィカルに表現されるためです。これらの機能は、最適
Trend Screener
STE S.S.COMPANY
4.83 (86)
トレンドインジケーター、1つのツールに組み込まれたすべての重要なトレンド機能を備えたトレンドトレーディングとフィルタリングのための画期的なユニークなソリューション! これは、すべてのシンボル/商品(外国為替、商品、暗号通貨、インデックス、株式)で使用できる100%再描画されていないマルチタイムフレームおよびマルチ通貨インジケーターです。 トレンドスクリーナーは、チャート内のドットで矢印トレンドシグナルを提供するインジケーターに続く効率的なインジケーターです。 トレンド分析インジケーターで使用できる機能: 1.トレンドスキャナー。 2.最大利益分析を備えたトレンドライン。 3.トレンド通貨強度メーター。 4.アラート付きのトレンド反転ドット。 5.アラート付きの強いトレンドドット。 6.トレンド矢印 毎日の分析例、毎日のシグナルパフォーマンス...など、トレンドスクリーナーインジケーターを使用して、ここで見つけることができます: ここをクリックしてください 期間限定オファー:トレンドスクリーナーインジケーターは、50ドルと生涯でのみご利用いただけます。 (元の価格125 $) MQ
通貨強さウィザードは、取引を成功させるためのオールインワン ソリューションを提供する非常に強力な指標です。このインジケーターは、複数の時間枠のすべての通貨のデータを使用して、このまたはその外国為替ペアのパワーを計算します。このデータは、使いやすい通貨インデックスと通貨パワーラインの形式で表され、特定の通貨のパワーを確認するために使用できます。 必要なのは、取引したいチャートにインジケーターを接続することだけです。インジケーターは、取引する通貨の実際の強さを示します。このインジケーターは、トレンドに合わせて取引するときに有利に利用できる売買高の圧力の極値も示します。このインジケーターには、フィボナッチに基づく可能なターゲットも表示されます。 このインジケーターは、PUSH 通知を含むあらゆるタイプのアラートを提供します。 購入後ご連絡下さい。私の取引のヒントをあなたと共有し、素晴らしいボーナスインジケーターを無料で提供します! 幸せで有益な取引をお祈りします。
mql5と Telegramの モーニング・ブリーフィングで、詳細とスクリーンショットを含む毎日のマーケット・アップデートをご覧 ください! FX Power MT4 NGは 、長年の人気を誇る通貨強度計FX Powerの次世代モデルです。 この次世代ストレングスメーターは何を提供するのでしょうか?初代FXパワーの魅力すべて プラス GOLD/XAUの強さ分析 より正確な計算結果 個別に設定可能な分析期間 カスタマイズ可能な計算上限値により、さらに優れたパフォーマンスを実現 もっと見たい人のための特別なマルチインスタンス設定 すべてのチャートでお好みの色を無限に設定可能 数え切れないほどの通知オプションにより、重要なことを見逃すことはありません。 Windows 11とmacOSのスタイルで角を丸くした新しいデザイン 魔法のように動くインジケーターパネル FXパワーの主な機能 すべての主要通貨の強さの完全な履歴 すべての時間枠における通貨の強さの履歴 すべてのブローカーとチャートで同一の計算結果 100%信頼できるリアルタイム計算 -> リペイントなし ドロップダウン・リストから
カスタムMT4インジケーターで外国為替取引を成功させるための秘密を発見してください! 外国為替市場で成功を達成し、リスクを最小限に抑えながら一貫して利益を得る方法を疑問に思ったことはありますか? これがあなたが探している答えです! 取引へのアプローチに革命をもたらす独自のMT4インジケーターを導入できるようにします。 ユニークな汎用性 私たちのインジケータは、RenkoとRangeBarのろうそくのフォーメーションを好むユーザー向けに特別に設計されています。 これらのチャートタイプは多くの経験豊富なトレーダーに好まれていることを理解しています。そのため、私たちのインジケーターはそれらとシームレスに統合され、比類のない市場分析を提供します。 クリアトレンドシグナル 複雑な分析を忘れてください! 私たちのインジケーターは、鮮やかな色と明確なドット構造を利用して、市場の動向を明確に示しています。 赤と青の点は、価格の動きの方向性について疑いの余地がなく、取引の迅速な意思決定を可能にします。 HH/HL HL/LL戦略とのアライメント HH/HLおよびHL/LL構
作者のその他のプロダクト
Copies transactions between MT4 terminals. Possibilities: quick copy start minimum processor load direct and reverse (reverse) copying. copying Take Profit and Stop Loss levels copying deferred and their changes copy transactions one to many copy trades many to one local copy only Attention: The product is designed for copying trades only within a single computer or VPS with access to the desktop. The product will not work on the built-in Virtual Hosting of the terminal. We will help you set up
We offer simple and reliable software that can  copy trades  between any MT4 accounts. Easy to use MetaTrader copier which saves valuable time Reliable, so you are protected from technical issues Powerful, with a lot of features available Who can use this MT4 copier? Forex Copier is a solution for individual traders or account managers who need to execute trade signals from external sources or who need to  manage several MetaTrader 4 accounts  at the same time. We do not offer you “yet another
フィルタ:
削除済み 2021.09.14 13:23 
 

ユーザーは評価に対して何もコメントを残しませんでした

Alexandr Bryzgalov
29749
開発者からの返信 Alexandr Bryzgalov 2021.09.14 13:34
Hi.
Most likely you received a notification about how you downloaded the indicator earlier. Recently I updated the Support and resistace levels indicator, so you received a notification.
clausejmbm123
351
clausejmbm123 2021.02.20 15:24 
 

ユーザーは評価に対して何もコメントを残しませんでした

Jens Bruns
2005
Jens Bruns 2021.02.20 13:49 
 

ユーザーは評価に対して何もコメントを残しませんでした

Mehdi Faraz Fard
2325
Mehdi Faraz Fard 2020.07.10 23:28 
 

ユーザーは評価に対して何もコメントを残しませんでした

paul_van_reyn
58
paul_van_reyn 2019.07.11 12:43 
 

ユーザーは評価に対して何もコメントを残しませんでした

Tim Eubanks
5733
Tim Eubanks 2019.06.07 18:12 
 

ユーザーは評価に対して何もコメントを残しませんでした

cherryann gibbons
86
cherryann gibbons 2019.05.01 23:27 
 

ユーザーは評価に対して何もコメントを残しませんでした

Mohammad Rajaur Rahman
349
Mohammad Rajaur Rahman 2019.03.16 19:28 
 

ユーザーは評価に対して何もコメントを残しませんでした

sonny1
297
sonny1 2018.12.12 17:14 
 

ユーザーは評価に対して何もコメントを残しませんでした

sunnychow
8663
sunnychow 2018.08.26 18:05 
 

ユーザーは評価に対して何もコメントを残しませんでした

Dmitry Karagusov
804
Dmitry Karagusov 2018.06.29 16:58 
 

ユーザーは評価に対して何もコメントを残しませんでした

Mauro Giuseppe Tondo
2009
Mauro Giuseppe Tondo 2018.06.05 23:01 
 

ユーザーは評価に対して何もコメントを残しませんでした

Zentrader2015
1470
Zentrader2015 2017.09.27 04:21 
 

ユーザーは評価に対して何もコメントを残しませんでした

Ali irwan
5137
Ali irwan 2017.07.20 00:21 
 

ユーザーは評価に対して何もコメントを残しませんでした

Qingshan Li
663
Qingshan Li 2017.07.18 21:19 
 

ユーザーは評価に対して何もコメントを残しませんでした

削除済み 2017.06.26 23:54 
 

ユーザーは評価に対して何もコメントを残しませんでした

Vyacheslav Korolev
4684
Vyacheslav Korolev 2017.05.05 13:58 
 

ユーザーは評価に対して何もコメントを残しませんでした

laith.H
52
laith.H 2017.05.04 13:06 
 

ユーザーは評価に対して何もコメントを残しませんでした

rakyan
573
rakyan 2017.04.15 12:24 
 

ユーザーは評価に対して何もコメントを残しませんでした

Gennadiy Voltornist
11909
Gennadiy Voltornist 2017.04.12 19:57 
 

ユーザーは評価に対して何もコメントを残しませんでした

12
レビューに返信
バージョン 3.1 2021.09.19
HistoryBarパラメーターが入力時系列のサイズよりも大きい場合に発生するエラーが修正されました。
バージョン 3.0 2021.09.14
これで、インジケーターは上下の信号を出します。
バージョン 2.54 2021.03.04
オブジェクト名にプレフィックスを追加しました。 さまざまな設定でインジケーターのさまざまなコピーから線をエラーなしで描画するために作成されました。
バージョン 2.53 2021.02.20
Исправлена отрисовка трендовых уровней при обновлении экстремумов
バージョン 2.52 2020.12.07
ユーザーの要求に応じて、レベルの色を変更する機能を追加しました。
バージョン 2.51 2020.04.15
Обновление по просьбе сервиса.
バージョン 2.5 2018.11.26
The informational message displayed in the lower right corner of the chart to which the indicator is attached has been deleted.
バージョン 2.1 2017.04.25
Fixed the text of the information message which appears when a new support/resistance level is identified.
Added the indicator message in the bottom right corner of the chart, to which the indicator is attached.
Added a new "Trends" mode for displaying the support and resistance lines. The standard ZigZag is used for identification of levels in this mode. Parameters of the ZigZap have been moved to settings. The parameters provide the ability to select (UseResource) the ZigZag to be used - the one attached to the indicator as a resource or a custom ZigZag. When UseResource=No, the indicator loads faster.