Trendline Flattener and Extender

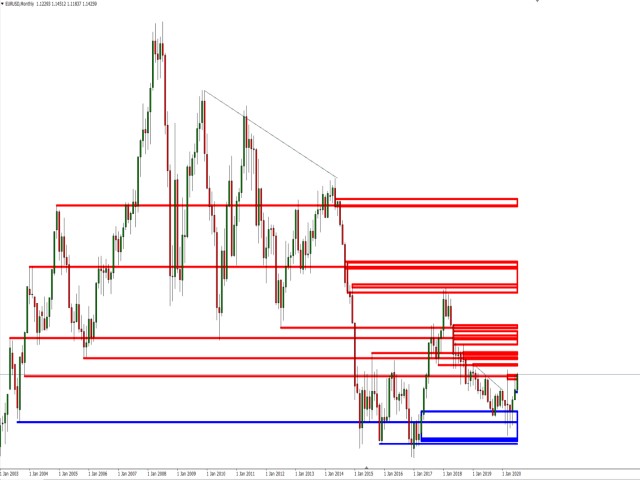
This product makes your trend lines perfectly horizontal and brings them to present automatically.

SPEND YOUR TIME TRADING AND NOT FORMATTING TREND LINES!

Makes for the cleanest of charts!

This product is ideal for S/D, S/R, and other technical analysis styles!

The most important part is that you won't know how you ever traded with out it!

First month is free!

おすすめのプロダクト
This indicator draws lines at the open, close, high and low price of the last chart candle from the set timeframe. In addition, a label shows whether it was an up or down candle. The standard settings follow the original idea of ​​getting the price data from the daily timeframe for day trading/scalping, but since this indicator is fully customizable, you can also set a different timeframe. Based on the drawn price lines, you can then also display Fibonacci levels. This function can also be
The indicator sends messages to e-mail and mobile terminal when the price approaches the horizontal levels and trend lines that are drawn using the handy panel! The levels and trend lines are deleted and placed to the chart using one click on the panel, and they can be dragged on the chart by mouse! It is possible to set the interval between messages in the settings, the interval is applied to each object separately! Indicator Settings ===*** Main settings ***=== - below is the list of the main
Targets
Jose Ramon Miranda Ramos
5 (1)
Targets is an indicator to determine potential turning  points , targets  are calculated to determine levels in which the sentiment of the market could change from "bullish" to "bearish." This indicator can be used in any timeframe and any currency pair: IN CASE YOU DON'T SEE THE INDICATOR WHEN YOU ADD IT TO YOUR CHARTS JUST OPEN THE INDICATOR MENU AND CLOSE THE MENU AGAIN PLEASE TAKE NOTICE: For best results use this indicator as an extra tools after you have completed your regular analysis an
FREE
Global Trend Indicator, shows the signals for entry. Displays both entry points and the trend itself. Shows statistically calculated moments for entering the market with arrows. When using the indicator, the risk factor can be optimally distributed. Settings: Uses all one parameter for settings. Choosing a parameter, it is necessary to visually resemble it so that the appropriate graph has a projection of extremes. Parameters: Length - the number of bars for calculating the indicator. Use
Summary This EA will trade semi-automatically based on trend lines or horizontal lines that are manually plotted on the chart by the user. It can handle any number of lines per chart and each line can have its own adjustable settings. This EA manages every line separately based on specific user 'keywords' set for each line. Since each line has it's own independent settings, this is why there are very few shared inputs in this EA. Doing it this way allows for a single EA to manage many lines and
FREE
PowerXXX
Marco Fornero Monia
PowerXXX measures the power of the current candlestick and displays it in numerical format and colors. The indicator can cover multiple timeframes and can be placed on the main chart or on the charts of the underlying indicators. The number of timeframes is selectable, as well as the color levels according to the power expressed. In the latest version, the power can be expressed as a function of the opening of the candle itself or as a function of the opening of the total candles before. There
Golden Move 2
Damian Mateusz Wojtowicz
The best indicator out there, try it yourself! Please leave your positive comments and reviews! Settings: AlertConfirmation: truns on and off alerts CalculatedBars: how many bars will be calculated Distance : arrow distance Buffers: Buffer0 (Arrow Buy) Buffer1 (Arrow Sell) Buffer2 (Empty) Buffer3 (Empty) Buffer4(Buy value == 1) Buffer5(Sell value ==1)
Fibonacci automatically draws Fibonacci retracement, Because Fibonacci automatically draws Fibonacci retracement, you can know at a glance the price to buy at a push or sell back. Therefore, you can trade in favorable conditions in a trending market. The "PowerMap" is a bundle of four items ("DrawTurningPoint", "DrawHurdle", "DrawChartPattern", "DrawFibonacci").  Please be careful not to purchase more than one copy (duplicates). We are live-streaming the actual operation of the system. Please
SmartMass
Roberto Alvarez
5 (2)
SMARTMASS INDICATOR This indicator is different from all known volume indicators. It has a significant distinction; it is an algorithm that relates price movement to volume, attempting to find proportionality and efficient movement while filtering out noise and other movements that are more random and do not follow a trend or reversal. Ultimately, it reveals the true strength of the movement, indicating whether it has genuine support from bulls or bears or if it's merely a high-volume movement
Summary This indicator is based on RSI and Momentum indicators. It also considers moving averages of these two indicators. The three indicators have adjustable settings. The arrows do not repaint since the indicator only uses confirmed values and waits for the candle to close before painting an arrow. The indicator is also able to alert when arrows appear. There are 3 types of alerts - Popup, Email and Mobile Push Notifications. The arrows can be used in the EA and the inputs can also be optimiz
FREE
MoveWave - Moving waves are very handy indicators for determining pivot levels. Most Forex traders make decisions based on technical analysis. This type of analysis determines patterns and trends in the market. With the help of complex mathematical equations that are combined and made out in the form of this indicator, the trader will be able to more accurately determine the price reversal levels. Wave theory mathematically represents various behavioral models of the market. It is used as the ba
フィボナッチ・トレンド・マーカー (Fibonacci Trend Marker) は、現在のローソク足が過去のローソク足の高値-安値(High-Low、HL)範囲に対してどのように振る舞うかを、フィボナッチ・リトレースメントレベルを用いて分析するトレンド指標です。トレンドの強さを視覚的に追跡し、ローソク足の色の変化を通じてトレンドの弱まりや反転の可能性を示します。 特徴: トレンド重視のトレーダーのために設計されており、フィボナッチレベルに基づいてトレンドの変化を素早く検出します。 市場のボラティリティが十分で、3~5本のローソク足が明確な動きを形成する場合、あらゆる時間枠で有効です。 ローソク足のサイズはチャートのスケールに自動的に適応し、ズーム時にも正確な表示を保証します。 現在のローソク足をリアルタイムで分析することでトレンド変化に高い感度を持ち、M1やM5の時間枠でのスキャルピングに最適です。 取引方法: エントリー: 前の閉じたローソク足の色が変化した後にポジションを開きます。例えば、赤いローソク足の後に青で閉じた場合、上昇トレンドのシグナルとなり、買い(Buy)の取引
What Is a Pivot Point? A pivot point is a technical analysis indicator, or calculations, used to determine the overall trend of the market over different time frames. The pivot point itself is simply the average of the intraday high and low, and the closing price from the previous trading day. On the subsequent day, trading above the pivot point is thought to indicate ongoing bullish sentiment, while trading below the pivot point indicates bearish sentimen How to Use Pivot Points The very ess
Bermaui Channel
Muhammad Elbermawi
5 (19)
This is a price channel that shows five important price levels on the chart. Those levels are: 1. The Highest High (HH) of the previous x bars. 2. The Highest Low (HL) of the previous x bars. 3. The Center Line. 4. The Lowest High (LH) of the previous x bars. 5. The Lowest Low (LL) of the previous x bars. How does Bermaui Channels Captures Overbought  area Think of the distance between HH and HL levels as an overbought area. When the price candles or bars crosses the HL to the upside this indica
Become a constantly profitable 5-star forex trader!  We offer a few indicators to support you understand and analyse the market! With our strategies you will improve your trading system and bacome an expert... We have indicators for trend direction, market direction and others.. for multi-time frames and that covers all majors or your favorite trading symbols! Some of them offer a customizable calculation parameters... or Graph features! See how powerful they are! The are also easy-to-use t
GreenBoxインディケーター とは、 ダウ理論 を用いリアルタイムに 高値・安値を分析 し、 ダウ理論に基づいたトレンドラインを自動描画 したり、 押し安値や戻り高値をブレイク後の到達予測地点をBox形式で自動描画 するインディケーターです。FXやGoldなどの様々な銘柄で機能します。 高値・安値はnBarsパラメーター(初期値=5)で決まりますが、対応する移動平均線(nBarsの4~5倍のSMAやEMA)を同時に表示するとトレンド転換の様子がより分かり易くなります。 (無料のGreenBoxのデモ版をダウンロードして、 いつもトレードで利用している移動平均線 と それに対応するnBars値(=移動平均線÷(4~5))のGreenBox で効果があるか試してみて欲しいです。) nBars=5 -> 20SMA, 21EMA, 25SMA, 25EMA nBars=13 -> 55EMA, 52SMA nBars=34 -> 144EMA, 136SMA <参考> ver.1.9で大幅に改善した通知機能を活用することで、 音声実況解説(GreenBoxがリアルタイムに各種分析しな
Neuro Poseidon is a new indicator by Daria Rezueva. It combines precise trading signals with adaptive TP/SL levels - creating best possible trades as a result! Message me and get  Neuro Poseidon Assistant  as a gift to automize your trading process! What makes it stand out? 1. Proven profitability on all assets and timeframes 2. Only confirmed BUY and SELL signals present on the chart 3. Adaptive TP & SL levels generated by the software for each trade 4. Easy to understand - suitable for all
Heikin-Ashi-Sniper is a perfect addition to your portfolio. It is meant to be traded on EURUSD on H1 Timeframe. It uses Heikin-Ashi High and Low/High of Monthly timeframe to determine optimal entry signals while having a reasonably low drawdown More EA´s will be published shortly to complete the Portfolio. The EA Trades not very frequently it waits for the right chance and places the order. The rest of the time, your capital is free to be traded on other strategies Please see backtest results i
FREE
NO REPAINT ADVANCED CHART PATTERN INDICATOR By definition, a price ( chart)  pattern is a recognizable configuration of price movement that is identified using a series of  trendlines  and/or curves. When a price pattern signals a change in trend direction, it is known as a reversal pattern; a continuation pattern occurs when the trend continues in its existing direction following a brief pause. Advanced Chart Pattern Tracker is designed to find the MOST ACCURATE patterns. A special script is a
Hello all The expert works by hanging pending deals moving with the price when activating a transaction It closes on the stop loss or on a profit from the pursuit of profit Work on low spread currency pairs Like dollar yen currency The work is done with the same settings as the expert, or it can be modified as the user likes Work on a timing of 15M or more as the user likes parameters: Transaction_Movement : Movement =true  . no Movement=false . Lot1: Manual Lot Size Auto_Lot: Set true to auto
This is an indicator that has been updated from the previous VRC indicator, which has both buy and sell arrows now, and it is optimised from the previous one. You can try it out, the version is upgraded and might suit your trading style. You can also use this indicator as a confluence, or you can use it as a main signal provider; it can be used along with your strategy or top-down approach analysis. Past performance does not guarantee future performance; kindly do a top-down analysis and keep yo
BB & RSI Candle Color: Technical Analysis Indicator on MetaTrader 4 The "BB & RSI Candle Color" indicator is a powerful technical analysis tool designed for MetaTrader 4 traders looking for an effective visual representation of market conditions. Created by 13 Crow Trading Club, this indicator combines the popular Bollinger Bands and the Relative Strength Indicator (RSI) to provide clear and accurate visual signals. This indicator offers three key aspects: Candle Color: Normal candles are displa
FREE
OVERVIEW The Vector Candle Zones Render indicator automatically renders boxes for vector candle zones that are yet to be recovered. The indicator is an implementation of an existing PVA candles indicator. Combine it with PVSRA and MarketMakerMethod strategy. FEATURES Software: MetaTrader4 - MT4 - 600+ build Timeframes: Multi-Timeframe Markets: Forex/Cryptos/Energies/Bonds/Metals/Indices/Futures/Commodities Customizable style parameters: Change Color style Change Percentage style C
The MT4 " DayLevelsSignalPro " indicator . Signal Indicator – generates the most accurate buy / sell signals . Noise filtering indicator  – reduces false signals . Signal information with a clear , understandable and visually convenient view . User- friendly graphical interface ( colors , sound notifications , customization options ) . - Generation of a breakdown signal for significant peaks of the Current day . - Generation of a signal for the breakdown of the previous Day 's Level - Generation
The Transition Trend indicator shows the points of potential market reversal. The indicator's smart algorithm detects the trend, filters out market noise and generates entry signals and exit levels. Simple, visual and efficient trend detection. Uses just one parameter for settings. The indicator does not redraw and does not lag. You can set up message alerts as sound or email. Works on all currency pairs and all timeframes. Ready-made trading system.
Pip Professional: A Reliable Advisor Pip Professional is a reliable advisor that operates on a new algorithm featuring three filters and uses moving averages (MA) to determine the trend. Recommendations: Max Spread: Trades will not be opened once the set spread value is reached. Slippage: Deviation from the price at the moment of order opening. Take Profit: 40 pips. Stop Loss: 35 pips. Lots: Trade size of 0.1. Timeframe: From M1 to D1. Currency Pairs: GBPUSD, EURUSD, and others. You can test th
Parabolic SAR Auto Trader EA v1.0 is a fully automated trading system for MetaTrader 4 based on the popular Parabolic SAR indicator, designed to follow market trends and capture momentum movements efficiently. This Expert Advisor automatically detects trend reversals using Parabolic SAR signals and executes trades with built-in risk management and trailing stop functionality. Key Features: Fully automated Parabolic SAR trading system Trend-following strategy using SAR reversal signals Fixe
Hello Guys! I want to share with you a very useful tools. Anyone of us who has used MT4 for some time knows how impractical this platform can be for discretionary trading. That's why I created this graphical interface!  Interface is very simple, all the info that you need are in the video and in the screenshot. NB: Before to run the EA Interface, remember to copy the file in the comment in your MT4 folder "Controls". PATH: .../MQL4/INCLUDE/CONTROLS NB: unfortunately the interface can't be test
購入後に包括的なユーザーガイドを入手するには、お問い合わせください。  MQL5のシルバー賞を受賞した開発者が精密に設計したHydra Trend Riderインジケーターで、あなたのトレーディング体験を向上させましょう。比類なき市場の洞察を提供し、意思決定プロセスを強化するこの高度なツールは、トレーダーがトレーディング戦略において精度と効率を追求するための完璧な選択肢です。 MQL5チャンネル に参加する 当社の製品をご購入いただくと、 PDF形式の包括的なユーザーガイドをお送りします。ご購入後にお問い合わせいただければ、 迅速にユーザーガイドをお送りします。 インジケーターの特徴: マルチタイムフレームダッシュボード:  当社の洗練されたダッシュボードで、異なるタイムフレームにわたる市場の全体像を把握しましょう。短期的な変動や長期的なトレンドを分析する際にも、Hydraインジケーターは一瞬も見逃さないようにします。 強力なトレンドシグナル:  強力なトレンドシグナル機能で市場に先んじましょう。このツールは市場のトレンドを特定し、それを活用するのに役立ち、タイムリーで情報に基づい
Arrow up down is a mt4 indicator that shows various levels to enter the market. It consists of two signals; Buy signal Sell signal Buy signals are shown as blue arrows on the chart once you install the indicator. Sell signals are shown as red signals on the chart. The indicator uses other underlying indicators like moving average together with statistical calculations to generate signals.
このプロダクトを購入した人は以下も購入しています
Scalper Inside PRO Scalper Inside PRO は、MetaTrader 4 向けの短期トレンドおよびスキャルピング用インジケーターです。独自アルゴリズムを用いて、市場の方向性と主要なターゲットレベルを素早く検出します。エントリー、イグジット、複数の利確ターゲットを自動計算し、詳細なパフォーマンス統計を表示することで、さまざまな銘柄やストラテジーがどのように機能してきたかを確認できます。これにより、現在のマーケットコンディションに最も適した取引銘柄を選択するのに役立ちます。さらに、Scalper Inside PRO には、お使いの矢印インジケーターを簡単に接続でき、その統計と過去のパフォーマンスを素早く評価できます。 本インジケーターは、あらゆる銘柄と時間足で動作し(短期トレードには M5 を推奨)、複数の内蔵ストラテジーを備えています。そのため、単体のスキャルピングツールとしても、トレーディングシステム内の強力な分析コンポーネントとしても活用できます。 主な機能 独自アルゴリズム(Next‑Generation Trend Detection Algor
Dynamic Forex28 Navigator - 次世代の Forex 取引ツール。 現在 49% オフ。 Dynamic Forex28 Navigator は、長年人気のインジケーターを進化させたもので、3 つの機能を 1 つにまとめています。 Advanced Currency Strength28 インジケーター (レビュー 695 件)  + Advanced Currency IMPULSE with ALERT (レビュー 520 件) + CS28 コンボ シグナル (ボーナス)。 インジケーターの詳細 https://www.mql5.com/en/blogs/post/758844 次世代の Strength インジケーターが提供するもの  オリジナルで気に入っていたすべての機能が、新機能と精度の向上によって強化されました。 主な機能: 独自の通貨強度計算式。 すべての時間枠でスムーズかつ正確な強度ライン。 トレンドの特定と正確なエントリーに最適です。 ダイナミックマーケットフィボナッチレベル (マーケットフィボナッチ)。 このインジケーターに固有
トレンドラインプロ   市場の真の方向転換点を理解するのに役立ちます。この指標は、真のトレンド反転と主要プレーヤーが再び参入するポイントを示します。 分かりますか     BOSライン   複雑な設定や不要なノイズなしに、より長い時間足でのトレンドの変化と重要なレベルを把握できます。シグナルは再描画されず、バーが閉じた後もチャート上に残ります。 VERSION MT 5     -     RFI LEVELS PRO インジケーター と組み合わせることで、その潜在能力を最大限に発揮します。 インジケーターが示す内容: 本当の変化   トレンド(BOSライン) 一度シグナルが現れたら、それは有効です!これは、リペイント機能を持つインジケーターとの重要な違いです。リペイント機能を持つインジケーターは、シグナルを発した後、それを変更し、資金の損失につながる可能性があります。これにより、より高い確率と精度で市場に参入できます。また、矢印が現れた後、目標値(利益確定)に達するか、反転シグナルが現れるまで、ローソク足の色を変更する機能もあります。 繰り返しエントリ       主要プレーヤーの
Enigmera
Ivan Stefanov
5 (8)
ENIGMERA: 市場の中心 重要:MQL5.comのデモはStrategy Testerで実行されており、Enigmeraの機能を完全には反映していない場合があります。詳細については、説明、スクリーンショット、ビデオをご確認ください。質問があれば、遠慮なくメッセージを送ってください! インジケーターのコードは完全に書き直されました。バージョン3.0は新機能を追加し、インジケーターの開始以来蓄積されたバグを修正しました。 紹介 このインジケーターとトレーディングシステムは、金融市場への注目すべきアプローチです。ENIGMERAはフラクタルサイクルを使用して、サポートとレジスタンスのレベルを正確に計算します。真の蓄積フェーズを示し、方向と目標を提供します。トレンドでも修正でも機能するシステムです。 動作方法 インジケーターのほとんどの機能は、チャートの左側にあるボタンで制御され、市場の状況に迅速に対応できるようになっています。 ボタン ON/OFF – インジケーター全体を表示または非表示にします。 Channel – サポートチャネルを有効にし、許容範囲の偏差を示します。 Dev
多くの矢印インジケーターは、シグナルだけを表示して、その後の判断はすべてトレーダー任せです。KT Alpha Hunter Arrows は、最初から完成されたトレードプランを提供します。 各シグナル矢印が表示されると、エントリーライン、ストップロス、4つのテイクプロフィット水準、そして現在の銘柄と時間足を今トレードする価値があるかを示すリアルタイムのエッジ判定が、チャート上にまとめて描画されます。付属の Trade Manager EA は、手動でエントリーした後の管理をサポートし、相場が荒れて感情が揺れやすい場面でも、トレードの規律を保ちやすくします。リペイントなし。確定足のみでシグナルを表示。Forex、ゴールド、指数、その他あなたが取引するあらゆる銘柄向けに設計されています。 主な機能 リペイントしない買い・売り矢印。シグナルは足が確定した後にのみ表示されます。 各シグナルにエントリーライン、構造的なストップロス、4つのテイクプロフィット水準を表示。 Edge Dashboard が、現在のチャート上で買いと売りのセットアップを個別に評価。 判定システム:No Edge、Ma
このインジケーターは実践的なトレードに最適な自動波動分析のインジケーターです! 場合... 注:   Tang Lun (Tang Zhong Shuo Zen) の命名規則の影響で、私は波のグレーディングに西洋の名前を使用することに慣れていません。基本的な波を ペン 、二次波のバンドを セグメント と名付けました。同時に、 セグメント にはトレンドの方向が指定されます (この命名方法は将来のノートで使用されます。最初に言っておきます)。ただし、アルゴリズムは曲がりくねった理論とはほとんど関係がないため、付けるべきではありません。これは、私の市場分析 によって要約された、絶えず変化する複雑な運用ルール を反映しています。 バンドは標準化され、人によって異なることがないよう定義されており、市場参入を厳密に分析する上で重要な役割を果たす人為的な干渉の描画方法が排除されています。 このインジケーターを使用することは、取引インターフェイスの美しさを改善することと同等であり、元の K ライン取引を放棄し、取引の新しいレベルに連れて行きます。また、宣伝の観点から顧客の認識も向上します。 イ
MTF Supply Demand Zones
Georgios Kalomoiropoulos
4.82 (22)
次世代の自動化された需要と供給のゾーン。どのチャートでも機能する新しい革新的なアルゴリズム。すべてのゾーンは、市場の価格行動に従って動的に作成されています。 2種類のアラート --> 1) 価格がゾーンに達したとき 2) 新しいゾーンが形成されたとき もう 1 つの役に立たない指標はありません。実績のある完全な取引戦略を手に入れることができます。     新機能:     価格が需給ゾーンに達したときにアラートを出す     新しい需給ゾーンが作成されたときにアラートを発します     プッシュ通知アラート     ピップ単位のゾーン幅ラベル     MTF のもう 1 つのタイムフレーム。したがって、現在より 2 時間足高いのではなく、現在より 3 時間足し上に見えるようになります。     アラート/ゾーン/MTF 機能を有効/無効にするボタン あなたが得る利点:     取引から感情を取り除きます。     取引エントリをオブジェクト化します。     確率の高いセットアップで利益を上げましょう。     描画ゾーンから時間を節約します。
トレンドトレーディング は、タイミングのプルバックとブレイクアウトにより、市場で起こっているトレンドから可能な限り利益を得るように設計された指標です。確立されたトレンドの中で価格が何をしているかを分析することにより、取引の機会を見つけます。 [ インストールガイド | 更新ガイド | トラブルシューティング | よくある質問 | すべての製品 ] 自信を持って効率的に金融市場を取引する むち打ちにならずに確立されたトレンドから利益を得る 収益性の高いプルバック、ブレイクアウト、早期の逆転を認識する この指標は、独自の品質とパフォーマンスを分析します 複数時間枠のダッシュボードを実装します インジケーターは再描画されていません 電子メール/音声/視覚アラートを実装します 確立されたトレンドは多くの取引機会を提供しますが、ほとんどのトレンド指標はそれらを完全に無視しています。インジケーターの解釈はかなり簡単です: (1) トレンドの変化 (2) トレンドの方向への後退 (3) トレンドの方向へのブレイクアウト 赤いダッシュ は下降トレンド中の修正です 青いダッシュ は上昇トレンド中
Step into the world of Forex trading with confidence, clarity, and precision using   Gold Indicator   a next-generation tool engineered to take your trading performance to the next level. Whether you’re a seasoned professional or just beginning your journey in the currency markets, Gold Indicator equips you with powerful insights and help you trade smarter, not harder. Built on the proven synergy of three advanced indicators, Gold Indicator focuses exclusively on medium and long-term trends eli
MetaBands M4
Vahidreza Heidar Gholami
3.5 (6)
MetaBandsは、強力でユニークなアルゴリズムを使用してチャンネルを描画し、トレンドを検出して、トレーダーに取引の入出ポイントを提供することができます。チャンネル指標に加えて、強力なトレンド指標でもあります。入力パラメータを使用して新しいチャンネルを作成するために、異なるタイプのチャンネルを統合することができます。MetaBandsは、市場のイベントについてユーザーに通知するために、すべてのタイプのアラートを使用します。 特徴 ほとんどのチャンネルアルゴリズムをサポート 強力なトレンド検出アルゴリズム 異なるタイプのチャンネルを統合する能力 マルチタイムフレームおよびマルチカレンシー(シグナルマトリックス) すべてのタイプのアラート機能(サウンド、画面フラッシャー、プッシュ通知、メール、ポップアップ、矢印) 再描画しない トレンド検出 MetaBandsは、チャネル内を振動する青いラインを使用してトレンドを検出します。ラインがチャネルの上部バンドに達すると、下降トレンドの開始を示し、下部バンドに達すると上昇トレンドの開始を示します。青いラインが中心ラインに近づくと、市場はコンソリ
Current event:  https://c.mql5.com/1/326/A2SR2025_NoMusic.gif A. A2SR とは何ですか ?   * 先行テクニカル指標です (塗り直しなし、ラグなし)。 -- ガイダンス : -- https://www.mql5.com/en/blogs/post/734748/page4#comment_16532516 -- そして https://www.mql5.com/en/users/yohana/blog A2SR には、サポート (需要) とレジスタンス (供給) のレベルを決定する特別な手法があります。 ネットで見かける通常の方法とは異なり、A2SR は実際の SR レベルを決定する独自のコンセプトを持っています。 元の手法はインターネットから取得されたものではなく、インターネット上で公開されたこともありません。 A2SR は、取引スタイルに応じて SR レベルを自動選択します。 時間枠を変更しても、SR レベルはその位置にとどまります。 実際のSRは、使用する時間枠から取得されるわけではないため. A2SR
M30/H1/H4スイング版もあります M5/M15では取りきれない大きな波を狙いたい方へ。 Gold Signal Swing Pro(M30/H1/H4対応)を販売中。 1トレードで$20〜$80+の値幅を狙う。 https://www.mql5.com/en/market/product/177643 KURAMA GOLD SIGNAL PRO(MT4版)— 7層フィルター・自動TP/SL・品質スコア搭載 XAUUSD完全トレードシステム リペイントなし。リドローなし。ラグなし。すべてのサインは確定後に変わりません。見たままが結果です。 特典:買い切りライセンスをご購入いただいた方に、AI Zone Radar($59相当)+PDFマニュアルを無料プレゼント。購入後にMQL5でメッセージをお送りください。 AI Zone Radar: https://www.mql5.com/en/market/product/175834 トレーダーから信頼されています:ゴールドトレーダーのコミュニ
BTMM State Engine Pro is a MetaTrader 4 indicator for traders who use the Beat The Market Maker approach: Asian session context, kill zone timing, level progression, peak formation detection, and a multi-pair scanner from a single chart. It combines cycle state logic with a built-in scanner dashboard so you do not need the same tool on many charts at once. What it does Draws the Asian session range; session times can follow broker server offset or be set in inputs. Tracks level progression (L
Price & Time Market Structure Indicator A professional market structure tool that analyzes waves through both price and time — not price alone. Main Description NeoWave PRO is a professional market structure indicator for MetaTrader 4 designed for traders who want to move beyond traditional one-dimensional wave tools such as ZigZag, swing indicators, and basic high/low systems. Most wave indicators analyze only one thing: Price. But a real market wave is not only a price movement. A true wave de
このインジケーターは、反転ポイントと価格戻りゾーンを正確に表示します。     主要プレーヤー 。新たなトレンドが形成される場所を把握し、最大限の精度で意思決定を行い、すべての取引をコントロールします。 TREND LINES PRO インジケーターと組み合わせることで、その潜在能力を最大限に発揮します。 VERSION MT5 インジケーターが示す内容: 新しいトレンドの始まりに活性化する反転構造と反転レベル。 リスクと報酬の比率を最小限に抑えた利益 確定 と 損失停止の レベルの表示     RR 1:2   。 インテリジェントな削減ロジックによるストップロス。 指定されたインジケーターから 2 つのトレンド タイプの反転パターンを表示します。 指標: トレンドを追う   TREND LINES PRO   (世界的なトレンドの変化) TREND PRO   (クイックトレンド変更) シンプルで効果的   スキャナー   リアルタイムトレンド(新機能)。 マルチタイムフレームのインストゥルメント フィルタリング。 画面   利益     LOGIC AI信号の後。 当日プラス方
Quant Direction
Georgios Kalomoiropoulos
Quant Direction は、3次元の市場分析ツールです。完全に客観的なアルゴリズムベースの市場分析を提供し、様々なパラメータにわたる正確なパーセンテージ偏差を同時に算出します。高度なAI搭載モデリングツールで開発され、厳密なテストを経て開発されたこのアルゴリズムは、かつてない精度で市場を分析するように設計されています。プラットフォーム上では、あらゆる通貨ペアや金融商品を分析できます。 短期取引、デイトレード、スイングトレードなど、どのような取引スタイルに も、Quant Directionは最適な選択肢です。 オペレーターの本当の利点 Quant Directionの真の利点は、感情、眼精疲労、過剰分析を完全に排除できる点にあります。方向性を探るために何十ものチャートを手作業で精査したり、自分の好みを常に疑ったりする必要がなくなります。このシステムは、8つの時間間隔(5ヶ月から月単位まで)をミリ秒単位で処理します。あらゆる瞬間に市場を支配している主体を正確に明らかにし、常に成功確率が最も高い方向で取引できるようにします。 市場分析の3つの側面 このアルゴリズムは市場を3つの
MonsterDash Harmonic Indicator is a harmonic pattern dashboard. It recognizes all major patterns. MonsterDash is a dashboard that displays all detected patterns for all symbols and (almost) all timeframes in sortable and scrollable format. Users can add their own user defined patterns . MonsterDash can open and update charts with the pattern found. Settings MonsterDash's default settings are good enough most of the time. Feel free to fine tune them to your needs. The color settings are for thos
The Propfolio Master Suite is the ultimate all-in-one analytical workstation for professional traders. Combining the power of the Beat The Market Maker (BTMM) methodology, Smart Money Concepts (SND/Liquidity), and Advanced Volume Profile, this suite replaces multiple different indicators with one optimized engine. Monitor up to 14 pairs simultaneously from a single chart, instantly identify market cycles, and seamlessly map institutional footprints with the click of a button. The Command Center
The indicator is built on a non-standard Zig Zag, it draws accumulations after which if the price leaves this zone and a test of this zone occurs, then a sound signal is given and an arrow appears - after the test candle closes.The indicator does not redraw its signals, it is very easy to use, there are only three settings 1- this is the zig zag parameter 2- this is the minimum price exit from the zone 3- this is the maximum price exit from the zone. The lower the parameter for Zig Zag, the more
NAM Order Blocks
NAM TECH GROUP, CORP.
3.67 (3)
MT4マルチタイムフレームオーダーブロック検出インジケーター。 特徴 -チャートコントロールパネルで完全にカスタマイズ可能で、完全な相互作用を提供します。 -必要な場所でコントロールパネルを表示および非表示にします。 -複数の時間枠でOBを検出します。 -表示するOBの数量を選択します。 -さまざまなOBユーザーインターフェイス。 -OBのさまざまなフィルター。 -OB近接アラート。 -ADRの高線と低線。 -通知サービス(画面アラート|プッシュ通知)。 概要 注文ブロックは、金融機関や銀行からの注文収集を示す市場行動です。著名な金融機関と中央銀行が外国為替市場を牽引しています。したがって、トレーダーは市場で何をしているのかを知る必要があります。市場が注文ブロックを構築するとき、それは投資決定のほとんどが行われる範囲のように動きます。 注文の構築が完了すると、市場は上向きと下向きの両方に向かって急激に動きます。注文ブロック取引戦略の重要な用語は、機関投資家が行っていることを含むことです。それらは主要な価格ドライバーであるため、機関投資家の取引を含むあらゆる戦
これはほぼ間違いなく、MetaTraderプラットフォームで見つけることができる最も完全な調和価格形成自動認識インジケーターです。 19種類のパターンを検出し、フィボナッチプロジェクションをあなたと同じように真剣に受け止め、潜在的逆転ゾーン(PRZ)を表示し、適切なストップロスとテイクプロフィットレベルを見つけます。 [ インストールガイド | 更新ガイド | トラブルシューティング | よくある質問 | すべての製品 ] 19の異なる調和価格形成を検出します プライマリ、派生および補完フィボナッチ投影(PRZ)をプロットします 過去の価格行動を評価し、過去のすべてのパターンを表示します この指標は、独自の品質とパフォーマンスを分析します 適切なストップロスとテイクプロフィットのレベルを表示します ブレイクアウトを使用して適切な取引を通知します すべてのパターン比をグラフにプロットします 電子メール/音声/視覚アラートを実装します スコット・M・カーニーの本に着想を得て、この指標は最も純粋で急を要するトレーダーのニーズを満たすように設計されています。ただし、トレードを容易にする
ゴールドラッシュ・トレンド・アロー・シグナル ゴールドラッシュ・トレンド・アロー・シグナル 指標は、XAU/USDにおける高速・短期スキャルパー向けに最適化された、正確でリアルタイムのトレンド分析を提供します。 1分足専用に設計されたこのツールは、明確なエントリーポイントを示す方向矢印を表示し、スキャルパーが変動の激しい市場状況でも自信を持って取引できるよう支援します。 この指標は、PRIMARY(主要)とSECONDARY(補助)のアラート矢印で構成されています。PRIMARYシグナルは、トレンドの方向転換を示す白と黒の方向矢印であり、SECONDARYシグナルは、PRIMARY矢印が示す方向を確認し、潜在的なエントリーポイントを示す青と赤の矢印です。 注意:トレンド方向の変化後にPRIMARYアラート矢印が1つだけ表示される場合、複数のSECONDARY青/赤矢印が表示される点に注意が必要です。SECONDARYシグナルは、シグナル基準を満たす任意のローソク足後に表示されます。したがって、長期的なトレンド移動の場合、画面に多くのSECONDARY矢印が表示されます(添付の
この製品は 2026 年の市場向けに更新され、最新の MT5 ビルドに最適化されています。 価格更新のお知らせ: Smart Price Action Concepts は現在 $200 で提供されています。 次の 30 件の購入 後、価格は $299 に上がります。 特別オファー: 購入後、私にプライベートメッセージを送ることで、 無料ボーナス + ギフト を受け取ることができます。 まず、このトレーディングツールはリペイントなし、再描画なし、遅延なしのインジケーターであり、プロフェッショナルな取引に最適であることを強調しておきます。 Online course , and manual Smart Price Action Concepts Indicator は、初心者から経験豊富なトレーダーまで使える非常に強力なツールです。20 種類以上の便利なインジケーターを 1 つにまとめ、Inner Circle Trader Analysis や Smart Money Concepts Trading Strategies などの高度な取引アイデアを組み合わせています。このインジケ
Cycle Sniper
Elmira Memish
4.39 (36)
Please contact us after your purchase and we will send you the complimentary indicators to complete the system Cycle Sniper is not a holy grail but when you use it in a system which is explained in the videos, you will feel the difference. If you are not willing to focus on the charts designed with Cycle Sniper and other free tools we provide, we recommend not buying this indicator. We recommend watching the videos about the indiactor and system before purchasing. Videos, settings  and descri
MV Arrow– Professional Swing Signal Indicator comment for set files and user manual. MV Arrow v4.0 is a precision-based MT4 arrow indicator designed to identify high-probability swing BUY and SELL zones using a multi-filter confirmation system. It focuses on market extremes , filtering noise and low-quality signals to deliver clear, well-spaced trade opportunities . This indicator is ideal for traders who prefer clean charts, disciplined entries, and confirmation-based signals rather than co
GOLD Impulse with Alert
Bernhard Schweigert
4.67 (12)
このインディケータは、当社の2つの製品 Advanced Currency IMPULSE with ALERT  +   Currency Strength Exotics . のスーパーコンビネーションです。 このインジケーターは全ての時間枠で作動し、8つの主要通貨と1つのシンボルの強弱のインパルスをグラフで表示します。 このインジケータは、金、エキゾチックペア、商品、インデックス、先物など、あらゆるシンボルの通貨強度の加速度を表示することに特化されています。金、銀、原油、DAX、US30、MXN、TRY、CNHなどの通貨強度の加速度(インパルスまたは速度)を表示するために、任意のシンボルを9行目に追加できる、この種の最初のものです。 新しいアルゴリズムに基づいて構築され、潜在的な取引の特定と確認がさらに容易になりました。これは、通貨の強さや弱さが加速しているかどうかをグラフィカルに表示し、その加速の速度を測定するためです。加速すると物事は明らかに速く進みますが、これはFX市場でも同じです。つまり、反対方向に加速している通貨をペアリングすれば、潜在的に利益を生む取引を特定
LHおよびHLブレイクアウトを見つけるための純粋な価格アクションによって行われる高度な計算。 それはあなたに市場で素晴らしい逆転ポイントを与えるでしょう。LHとHL信号は同様にトレイングルブレイクアウトに使用することができます。 ブレイクアウトが発生すると、強い反転を示します。移動平均の優れたフィルターです。トレンドインジケーターと一緒に使用することを強くお勧めします。 サポートとレジスタンス、供給需要指標の追加確認として使用できます。 詳細については、次の外国為替スレッドをご覧ください。 インジケーターは再描画されていません。 Buffers :   SetIndexBuffer ( 0 ,UpBar);      SetIndexBuffer ( 1 ,UpBar2);           SetIndexBuffer ( 2 ,DnBar);      SetIndexBuffer ( 3 ,DnBar2);           SetIndexBuffer ( 4 ,UpBarTop);      SetIndexBuffer ( 5 ,UpBarLow);     
The "MR Volume Profile 4" indicator is a charting tool that displays trading volume at different price levels rather than time intervals. A key concept in volume profile is the point of control (POC)—the price level with the highest volume traded during the session or time range. While tools like VWAP or OBV provide volume trends, the "MR Volume Profile 4" indicator offers granular detail about where the most market activity occurs at specific price levels. This makes it a more precise tool for
Автор: Александр Лапин --- Описание: Kinetic Trend — уникальный индикатор, основанный на математической модели затухания кинетической энергии цены. Он строит три независимые инерционные линии (основную, реверсную и зеркальную), а также отображает адаптивные зоны отклонения и их пересечения. Индикатор не использует стандартные индикаторы, такие как Moving Average или RSI, и предлагает абсолютно новый способ визуализации тренда и силы движения. --- ️ Что делает индикатор: Три инерц
ご紹介     Quantum Breakout PRO は 、ブレイクアウト ゾーンの取引方法を変革する画期的な MQL5 インジケーターです。 13年以上の取引経験を持つ経験豊富なトレーダーのチームによって開発された Quantum Breakout PROは 、革新的でダイナミックなブレイクアウトゾーン戦略により、あなたの取引の旅を新たな高みに押し上げるように設計されています。 クォンタム ブレイクアウト インジケーターは、5 つの利益ターゲット ゾーンを備えたブレイクアウト ゾーン上のシグナル矢印と、ブレイクアウト ボックスに基づいたストップロスの提案を提供します。 初心者トレーダーにもプロのトレーダーにも適しています。 量子EAチャネル:       ここをクリック MT5バージョン:   ここをクリック 重要!購入後、インストールマニュアルを受け取るためにプライベートメッセージを送ってください。 推奨事項: 時間枠: M15 通貨ペア: GBPJPY、EURJPY、USDJPY、NZDUSD、XAUUSD アカウントの種類: ECN、Raw、またはスプレッドが非
フィルタ:
レビューなし
レビューに返信