First Signal Pro
- インディケータ
-
HIRALKUMARI SANTOSHKUMAR VALAND
 If you find any bug or any error or have any suggestions, please let me know. I will try to fix it as soon as possible :)
You can also contact me if you have any features that you need in the indicator. - バージョン: 1.3
- アップデート済み: 12 8月 2020
- アクティベーション: 5
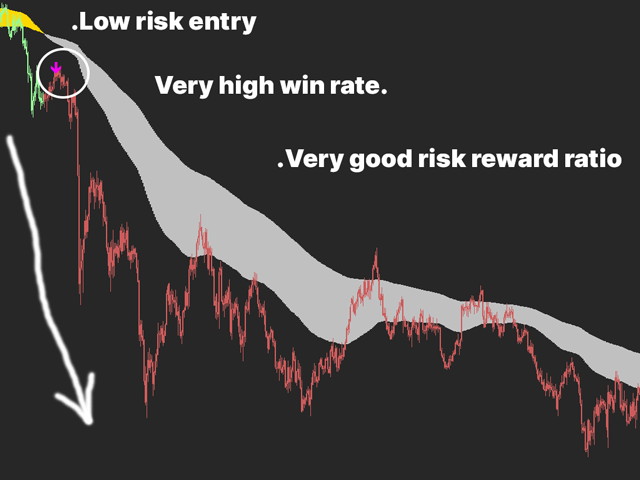
First Signal Pro is a simple yet powerful tool that helps find the first pullback after the trend change. Entering into a trader on first pullback has low risk and provides higher risk:reward ratio. This is by-far one of the best trading strategies known in the market and used by many successful traders and fund managers. You can also customize this indicator and enable "All Signals" to trade the ranging market. This shows that First Signal Pro works in trending as well as non-trending markets. First Signal Pro is not just an indicator, but a trading strategy itself. Following this strategy with discipline can be highly rewarding.
Check out how powerful this indicator is! [Video below]
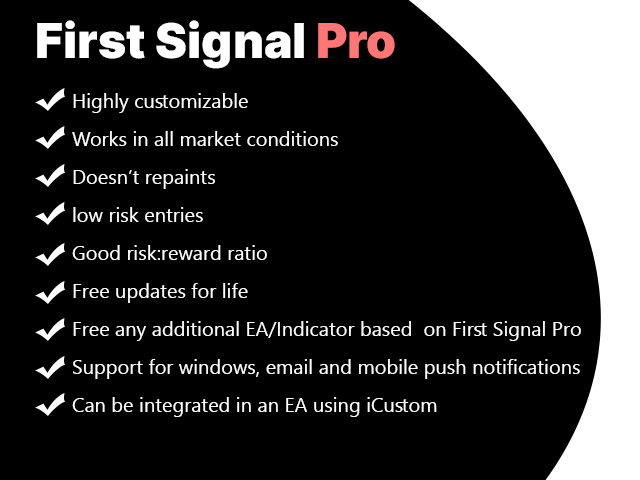
Why use First Signal Pro?
- Simple and easy to use.
- Great for novice traders as well as experienced traders.
- Low risk entries.
- Good risk:reward ratio
- Doesn't repaints.
- Works in both trending and non trending markets.
- No additional Indicator is needed except discipline.
- Any additional indicator or EA created based on First Signal Pro will be provided for FREE.
- Commitment to provide lifelong updates and supports to all owners of First Signal Pro.
- Popup Alerts, Push Notification and Email alerts.
- Can be integrated in Expert Advisors.
How to use First Signal Pro?
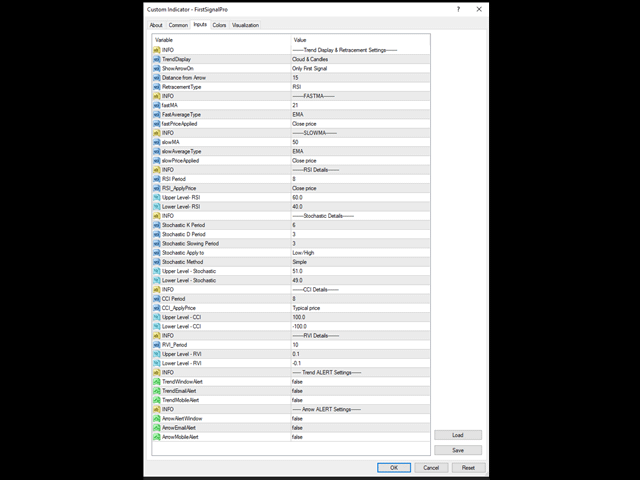
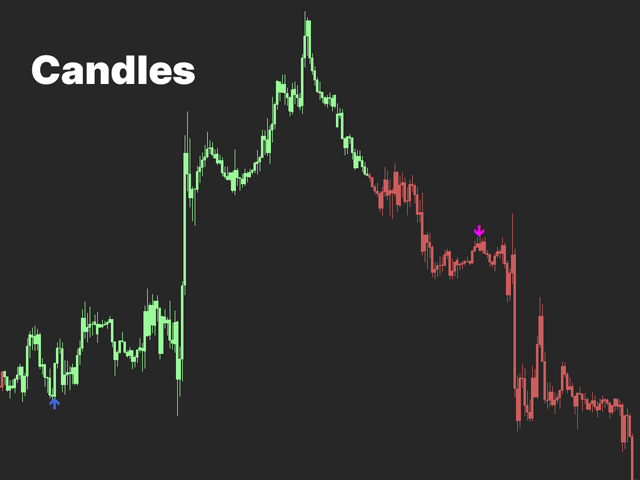
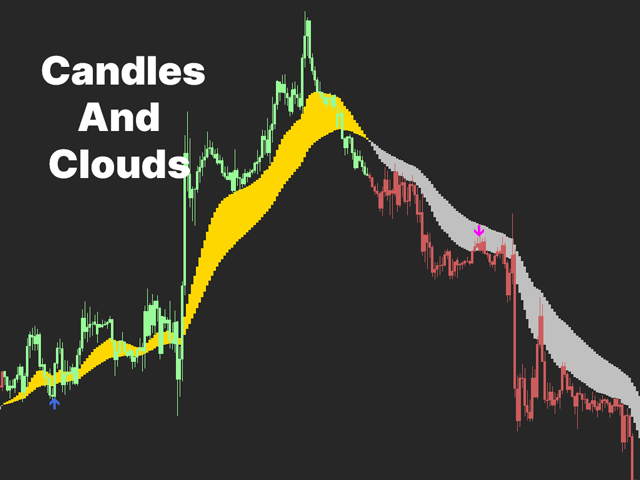
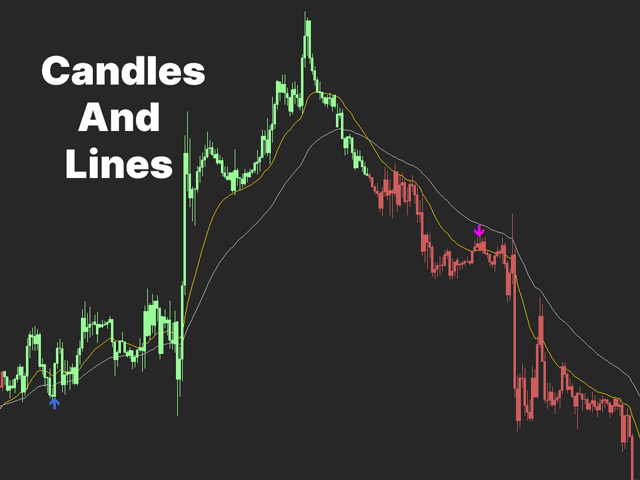
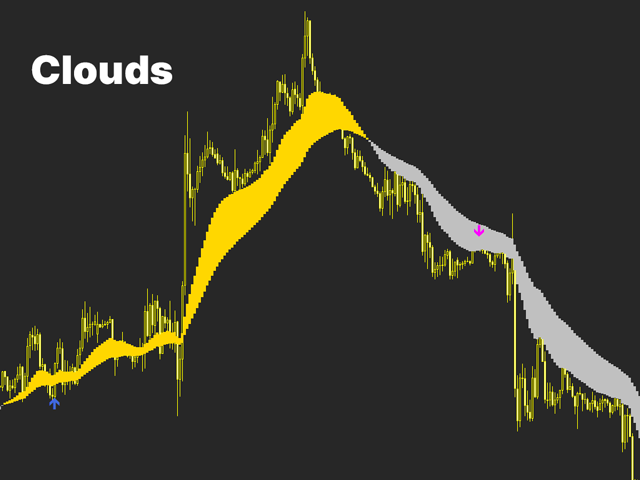
First Signal Pro is very straightforward to use. The trend is calculated based on Moving Averages. The arrows are calculated based on Oscillators.
Here is the list of currently supported Averages :- SMA (Simple Moving Average)
- EMA(Exponential Moving Average)
- SMMA (Smoothed Moving Average)
- LWMA (Linear-weighted Moving Average)
Here is the list of currently supported Oscillators.
- RSI (Relative Strength Index)
- Stochastic
- CCI ( Commodity Channel Index)
- RVI (Relative Vigor Index)
*More different types of Averages and Oscillators will be added over time.
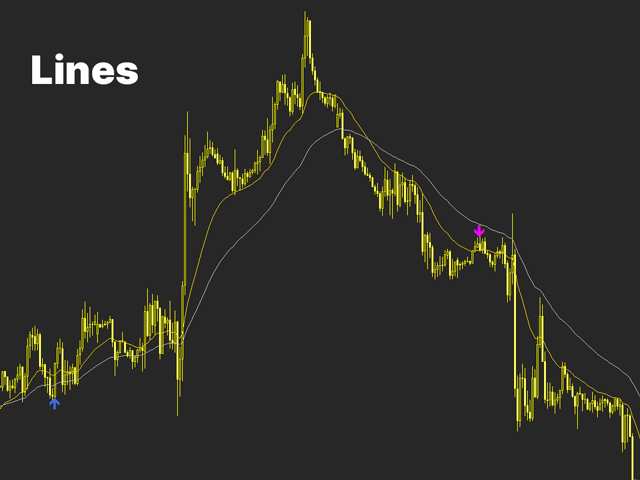
You can choose to decide to display the trend in the form of "Candles","Lines", "Cloud" or their combinations, "Candles & Lines" or "Clouds & Candles". In trending market, buy when the up arrow appears, sell when the down arrow appears. The stop-loss can be your recent low (when buying) or recent high (when selling).
In Non-trending Market, you might need to adjust and test your parameters for the oscillator you will use for arrows. Set "ShowArrowsOn" to "All Signals" to display all arrows. Buy when you see an up arrow, Sell when you see a down arrow. The stop-loss can be your recent low (when buying) or recent high (when selling). You can also disable the visualization of the trend by setting "trendDisplay" to "None" in input options. Trading non-trending market is much riskier. The market can be very volatile. Its best to avoid trading in such market conditions.
If you have done your fundamental research well, and wish to accumulate the securities or currency on each dip or trade only in one direction. You can set "ShowArrowsOn" to "Trend Based Signals" and buy when signal appears.
Do avoid trading during news events as markets can move heavy in any direction regardless of what technical indicators say!
To know learn more about indicator parameters, please visit here : https://www.mql5.com/en/blogs/post/738759
Thank you. Please contact me if you have any doubts or need support.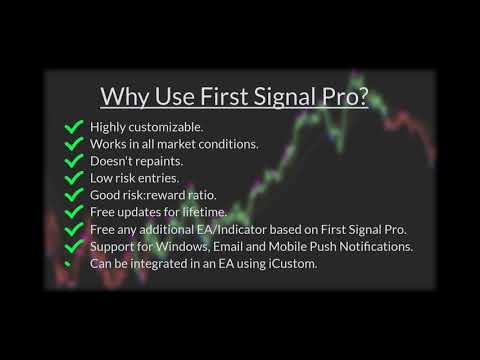


It's a good strategy Make my trading system better and also have good service.