MW Closing Time Alarm

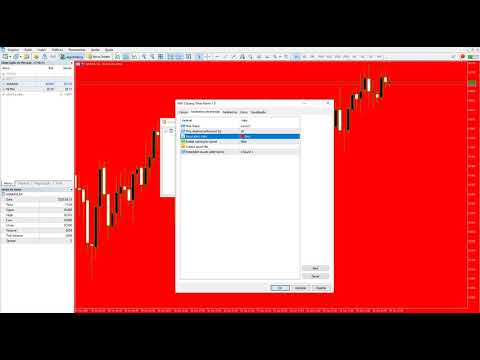
The Martinware™ Closing Time Alarm indicator serves to warn traders that the current period (bar, candle) is about to end.
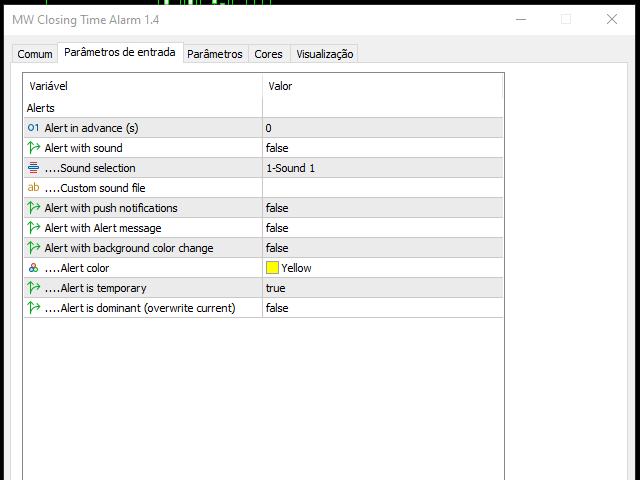
Input parameters:

Time offset: with how many seconds before the ending of the current period the alarm must trigger
Alert with sound: informs if the alert should include playing a sound
Sound selection: a list of sounds available
Custom sound: name of the custom sound file to be used in case "custom sound" was selected. It must be inside a folder named "Sounds", this one inside the "Files" folder in the Terminal's MQL5 directory tree.
Alert with push notifications: informs if the alert should include push notifications
Alert with Alert message: informs if the alert should include showing an Alert message
Alert with background color change: informs if the alert should include temporarily changing the chart's background-color
Alert color: the color to be used
Alert is temporary: if the background color change should last for around 1 second or until the chart is clicked
Alert is dominant: if the background color should overwrite a previously made change to the background color by another indicator


おすすめのプロダクト
This is a usefull utility for monitoring spread and also for recording informations to a file. (Files will be placed into "Common\Files\Spread Monitor"). There is the possibility to let the indicator calculate high/low into the past thanks to downloading ticks. (It's a slow and approsimate thing! The best way to use it is to attach to a chart and let it recording spread in real time). There is also a buffer with the average of spread in latest X periods. Easy and effective.
FREE
Statistical Arbitrage Spread Generator for Cointegration [MT5] What is Pair Trading? Pair trading is a market-neutral strategy that looks to exploit the relative price movement between two correlated assets — instead of betting on the direction of the market. The idea? When two assets that usually move together diverge beyond a statistically significant threshold, one is likely mispriced. You sell the expensive one, buy the cheap one , and profit when they converge again. It’s a statistica
FREE
Coral trend is   a trend-following indicator that is widely popular among FOREX traders . It is usually used as a confluence with other indicators. It uses combinations of moving averages with complex smoothing formulas! It has two configurable parameters: Coefficient   - smoothing ratio (*) Applied price Calculation: Coral = (-0.064) * B6 + 0.672 * B5 - 2.352 * B4 + 2.744 * B3
FREE
RSI Condition: The Relative Strength Index (RSI) for the current period is below a specified low threshold (RsiLow). This indicates oversold conditions. Candlestick Pattern: It checks for a specific candlestick pattern across three consecutive candles: The current candle (1) closes higher than it opens (bullish) The previous candle (2) closes lower than it opens (bearish) The current candle's close is below the high of the previous candle Price Action: The alert also checks that the current
FREE
The indicator shows the current spread of the symbol, the minimum, average and maximum values for the current bar in the form of digital, analog and graphic indicators. Has two modes of operation: fixing the system spread, or calculating the spread as the difference between the "Bid" and "Ask" prices on each incoming tick. Parameters  The indicator has a single input parameter: Type of calculation  - type of spread calculation. It can take the following values:  System spread  - the spread value
FREE
This is Gekko's indicator of quotations and variations. It summarizes quotations and variations of the current symbol in different timeframes as well as other correlated symbols. Keep track of all this information on your chart while you are negotiating for decision making support. Input Parameters General Settings:  configure which quotations and variations you want to keep track for current day, week, month or year as well as M1, M5, M15, M30, H1 and H4 charts; Symbols Configuration: add up to
FREE
Indicator and Expert Adviser  EA Available in the comments section of this product. Download with Indicator must have indicator installed for EA to work. Mt5 indicator alerts for bollinger band and envelope extremes occurring at the same time. Buy signal alerts occur when A bullish candle has formed below both the lower bollinger band and the lower envelope  Bar must open and close below both these indicators. Sell signal occur when A bear bar is formed above the upper bollinger band and upper
FREE
The indicator IQuantum shows trading signals for 10 symbols in the daily chart: AUDCAD, AUDUSD, EURUSD, GBPCAD, GBPCHF, GBPUSD, NZDUSD, USDCAD, USDCHF, and USDJPY. Signals of the indicator are produced by 2 neural models which were trained independently from one another. The inputs for the neural models are normalised prices of the symbols, as well as prices of Gold, Silver and markers of the current day. Each neural model was trained in 2 ways. The Ultimate mode is an overfitted neural model
FREE
Dynamic Supply and Demand indicator automatically identifies and displays Supply and Demand Zones on your chart based on price action patterns and market structure.  These zones represent areas where institutional buying or selling pressure has historically occurred, making them key levels for potential price reactions. This form of indicator takes inspiration from ICT as well as traditional Support & Resistance formation. **For the first 50 candles (number depends on LookBackCandles) when indic
FREE
SuperTrend Indicator – Description & Important Notice The SuperTrend is a composite technical indicator designed to help you identify the primary trend, measure its strength, and assess signal quality. However, an indicator is only a tool —it’s never 100% accurate and cannot replace sound risk management. 1. Core Formula & Components ATR (Average True Range): measures price volatility; customize sensitivity via Periods and Multiplier . Upper/Lower Bands: derived from ATR and your chosen source p
FREE
This indicator is very useful for day traders or short term traders. (MT5 version) No need to calculate the number of pips manually, just look at the chart and you will see the Virtual Take Profit / Virtual Stop Loss target line and evaluate whether the entry point is feasible to reach the intended target or not. Enter the intended   Take Profit / Stop Loss   pips for your trade. The indicator will display   Virtual Take Profit / Virtual Stop Loss   lines for you to easily see if the target is
FREE
The Zigzag Price Arrow indicator is an enhanced version of the classic Zigzag indicator, combining the traditional zigzag pattern with advanced visual features. It not only identifies major market turning points but also provides clear trading signals through: • Directional arrows: Displays colored arrows (green for buy, magenta for sell) indicating potential trend directions. • Price labels: Shows the exact price values at each pivot point directly on the chart. • Improved visual clarity: Make
FREE
インジケーター   Haven FVG   は、市場を分析するためのツールで、チャート上で非効率性の領域(Fair Value Gaps、FVG)を特定することができ、トレーダーに価格分析と取引決定のための主要なレベルを提供します。 他の製品 ->  ココ 主な特徴: 個別のカラー設定: ブルFVGの色   (Bullish FVG Color)。 ベアFVGの色   (Bearish FVG Color)。 柔軟なFVGの視覚化: FVGを検索するための最大ローソク足数。 FVGゾーンの追加延長(特定のバー数)。 FVGの塗りつぶしを有効にするオプション。 中央線(Middle Line): 線の色とスタイルの選択(例:点線)。 線の太さの調整。 一般設定: FVGを現在のバーまで拡張。 塗りつぶしのある歴史的なFVGを除外し、最新のデータに焦点を当てる。 チャート上の非効率性の領域を分析し、根拠のある取引決定を行う簡単で効果的な方法。
FREE
Apex WilliamsR MT5 Apex Williams %R MT5 is a professional technical indicator that enhances the traditional Williams %R oscillator with advanced momentum analysis and multiple quality filters. Key Features Intelligent Signal System - Automatic buy/sell signal generation - Quality filters to reduce false signals - Clear visual indicators on chart Advanced Divergence Analysis - Automatic divergence detection - Integrated price-oscillator analysis - Technical signal confirmation Multiple Filt
This indicator plots two linear regression channels on the chart for any currency pair or financial instrument, supporting the use of two different timeframes. The first channel uses a shorter period to identify local trends. The second channel uses a longer period to identify overall trends. Each channel displays a main regression line and two lines representing the deviation range. Users can adjust the period of each channel and select the desired timeframe. The indicator helps monitor price m
FREE
This Mt5 Indicator Signals when there is two opposite direction bars engulfed by current bar.  has a recent Exponential Moving Average Cross and past bar was oversold/bought Expert Advisor Available in Comments  Free Version Here : https://www.mql5.com/en/market/product/110114?source=Site&nbsp ; Full Alerts for mt5 terminal , phone , email, print to file, print to journal  Buy Signal ( blue line ) Past ema cross ( set at 30 bars back ) Past bar rsi is oversold ( level 40  ) Engulfing bar closes
FREE
This is MT5 version Get Tunnel Warrens MT4 here Here are several indicators that work together. It basically works with moving averages and various levels of ATR creating a dynamic channel through which the price is drained. As I always recommend, you should try it before using it in live so that you understand how it works. The market entry signal is similar to other MA indicators, but with this one you also have a graphical analysis of the moment when the trend is found and dynamic levels to
FREE
RSI abcd
Francisco Gomes Da Silva
3 (1)
RSI ABCDパターンファインダー:テクニカル戦略 1. インジケーターの仕組み 古典的RSI と ABCD調和パターン の自動検出を組み合わせたものです。 主要コンポーネント 標準RSI (調整可能な期間) 高値・安値マーカー (矢印) ABCDパターン (緑/赤の線) 過買(70)・過売(30)フィルター 2. MT5設定 period = 14 ; // RSI期間 size = 4 ; // 最大パターンサイズ OverBought = 70 ; // 過買水準 OverSold = 30 ; // 過売水準 Filter = USE_FILTER_ YES ; // 確認フィルター 3. 取引戦略 3.1. 買いエントリー(強気ABCD) 条件: RSIが以下を形成: 谷( A )→ 山( B )→ より高い谷( C ) D が過売域(30)より上だが C より下 確認:A-B-C-Dを結ぶ緑色の線 目標: TP1: B-Cの61.8% TP2: B-Cの100% ストップロス: D より下 3.2. 売りエントリー(弱気ABCD) 条件: RSIが以下を形成: 山( A
FREE
平均足(ヘイキンアシ)MT5インジケーター 平均足(ヘイキンアシ)MT5インジケーターは、標準的な価格データをより滑らかでトレンドに沿ったローソク足に変換し、市場トレンドや潜在的な反転ポイントをより簡単に識別できるようにする強力なツールです。 主な特徴: 明確なトレンド識別: 異なるローソク足の色で上昇トレンドと下降トレンドを視覚的に区別します。 ノイズの低減: 価格変動をフィルタリングし、 市場の主要な動きをより明確に表示します。 早期トレンド検出: 標準チャートでトレンドの変化が明らかになる前に、 潜在的なトレンド変化を予測します。 汎用性: 単独で使用することも、 他のテクニカル指標と組み合わせて総合的な分析を行うこともできます。 カスタマイズ可能な設定: インジケーターを特定の取引設定や戦略に合わせて調整できます。 メリット: トレンドを特定し、 潜在的なエントリーポイントと出口ポイントを識別する能力を向上させます。 市場ノイズの影響を減らし、 重要な価格変動に集中します。 市場ダイナミクスをより明確に理解することで、 より情報に基づいた取引決定を行うことができます。 検証済
FREE
FlatBreakout MT5 (Free Version) Flat Range Detector and Breakout Panel for MT5 — GBPUSD Only FlatBreakout MT5   is the free version of the professional FlatBreakoutPro MT5 indicator, specially designed for flat (range) detection and breakout signals on the   GBPUSD   pair only. Perfect for traders who want to experience the unique fractal logic of FlatBreakout MT5 and test breakout signals on a live market without limitations. Who Is This Product For? For traders who prefer to trade breakout of
FREE
Ideal for scalpers, day traders and swing trades. Automatically identifies key support and resistance levels based on historical price data. It displays real-time trading zones and a precise countdown timer for each candle, helping traders make faster and more confident decisions. Fully customizable for multiple timeframes and instruments. The indicator analyzes historical price data to draw horizontal levels that represent key trading areas. It also displays, in real time, the current zone whe
FREE
概要 このインジケーターは、クラシックな ドンチャンチャネル を強化したバージョンで、実践的なトレード機能を追加しています。 標準の3本線(上限、下限、中央線)に加え、 ブレイクアウト を検出し、チャート上に矢印で視覚的に表示します。また、チャートを見やすくするために、 現在のトレンド方向と逆側のラインのみを表示 します。 インジケーターの機能: 視覚的シグナル :ブレイクアウト時にカラフルな矢印を表示 自動通知 :ポップアップ、プッシュ通知、Eメール RSIフィルター :市場の相対的な強弱に基づいてシグナルを検証 カスタマイズ可能 :色、ラインの太さ、矢印コード、RSI閾値など 動作原理 ドンチャンチャネルは次のように計算します: 上限線 :直近N本のクローズ済みローソク足の最高値 下限線 :直近N本のクローズ済みローソク足の最安値 中央線 :最高値と最安値の平均値 上方ブレイクアウト は終値が上限線を超えたときに発生し、 下方ブレイクアウト は終値が下限線を下回ったときに発生します。 インジケーターは以下を行います: 3本のドンチャンラインを描画 方向転換後の最初のブレイクアウト
FREE
Do you like scalping? Th is indicator displays information about the latest price quotes received from the broker. [ Installation Guide | Update Guide | Troubleshooting | FAQ | All Products ] Identify tick trends easily A blue row means the price has increased A red row means the price has decreased Customizable colors and font sizes Display your desired amount of rows The indicator is non-repainting Parameters Rows: amount of rows with data to display in the chart Font size: font size of the t
FREE
Basic Supply Demand MT5
Mehran Sepah Mansoor
4.61 (38)
基本的な需給インジケータは、あなたの市場分析を強化し、あらゆるチャート上の重要な機会領域を特定するために設計された強力なツールです。直感的で使いやすいインターフェイスで、この無料のメタトレーダー用インディケータは、需給ゾーンを明確に表示し、より多くの情報に基づいた正確な取引判断を可能にします /  MT4無料版 この指標のダッシュボードスキャナー: ( Basic Supply Demand Dashboard ) 特徴 チャートの需給ゾーンを自動的にスキャンし、面倒な手動分析を不要にします。 直近の需給ゾーンまでの残り距離をグラフィカルに表示 供給ゾーンは特徴的な色で強調表示され、需要ゾーンは別の色で表示されるため、迅速かつ正確な解釈が可能。 このインディケータは、最も近い供給ゾーンまたは需要ゾーンとチャート上の現在価格との距離をpips単位で自動的に計算し、明確かつ定量的な指標を提供します。pips単位の距離はチャート上にはっきりと見やすく表示され、現在価 格との距離が大きい、または小さいエリアを素早く特定できます。 需給ゾーンの接近やブレイクを警告 どのタイムフレームでも機
FREE
The indicator identifies when a divergence occurs between price and an indicator or oscillator. It identifies both regular and hidden divergences. Combined with your own rules and techniques, this indicator will allow you to create (or enhance) your own powerful system. For higher probability setups I can recommend you to use my Supply Demand indicator and trade only if the divergence occurs inside a zone. Supply zone for bearish div and demand zone for bullish div. The optimal scenario is if it
FREE
Multi-timeframe trend indicator based on the ADX / ADXWilder indicator with Fibonacci levels The indicator shows trend areas using ADX or ADXWilder indicator data from multiple timeframes. The impulse mode of the indicator allows you to catch the beginning of a trend, and several "Screens" with different timeframes allow you to filter out market noise. Fibonacci levels are added to the price chart, which have flexible settings. How the indicator works: if PDI is greater than NDI, then   it`s
FREE
Unlock Consistent Results with the MACD Indicator Across Multiple Markets Experience the power of our advanced MACD indicator, designed to deliver reliable buy and sell signals on a wide range of trading pairs and timeframes. Whether you trade forex, stocks, or cryptocurrencies, our indicator adapts seamlessly to your strategy. Multi-Chart Compatibility: The MACD indicator works effortlessly across various currency pairs, stocks, and assets, providing clear entry and exit signals on every chart.
FREE
OHLC Smart Candle
Syamsurizal Dimjati
5 (1)
Ritz Smart OHLC Candle Ritz Smart OHLC Candle is an advanced price-action candle indicator that enhances standard OHLC candles with smart momentum analysis, volatility validation, and directional bias filtering — all displayed directly through candle colors. This indicator is designed for traders who want clean charts, early momentum detection, and reduced false signals, without adding extra lines or panels. Main Features Smart OHLC Strength Analysis, Evaluates candle strength using OHLC prog
FREE
This indicator displays buy or sell signals according to Bill Williams' definition of the Trading Zone. [ Installation Guide | Update Guide | Troubleshooting | FAQ | All Products ] Easy to use and understand Avoid trading flat markets Deterministic indicator with clear rules The indicator is non-repainting It implements alerts of all kinds It has straightforward trading implications. A blue arrow is a buy signal A red arrow is a sell signal According to Bill Williams trading in the zone helps t
FREE
Inside Bar Radar
Flavio Javier Jarabeck
4.67 (6)
The Inside Bar pattern is a very well known candlestick formation used widely by traders all over the world and in any marketplace. This approach is very simple and adds a little confirmation candle, so it adds a third past candlestick to the count to confirm the direction of the move (upward or downward). Obviously, there is no power on this candlestick formation if the trader has no context on what it is happening on the market he/she is operating, so this is not magic, this "radar" is only a
FREE
このプロダクトを購入した人は以下も購入しています
このインジケーターを購入すると、プロ仕様のトレードマネージャーを無料で差し上げます。 まず第一に、このトレーディングシステムがノンリペイント、ノンリドロー、ノンラグのインジケーターであることを強調する価値がある。これにより、手動取引とロボット取引の両方に理想的なものになっています。 オンラインコース、マニュアル、プリセットのダウンロード。 「スマートトレンドトレーディングシステム MT5」は、新規および経験豊富なトレーダー向けにカスタマイズされた包括的なトレーディングソリューションです。10以上のプレミアムインジケーターを組み合わせ、7つ以上の堅実なトレーディング戦略を備えており、多様な市場状況に対応する多目的な選択肢となっています。 トレンドフォロー戦略:トレンドを効果的に乗り越えるための正確なエントリーとストップロス管理を提供します。 リバーサル戦略:潜在的なトレンドの反転を特定し、トレーダーがレンジ相場を活用できるようにします。 スキャルピング戦略:高速で正確なデイトレードおよび短期取引のために設計されています。 安定性:すべてのインジケーターはノンリペイント、ノンリドロー、ノ
Power Candles – あらゆる市場に対応した強度ベースのエントリーシグナル Power Candles は、Stein Investments が長年培ってきた強度分析を価格チャート上に直接反映します。価格だけに反応するのではなく、各ローソク足は実際の市場の強さに基づいて色分けされ、モメンタムの蓄積、強度の加速、明確なトレンド転換を瞬時に把握できます。 すべての市場に共通する単一ロジック Power Candles は すべての取引シンボル で自動的に動作します。現在のシンボルが Forex か非 Forex 市場かを自動判別し、内部で適切な強度モデルを適用します。 Forex および Gold :FX Power のデルタ値を使用(絶対値レンジ最大 100) 指数、暗号資産、CFD :IX Power の強度値を使用(絶対値レンジ最大 50) 必要な強度計算は Power Candles に直接組み込まれています。ローソク足のカラーリングやシグナルロジックに、追加のインジケーターは不要です。 価格ノイズではなく「強度状態」 各ローソク足は、以下の 9 つの明確に定義された強
Gold Sniper Scalper Pro - MetaTrader 5 用 ゴールド (XAU/USD) トレーディングシステム 真剣なトレーダーのために: 複数の市場分析要因を組み合わせた、構造化され、データ駆動型の方法論でゴールド取引に取り組みます。このツールは、あなたのゴールド取引分析をサポートするために構築されています。 限定価格の機会 これは、価格が上昇する前に Gold Sniper Scalper Pro を所有するチャンスです。 その後の購入 10 件ごとに $50 ずつ上昇します。 最終価格: $498 あなたの分析的優位性を定義する機能 Gold Sniper Scalper Pro は、深い洞察と明確な統計的優位性を提供するために設計された包括的なツールキットです: システム、入力のカスタマイズ、およびインジケーター使用時の注意事項を含む詳細なインジケーター使用ガイドは、以下の MQL 記事に記載されています。ドキュメントを参照してください。 Gold Sniper Scalper Pro - Gold (XAU/USD) Trading System o
このインジケーターを購入された方には、以下の特典を 無料 で提供しています: 各トレードを自動で管理し、ストップロスとテイクプロフィットを設定し、戦略ルールに基づいてポジションを決済する補助ツール 「Bomber Utility」 様々な銘柄に合わせたインジケーターの設定ファイル(セットファイル) 「最小リスク」、「バランスリスク」、「待機戦略」 の3つのモードで使用できる Bomber Utility 用の設定ファイル このトレーディング戦略をすぐに導入・設定・開始できる ステップバイステップのビデオマニュアル ご注意: 上記の特典を受け取るには、MQL5のプライベートメッセージシステムを通じて販売者にご連絡ください。 オリジナルのカスタムインジケーター 「Divergence Bomber(ダイバージェンス・ボンバー)」 をご紹介します。これは、MACDのダイバージェンス(乖離)戦略に基づいた 「オールインワン」型のトレーディングシステム です。 このテクニカルインジケーターの主な目的は、価格とMACDインジケーターの間に発生するダイバージェンスを検出 し、将来の価格の動きを示す
Entry In The Zone and SMC Multi Timeframe は、Smart Money Concepts(SMC)に基づいて開発された リアルタイム市場分析ツール です。 本システムは、トレーダーがマーケットストラクチャーを体系的に分析し、市場全体の方向性をより明確に把握できるよう設計されています。 システムは複数の時間軸にわたり、 反転ポイント(Reversal Points)・主要ゾーン(Key Zones)・マーケットストラクチャー を自動的に解析します。さらに、 POI(Point of Interest)・ノーリペイントシグナル・Auto Fibonacci Levels を表示し、プルバックや反転ポイントを高精度で検出します。 リアルタイムシグナルとアラートにより、価格が主要ゾーンに到達したときや、ゾーン内で反転シグナルが発生した際に、重要な機会を逃すことはありません。 また、本システムは インジケーター と シグナルシステム の両方の機能を兼ね備えた 2-in-1ツール であり、ゾーン分析とリアルタイムエントリーシグナルを一体化しています。 さらに
ARIPoint
Temirlan Kdyrkhan
1 (1)
ARIPoint is a powerful trading companion designed to generate high-probability entry signals with dynamic TP/SL/DP levels based on volatility. Built-in performance tracking shows win/loss stats, PP1/PP2 hits, and success rates all updated live. Key Features: Buy/Sell signals with adaptive volatility bands Real-time TP/SL/DP levels based on ATR Built-in MA Filter with optional ATR/StdDev volatility Performance stats panel (Success, Profit/Loss, PP1/PP2) Alerts via popup, sound, push, or email Cu
発売プロモーション Azimuth Proは先着 100 名様限定で 299 ドルでご提供します。 最終価格は 499 ドルとなります。 リテールとインスティテューショナルのエントリーの違いはインジケーターではなく、ロケーションにあります。 多くのトレーダーは、モメンタムを追いかけたり、遅行シグナルに反応して、任意の価格レベルでエントリーします。機関投資家は、需給が実際にシフトする構造的なレベルに価格が到達するのを待ちます。 Azimuth Proはこれらのレベルを自動的にマッピングします:スイングアンカーVWAP、マルチタイムフレーム構造ライン、高確率ロケーションにのみ出現するABCパターン。 Azimuth Proは、構造分析とインテリジェントな自動化の両方を求めるプロフェッショナルトレーダー向けに構築されています。 Azimuthが外科的精度で市場構造をマッピングする一方、Azimuth Proはインテリジェンスレイヤーを追加します:トレーディングスタイルの自動検出、スマート設定された移動平均線、20年のデータでバックテストされた最適化パラメータ。その結果、お使いの
Game Changerは、あらゆる金融商品で使用できる革新的なトレンドインジケーターです。メタトレーダーを強力なトレンドアナライザーへと変貌させます。このインジケーターは再描画や遅延がありません。あらゆる時間枠で動作し、トレンドの特定、反転の可能性のシグナル、トレーリングストップ機能、そして迅速な市場反応のためのリアルタイムアラートを提供します。経験豊富なプロ、あるいは優位性を求める初心者の方でも、このツールは自信と規律を持ち、トレンドの根底にあるダイナミクスを明確に理解した上で取引を行うための力となります。 購入後すぐにご連絡いただくと、個人ボーナスを進呈いたします!強力なサポートとトレンドスキャナーインジケーターの無料コピーもご用意しておりますので、お気軽にプライベートメッセージでご連絡くださ. 私のEAやスペシャルセットはTelegramでは販売しておりません。Mql5のみで販売しており、セットファイルはこちらのブログでのみ公開し ております 。詐欺師にはご注意ください。他の方からセットを購入しないでください。 設定 トレンド変化時のアラートを有効にする - True/Fals
FX Power: 通貨の強弱を分析して、より賢い取引を実現 概要 FX Power は主要通貨と金の実際の強弱をあらゆる市場状況で理解するための必須ツールです。強い通貨を買い、弱い通貨を売ることで、 FX Power は取引の意思決定を簡素化し、高い確率の取引機会を見出します。トレンドを追従する場合でも、極端なデルタ値を使用して反転を予測する場合でも、このツールはあなたの取引スタイルに完全に適応します。ただ取引するだけではなく、 FX Power で賢く取引をしましょう。 1. なぜ FX Power がトレーダーにとって非常に有益なのか 通貨と金のリアルタイム強弱分析 • FX Power は主要通貨と金の相対的な強弱を計算し、マーケットダイナミクスに関する明確な洞察を提供します。 • どの資産がリードしているか、または後れを取っているかを監視して、取引するペアを賢く選びましょう。 マルチタイムフレームの包括的なビュー • 短期、中期、長期のタイムフレームで通貨と金の強弱を追跡し、マーケットトレンドに基づいて取引戦略を調整できます。 • スキャルピングからスイングトレード
まず第一に、この取引インジケーターは再描画されず、再描画されず、遅延しないことを強調する価値があります。これにより、手動取引とロボット取引の両方に理想的なものになります。 ユーザーマニュアル:設定、入力、戦略。 アトミックアナリストは、価格の強さとモメンタムを利用して市場でより良いエッジを見つけるためのPA価格アクションインジケーターです。ノイズや誤ったシグナルを除去し、取引ポテンシャルを高めるための高度なフィルターを備えています。複雑なインジケーターの複数のレイヤーを使用して、アトミックアナリストはチャートをスキャンし、複雑な数学的計算をシンプルなシグナルと色に変換します。これにより、どのような初心者トレーダーでも理解して使用し、一貫した取引の決定を行うことができます。 「アトミックアナリスト」は、新規および経験豊富なトレーダー向けにカスタマイズされた包括的な取引ソリューションです。プレミアムインジケーターとトップノッチの機能を1つの取引戦略に組み合わせ、すべてのタイプのトレーダーにとって汎用性のある選択肢にします。 デイリートレーディングとスキャルピング戦略:高速で正確なデイ
Quantum TrendPulse を ご紹介します。これは、   SuperTrend   、   RSI   、および Stochastic のパワーを 1 つの包括的なインジケーターに組み合わせて、取引の可能性を最大限に引き出す究極の取引ツールです。精度と効率を求めるトレーダー向けに設計されたこのインジケーターは、市場のトレンド、勢いの変化、最適なエントリー ポイントとエグジット ポイントを自信を持って特定するのに役立ちます。 主な特徴: SuperTrend 統合: 現在の市場動向に簡単に追従し、収益性の波に乗ることができます。 RSI精度: 買われすぎと売られすぎのレベルを検出し、市場の反転のタイミングに最適で、SuperTrendのフィルターとして使用されます。 確率的精度: 確率的振動を活用して、変動の激しい市場で隠れたチャンスを見つけます。SuperTrend のフィルターとして使用されます。 マルチタイムフレーム分析:   M5 から H1 または H4 まで、さまざまなタイムフレームで市場を常に把握します。 カスタマイズ可能なアラート: カスタム取引条件が満たされ
トレンド スクリーナー インジケーターでトレンド取引の力を解き放ちます。ファジー ロジックと複数通貨システムを活用した究極のトレンド取引ソリューションです。 ファジー ロジックを活用した革新的なトレンド インジケーターである Trend Screener を使用して、トレンド取引を向上させます。 これは、13 を超えるプレミアム ツールと機能、および 3 つの取引戦略を組み合わせた強力なトレンド追跡インジケーターであり、Metatrader をトレンド アナライザーにする多用途の選択肢となります。 期間限定オファー : トレンド スクリーナー インジケーターは、わずか 100 ドルで生涯ご利用いただけます。 (元の価格 50$ ) (オファー延長) Trend Screener の 100% 非再描画精度の揺るぎない精度を体験して、取引の決定が過去の価格変動の影響を受けないようにしてください。 マルチタイムフレームおよびマルチ通貨機能の多用途性を解放し、比類のない自信を持って外国為替、商品、暗号通貨、インデックスの世界を取引できるようにします。 Trend Screener の包括的な
Smart Stop Indicator – チャート上で実現するインテリジェントなストップロス精度 概要 Smart Stop Indicator は、ストップロスを勘や感情ではなく、明確で体系的に設定したいトレーダーのために設計されています。本ツールは、クラシックなプライスアクション(高値更新・安値切り下げ)と最新のブレイクアウト認識ロジックを組み合わせ、次に来るべき論理的なストップレベルを正確に特定します。トレンド相場、レンジ、急速なブレイクアウト局面のいずれであっても、最適な SL ゾーンとその状態(“new”、“broken”、“valid”)をチャート上に直接表示します。さらに今回、SL 距離の %ADR 表示も新たに追加されています。 主な特徴 マーケット構造に基づく自動ストップ配置 • 市場構造とリアルタイムの値動きに基づき、意味のあるストップロスレベルを自動検出します。 スマートなブレイクアウト感知 • 急激な方向転換やブレイクアウトにも柔軟に対応し、早すぎるストップ調整を避けます。 SL %ADR の表示 • ストップロスまでの距離を ADR(Averag
優れたテクニカルインジケーター「Grabber」をご紹介します。これは、すぐに使える「オールインワン」トレーディング戦略として機能します。 ひとつのコードに、市場のテクニカル分析ツール、取引シグナル(矢印)、アラート機能、プッシュ通知が強力に統合されています。 このインジケーターを購入された方には、以下の特典を無料で提供します: Grabberユーティリティ:オープンポジションを自動で管理するツール ステップバイステップのビデオマニュアル:インジケーターのインストール、設定、取引方法を解説 カスタムセットファイル:インジケーターをすばやく自動設定し、最大限の成果を出すための設定ファイル 他の戦略はもう忘れてください!Grabberだけが、あなたを新たなトレードの高みへと導いてくれるのです。 Grabber戦略の主な特徴: 推奨タイムフレーム:M5〜H4 対応通貨ペア・資産:どれでも使用可能ですが、私が実際に検証した以下を推奨します(GBPUSD、GBPCAD、GBPCHF、AUDCAD、AUDUSD、AUDSGD、AUDCHF、NZDUSD、NZDCAD、EURCAD、EURUSD、E
まず第一に、この取引ツールはノンリペイント、ノンリドロー、ノンラグの指標であり、プロの取引に理想的ですことを強調する価値があります。 オンラインコース、ユーザーマニュアル、デモ。 スマートプライスアクションコンセプトインジケーターは、新米から経験豊富なトレーダーまで、非常 に強力なツールです。Inner Circle Trader AnalysisやSmart Money Concepts Trading Strategiesなど、20以上の有用な指標を1つに組み合わせています。このインジケーターはスマートマネーコンセプトに焦点を当て、大手機関の取引方法を提供し、彼らの動きを予測するのに役立ちます。 特に、流動性分析に優れており、機関がどのように取引しているかを理解しやすくしています。市場のトレンドを予測し、価格の動きを慎重に分析するのに優れています。機関の戦略とトレードを合わせることで、市場の動向についてより正確な予測ができます。このインジケーターは多目的であり、市場構造を分析し、重要な注文ブロックを特定し、さまざまなパターンを認識するのに優れています。 このインジケーター
Trend Ai indicatorは、トレンドの識別と実用的なエントリポイントと反転アラートを組み合わせることで、トレーダーの市場分析を強化する優れたツールです。 この指標は、ユーザーが自信と正確さで外国為替市場の複雑さをナビゲートすることを可能にします トレンドAiインジケーターは、主要なシグナル以外にも、プルバックやリトレースメント中に発生するセカンダリエントリポイントを識別し、トレーダーが確立されたトレンド内の価格修正を活用できるようにします。 重要な利点: *MT4およびMT5の仕事 *明確な買いまたは売りシグナル *再描画しません ·すべての資産で動作します 私はeaやセットをtelegram it詐欺で販売しないように注意してください。 すべての設定はここでブログで無料です。  重要! 指示とボーナスを得るために購入後すぐに私に連絡してください! 私の他のプロダクトと同様、実質操作の監視はここに見つけることができます: https://www.mql5.com/en/users/mechanic/seller&nbsp ; 設定および入力: すべての
これまでに、 素晴らしいバックテスト結果、 驚くべき数値を持つ ライブ口座のパフォーマンス証明 、そして あらゆる場所での統計情報 がある取引インジケーターを購入し、しかし使用後に 口座を破綻させてしまった ことは何度ありますか? シグナル単独を信用すべきではありません。そもそもなぜそれが表示されたのかを知る必要があります。そして、それこそがRelicusRoad Proの得意とすることです! ユーザーマニュアル + 戦略 + トレーニングビデオ + VIPアクセス付きプライベートグループ + モバイル版利用可能 市場の見方を変える新しい方法 RelicusRoadは、FX、先物、仮想通貨、株式、指数に対応する、 世界で最も強力で最高の取引インジケーター であり、トレーダーが口座を 成長させる ために必要なすべての情報とツールを提供します。 初心者 から 上級者 まで、 すべてのトレーダー が成功できるよう、 テクニカル分析 と 取引計画 を提供します。 これは、将来の市場を 予測する のに十分な情報を提供する 主要な取引インジケーター です。私たちは、チャート上で意味をなさない複
IX Power MT5
Daniel Stein
4.92 (12)
IX Power: 指数、商品、暗号資産、外国為替市場の洞察を発見 概要 IX Power は、指数、商品、暗号資産、外国為替市場の強弱を分析するための多用途ツールです。 FX Power が全ての利用可能な通貨ペアデータを活用して外為ペアで最高の精度を提供する一方、 IX Power は基礎資産の市場データにのみ焦点を当てています。この特性により、 IX Power は非外為市場に最適であり、単純な外為分析にも信頼性の高いツールです。どのチャートでもスムーズに機能し、取引判断を向上させるための明確で実行可能な洞察を提供します。 1. IX Power がトレーダーにとって価値がある理由 複数市場での強弱分析 • IX Power は指数、商品、暗号資産、外為シンボルの強弱を計算し、それぞれの市場に合わせた洞察を提供します。 • US30、WTI、ゴールド、ビットコイン、または通貨ペアなどの資産を監視して取引機会を発見できます。 幅広い市場に適応 • 外為取引では、 FX Power が関連する全ての通貨ペアを分析することで比類のない精度を提供します。 • IX Power
- Real price is 80$ - 45% Discount (It is 45$ now) Contact me for extra bonus   indicator, instruction or any questions! - Lifetime update free - Non-repaint - Related product: Gann Gold EA - I just sell my products in Elif Kaya Profile, any other websites are stolen old versions, So no any new updates or support. Advantages of  M1 Scalper Pro  Profitability: M1 Scalper Pro is highly profitable with a strict exit strategy. Frequent Opportunities: M1 Scalper Pro  takes advantage of numerous smal
Gold Entry Sniper – ゴールドスキャルピング&スイングトレード用プロフェッショナル多時間足ATRダッシュボード Gold Entry Sniper は、XAUUSDや他の銘柄向けに正確な 売買シグナル を提供する、MetaTrader 5用の高度なインジケーターです。 ATRトレーリングストップロジック と 多時間足分析ダッシュボード を搭載し、スキャルピングからスイングトレードまで対応します。 主な特徴と利点 多時間足シグナル分析 – M1、M5、M15 のトレンドを同時表示。 ATRベースのトレーリングストップ – ボラティリティに応じて動的に調整。 プロ仕様のチャートダッシュボード – シグナル状況、ATRレベル、回帰線、売買方向を表示。 明確な売買マーカー – 自動矢印とテキストラベル。 エグジットアラートとトレード管理 – 利益確定のための自動検出。 完全カスタマイズ可能 – パネル位置、色、フォント、ATR/回帰設定を調整可能。 ゴールド(XAUUSD)に最適化 – M1〜M15のスキャルピングに最適、FXや指数、暗号資産にも対応。 Gold Entry
Berma Bands
Muhammad Elbermawi
5 (7)
Berma Bands (BBs) インジケーターは、市場のトレンドを特定して活用したいトレーダーにとって貴重なツールです。価格と BBs の関係を分析することで、トレーダーは市場がトレンド段階にあるか、レンジ段階にあるかを判断できます。 詳細については、[ Berma Home Blog ] をご覧ください。 バーマ バンドは、上部バーマ バンド、中部バーマ バンド、下部バーマ バンドの 3 つの異なる線で構成されています。これらの線は価格の周りにプロットされ、全体的な傾向に対する価格の動きを視覚的に表します。これらのバンド間の距離から、ボラティリティや潜在的な傾向の反転についての洞察を得ることができます。 バーマ バンドの線がそれぞれ離れると、市場が横ばいまたはレンジ相場の期間に入っていることを示すことがよくあります。これは、明確な方向性の偏りがないことを示しています。トレーダーは、これらの期間中にトレンドを特定するのが難しいと感じる可能性があり、より明確なトレンドが出現するまで待つ場合があります。 バーマ バンドの線が 1 本の線に収束すると、強いトレンド環境の兆候となること
Prices move for many reasons and these can vary from one operator to another: software, private and institutional traders simultaneously contribute to the formation of the price, making predictive art very difficult. However, there are measurable factors that bind the price to an underlying trend in line with the physical reality that the financial asset represents: these are the macroeconomic indicators. Large investors use this information wisely to set their strategies. Understanding these m
Matreshka
Dimitr Trifonov
5 (2)
Matreshka self-testing and self-optimizing indicator: 1. Is an interpretation of the Elliott Wave Analysis Theory. 2. Based on the principle of the indicator type ZigZag, and the waves are based on the principle of interpretation of the theory of DeMark. 3. Filters waves in length and height. 4. Draws up to six levels of ZigZag at the same time, tracking waves of different orders. 5. Marks Pulsed and Recoil Waves. 6. Draws arrows to open positions 7. Draws three channels. 8. Notes support and re
現在33%オフ 初心者にもエキスパートトレーダーにも最適なソリューション このインジケーターは独自の機能と新しい公式を多数内蔵しており、ユニークで高品質かつ手頃な取引ツールです。このアップデートでは、2つの時間枠ゾーンを表示できるようになります。より長いTFだけでなく、チャートTFとより長いTF(ネストゾーンを表示)の両方を表示できます。すべてのSupply Demandトレーダーの皆さんのお気に召すはずです。:) 重要情報の公開 Advanced Supply Demandの可能性を最大化するには、 https://www.mql5.com/ja/blogs/post/720245 にアクセスしてください。   エントリーまたはターゲットの正確なトリガーポイントを正確に特定できれば取引がどのように改善されるか想像してみてください。新しい基盤となるアルゴリズムに基づいて構築されているため、買い手と売り手の間の潜在的な不均衡をさらに簡単に特定できます。これは、最も強い需要と供給のゾーンと、過去のパフォーマンス(古いゾーンを表示)がグラフィカルに表現されるためです。これらの機能は、最適な
サポートとレジスタンススクリーナーは、1つのインジケーター内に複数のツールを提供するMetaTraderの1つのレベルインジケーターにあります。 利用可能なツールは次のとおりです。 1.市場構造スクリーナー。 2.強気のプルバックゾーン。 3.弱気プルバックゾーン。 4.デイリーピボットポイント 5.毎週のピボットポイント 6.毎月のピボットポイント 7.ハーモニックパターンとボリュームに基づく強力なサポートとレジスタンス。 8.銀行レベルのゾーン。 期間限定オファー:HVサポートおよびレジスタンスインジケーターは、50ドルと生涯でのみご利用いただけます。 (元の価格125 $) MQL5ブログにアクセスすると、分析例を含むすべてのプレミアム指標を見つけることができます。 ここをクリックしてください。 主な機能 ハーモニックおよびボリュームアルゴリズムに基づく強力なサポートおよびレジスタンスゾーン。 ハーモニックおよびボリュームアルゴリズムに基づく強気および弱気のプルバックゾーン。  市場構造スクリーナー 毎日、毎週、毎月のピボットポイント。 ドキュメント すべてのサポートおよび
TPSproTrend PRO は、市場が実際に方向転換する瞬間を識別し、動きの開始時にエントリー ポイントを形成します。 価格が動き始めた直後に市場に参入し、すでに動き出した後に参入してはいけません。 インジケーター   シグナルを再描画せず、エントリーポイント、ストップロス、テイクプロフィットを自動的に表示するため、取引が明確かつ視覚的かつ構造化されます。 説明書 RUS   -   MT4 バージョン 主な利点 再描画のない信号。 すべての信号は固定です。 矢印が表示された場合 -     もう変化したり消えたりすることはありません。 誤ったシグナルのリスクなしに、安定したデータに基づいて取引の決定を下すことができます。 既製の買い/売りエントリーポイント このインジケーターは、取引を開始するのに最適なタイミングを自動的に決定し、チャート上に矢印で表示します。 推測や主観的な分析は不要。明確なシグナルだけです。 自動ストップロスとテイクプロフィットゾーン 信号の直後に次のものが表示されます: エントリーポイント リスク制限ゾーン(ストップロス) 利益確定ゾーン これにより、
Ace Trend
Mikhail Sergeev
5 (2)
私たちはあなたにトレンド取引の世界でゲームのルールを変える革命的な指標を提示します。 指標は、パフォーマンスを再考し、前例のない高さにあなたの取引経験を高めるように設計されています。 私たちの指標は、競合他社とは一線を画す高度な機能のユニークな組み合わせを誇っています。 "実質の価格設定要因"の先端技術は最も困難で、揮発市況の最高の安定性を保障する。 不安定なパターン、壊れた指標に別れを告げ、意識的で制御された取引を歓迎します。 指標は単なる美しい絵ではありません! 指標は、トレーダーの側にオッズをシフトし、それによって利益を得る必要があります。 インジケータ信号(完全自動モード)に基づいて取引結果に慣れる: https://www.mql5.com/ja/signals/2339244 AceTrendは、rbtiバージョンによるトレンド指標のランキングで第一位にランクされています。 インターネット上の"AceTrend trend indicatorのテスト"に関する情報を検索することで、詳細を調べることができます。 AceTrend-取引における最大の収益性と制御。 私たちの指標
Quantum Trend Sniper
Bogdan Ion Puscasu
4.74 (53)
ご紹介   クォンタム トレンド スナイパー インジケーターは 、トレンド反転を特定して取引する方法を変革する画期的な MQL5 インジケーターです。 13年以上の取引経験を持つ経験豊富なトレーダーのチームによって開発されました。     クォンタムトレンドスナイパーインジケーター   は、非常に高い精度でトレンドの反転を識別する革新的な方法で、あなたのトレーディングの旅を新たな高みに押し上げるように設計されています。 ***Quantum Trend Sniper Indicatorを購入すると、Quantum Breakout Indicatorを無料で入手できます!*** クォンタム ブレイクアウト インジケーターは、トレンドの反転を特定するとアラートを発し、矢印を示し、3 つのテイクプロフィットレベルを提案します。 初心者トレーダーにもプロのトレーダーにも適しています。 量子EAチャネル:       ここをクリック MT4のバージョン:       ここをクリック 推奨事項: 期間:すべての時間枠。最良の結果を得るには、M15、M30、H1 のタイムフ
Easy Buy Sell is a market indicator for opening and closing positions. It becomes easy to track market entries with alerts. It indicates trend reversal points when a price reaches extreme values ​​and the most favorable time to enter the market. it is as effective as a Fibonacci to find a level but it uses different tools such as an algorithm based on ATR indicators and Stochastic Oscillator. You can modify these two parameters as you wish to adapt the settings to the desired period. It cannot
FX Levels: あらゆる市場における非常に高精度なサポート&レジスタンス 概要 通貨ペア、株式指数、個別銘柄やコモディティなど、どのような市場でも信頼できるサポートとレジスタンスを特定したいですか? FX Levels は伝統的な “Lighthouse” メソッドと先進的な動的アプローチを融合し、ほぼ汎用的な精度を実現します。ブローカーの実務経験を活かし、自動化されたデイリー更新とリアルタイム更新を組み合わせることで、 FX Levels は反転ポイントを見つけ、利益目標を設定し、自信をもってトレードを管理するための手助けをします。今すぐ試してみて、サポート/レジスタンス分析の正確性がどれほどトレードを向上させるかを実感してください! 1. FX Levels がトレーダーにとって非常に有用な理由 非常に正確なサポート&レジスタンスゾーン • FX Levels は異なるブローカー環境でもほぼ同一のゾーンを生成するよう設計されており、データフィードの差異や時刻設定のずれによる不一致を解消します。 • つまり、どのブローカーを利用していても一貫したレベルが得られるため、戦
作者のその他のプロダクト
The Martinware Manual Trading Helper indicator is aimed at helping people start their lives in manual trading. It can be used to display both some generic images at the right side of the graph, where custom operational remarks may be displayed or just a blank rectangle hiding the chart while backtesting. Moreover, it can periodically play a list of sounds. To show a blank rectangle, let the first image name input field empty and select the desired color. To show one or more custom images inste
FREE
MW Volume
Martin Bittencourt
3.8 (5)
The Martinware Volume indicator plots a colored moving average over volume bars. The coloring uses three colors and can be done in different ways choosable by the user and is applied both to the average as to the volume bars. Three types of coloring are possible: None: no coloring is done Increasing or decreasing: changes the color depending on the current value being bigger or lesser than the previous one Volume relative to average: colors vary if the current volume is bigger or lesser then
FREE
The Martinware Eye Rest Reminder serves to periodically remind traders to rest their eyes without the need for a tool outside MT5. Input parameters: Periodicity: play the alert every n minutes Alert with sound: define if the alert should include playing a sound Custom sound file: name of the custom sound file to be used instead of the default. It must be inside a folder named "Sounds", this one inside the "Files" folder in the Terminal's MQL5 directory tree. Alert with Alert message: informs
FREE
The Martinware Market Sides' Strength indicator shows the candlestick chart in a different manner allowing for a clearer view of which side, bullish or bearish is dominating the asset in the current period. As a bonus, it can also show an internal area that can be used to visualize two levels of Fibonacci retracements inside the bars. The default configuration shows the MSS bars with 4 main colors, two representing the bullish force, and two representing the bearish one. The primary colors ar
The Martinware Direction by Candle Body Analysis indicator is a direction indicator that shows the current asset direction, up or down, by checking if previous candle bodies' bases were respected or broken. It works similarly to a moving average, but it's more objective due to its lesser amount of configuration parameters. The algorithm assumes the theory that although the highs and lows of candles have their value, it is the body that shows the conclusive market sentiment over that asset in
フィルタ:
Aleksandr Tamonin
4108
Aleksandr Tamonin 2021.01.24 13:37 
 

ユーザーは評価に対して何もコメントを残しませんでした

レビューに返信