Chart Slice MT5
- インディケータ
- バージョン: 2.0
- アクティベーション: 5
Chart Slice is a very convenient multi-timeframe indicator, with which you can see market information at once on several time slices. This will allow the trader to learn quickly and most importantly understand the vibrant market. The author himself went this way and this indicator helped incredibly.
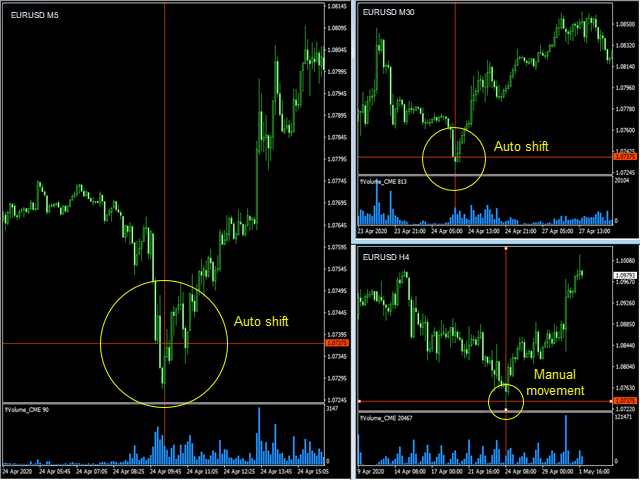
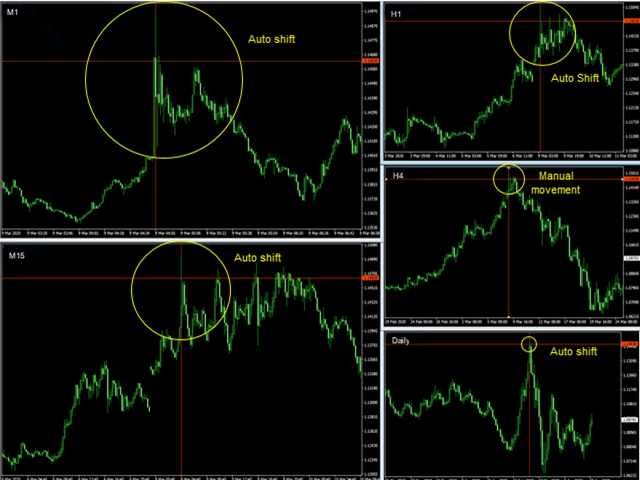
You probably have often wanted to see in detail why at a given point in time the price was rapidly moving away from a certain level or, on the contrary, stopping there. And for this you had to change the scale, then look for this place on a smaller timeframe, and if you need to further refine or switch back, the procedure became very cumbersome. Now, in an instant, all this can be seen immediately at least in all time slices. To do this, with the help of 2 lines you can manage all the charts. Moreover, you can move these lines in any sequence on different charts, everything is connected dynamically. Thus, it is very easy and efficient to “dig” a significant piece of the market in a short time. These lines are always at hand, and the trader, as it were, automatically learns all the time, since along the way he constantly watches how the price behaved in one place or another, in one or another connection with volumes, levels, lines, patterns, etc.
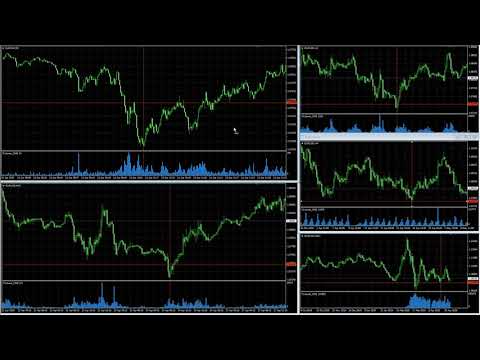
This indicator is set on each chart (at least two), after which only two lines appear on each chart - horizontal (price) and vertical (time). Moving these lines on one chart, on all the others they move automatically and, if necessary, shift the screen to the right place. This allows you to see the market immediately at different time slices.
Chart Slice is great for different timeframes of one financial instrument, but it can be used on different financial instruments, and only time will change, since everyone has their own prices. Any combination of different timeframes and different financial instruments is also possible. It is especially effective to use this indicator on several monitors, since the workspace is large, there is a lot of information, and you can manage all the charts with one click.
The settings are very simple, it is only a graphic design of the lines.
Chart Slice is a technical tool for market research, in fact it is a “shovel”, and you will have to "dig" deep;). Good luck to all!