ChannelsLRSD

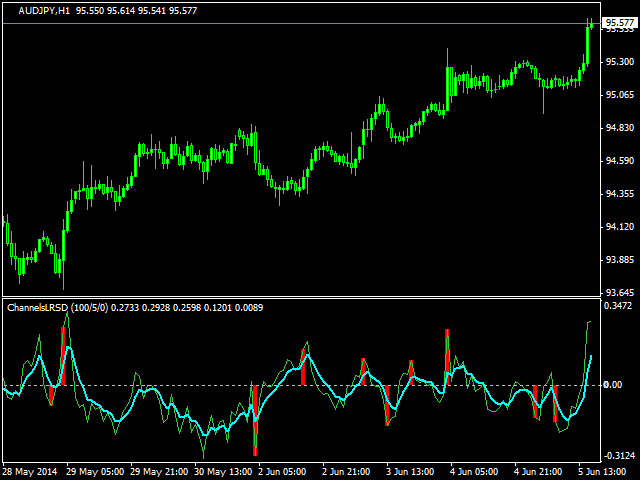
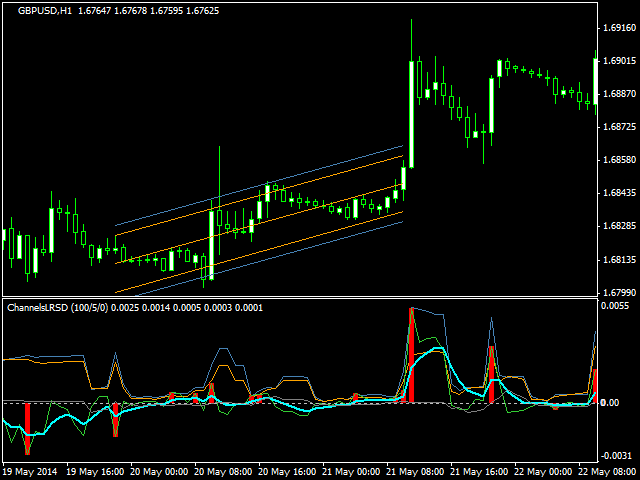
This is a breakout indicator using Linear Regression (LR) and Standard Deviation (SD) adaptive channels. It finds a best fitting of linear regression and standard deviation channels on consecutive bars, then monitors prices on breaking out the channel, and if so - generates a signal.

The best fitting is performed by picking up the channels length which provides less difference between LR and SD channels width. On every bar the channels may have different - adaptive - length.

Indicator displays price line (green) as an offset from the channel center line on the current bar, smoothed price line (light blue) and red histogram with signals up or down on bars where breakout of the channel occurs. In addition, indicator can optionally display LR (blue) and SD (orange) channels widths and current channel angle (gray).

Parameters:

  • CountPeriodMax - maximal period (channel length) to estimate for best fitting; default - 100;
  • CountPeriodMin - minimal period (channel length) to estimate for best fitting; default - 5;
  • MaxBars - number of bars to process; default - 1 000; do not set a large value, because calculations of channels for a bunch of periods on every bar may consume a lot of CPU resources; set to 1 when called from the Expert Advisor;
  • Shift - index of the bar, at which LR and SD channels will be displayed on the main chart if Explain is true; default - 1;
  • PriceType - price type to use; default - close;
  • Factor - a threshold used for signal detection - when the price line (module) is Factor times larger than the channel width, a signal is activated; default - 1;
  • MAPeriod - period of price line smoothing by EMA; default - 5;
  • Explain - enable/disable output of additional buffers with SD and LR channels widths, and channel angle; default - false; also, if this parameter set to true, channels are shown on the main chart at the bar number Shift.

The following trading strategies are suggested:

  1. use up and down signals to open buy or sell orders;
  2. trade buy when smoothed price line crosses zero line up, trade sell when it crosses zero line down.

おすすめのプロダクト
インディケータは現在のクオートを作成し、これを過去のものと比較して、これに基づいて価格変動予測を行います。インジケータには、目的の日付にすばやく移動するためのテキスト フィールドがあります。 オプション: シンボル - インジケーターが表示するシンボルの選択; SymbolPeriod - 指標がデータを取る期間の選択; IndicatorColor - インジケータの色; HorisontalShift - 指定されたバー数だけインディケータによって描画されたクオートのシフト; Inverse - true は引用符を逆にします。false - 元のビュー。 ChartVerticalShiftStep - チャートを垂直方向にシフトします (キーボードの上下矢印)。 次は日付を入力できるテキストフィールドの設定で、「Enter」を押すとすぐにジャンプできます。
インジケータは、指定された係数に基づいて、低、高、極端なボリュームを検索し、指定された色でそれらをペイントします。 Metatraderターミナルの標準ボリューム描画機能に置き換えられます。 キャンドルは、ボリュームの色で着色することもできます。 極端なボリュームを持つローソク足では、最大水平ボリューム(クラスタ/POC)が決定されます。 その位置(押す、中立、停止)に応じて、クラスターにも独自の色があります。 クラスターが影の中にあり、ろうそくが極端なボリュームを持っている場合、反転のための矢印が得られます。 設定でアラートを有効にすることができます。 さらに、インジケーターには、クラスターをシャドウで表示する別のオプションがあります。 入力パラメータ 。 (色と視覚的な設定に関連するいくつかはスキップされます) 。 基本設定 。 Bars Count – 指標が機能する履歴バーの数 。 Data Source - 見積期間の選択。 あなたが切り捨てられ、不完全なように過去の歴史を見ると思われる場合は、あなたが勉強している楽器のためのより多くのM1引用符をダウンロー 。 Ver
Was: $299  Now: $99   Supply Demand uses previous price action to identify potential imbalances between buyers and sellers. The key is to identify the better odds zones, not just the untouched ones. Blahtech Supply Demand indicator delivers functionality previously unavailable on any trading platform. This 4-in-1 indicator not only highlights the higher probability zones using a multi-criteria strength engine, but also combines it with multi-timeframe trend analysis, previously confirmed swings
AWキャンドルパターンインジケーターは、強力なキャンドルパターンスキャナーと組み合わせた高度なトレンドインジケーターの組み合わせです。これは、最も信頼性の高い30のローソク足パターンを認識して強調表示するための便利なツールです。さらに、それは色付きのバーに基づく現在の傾向分析器です。     サイズ変更と配置が可能なプラグインマルチタイムフレームトレンドパネル。トレンドフィルタリングに応じてパターンの表示を調整する独自の機能。 利点: キャンドルパターンを簡単に識別 結果を再描画しません 内蔵のマルチタイムトレンドパネル 無効なパターンタイプ(1、2、3キャンドル) パターン表示時のトレンドフィルタリングの調整 MT5 version - >   HERE   / Instructions and description  -> HERE 表示されるパターンのリスト: ハンマーパターン ピンアップ/ピンダウン 弱気なハラミ/強気なハラミ 弱気のハラミクロス/強気のハラミクロス ピボットポイント反転アップ/ピボットポイント反転ダウン ダブルバーローとハイクローズ/ダブルバーローとロークロ
Trade Like an Institution. Protect Like a Professional. Early Sniper Access: Limited Launch Offer! Get ready to elevate your trading precision. We are offering an exclusive, highly limited launch price for the first Dynamic Trend Sniper users. Our Unbeatable Launch Offer: First 10 Snipers Only: $69 (Full lifetime access + all v1.x updates) Standard Retail Price (After 10 Purchases): $129 Why Act Now? This is not just a discount; it's a strategic entry point. We are committed to rewarding o
Roll
Svyatoslav Kucher
The Roll indicator is designed for finding local extremes and determining the current trend. The indicator is based on the volume and volatility values. Indicator calculation can be modified by activating the Modification parameter and choosing one of the available calculation options from CalcMode . To be able to determine current trend using this indicator, you should increase the value of the OsPeriod parameter and decrease the values of DynamicLevelPeriod and ShiftDynamicLevel . The indicato
戦略ゾーン x3、x4、x5回タッチ    |   TP1/TP2/TP3 ポイント または 値   |   リスク/リワード比率の安全性を視覚的に確認 再描画なし、遅延なしのインジケーター - 手動とロボット取引に最適 - すべての資産とすべての時間枠に対応 期間限定オファー  その後 >> $99 に戻ります 購入後、 推奨およびカスタマイズ設定のためにお問い合わせください [ バージョン MT5  -  MT4  | 勝率を最大化する他の3つのツールを確認: TrendDECODER / PowerZONES / BladeSCALPER ] 概要 当社のインジケーターは初めて、チャート上で 3つの概念 を視覚的に結び付けます: 市場がテストするゾーン テイクプロフィットレベル サポートゾーン(ストップロス)とレジスタンスゾーン(テイクプロフィット)間のリスク/リワード比率 PowerZONES はあなたの取引ルーティンを変え、 衝動的な取引を止める のに役立ちます。 私たちは基本的なサポートとレジスタンスの概念に新機能を追加して革新しました: ゾーン:  ラインより
Pipsurfer
Clinton Keenan Obinna Butler
Overview: With so much noise and distraction in the markets I wanted to create clarity for traders to have a simple, efficient, and fun trading experience. This is why I created Pipsurfer. Pipsurfer is an trend following indicator that visually shows you important Institutional Smart Money levels in the market and helps you to trace Market Structure in the markets. Most traders find it difficult to visually see trading elements such as trend, structure and momentum which are key for understandin
The principle of constructing indicator lines and their meaning .               The Signal Channel   indicator uses a robust filtering method based on two moving medians applicable to the High and Low prices, i.e. the lines <High> and <Low>, where <..> is the sign of linear averaging, which are shifted by certain values ​​in an uptrend and by opposite values ​​in a downtrend, which allows you to get a narrow channel, approximately outlining each bar. Sharp kinks of the lines of such a channel a
複数のアセットと複数の時間単位でTrendDECODERシグナルを取得|エントリーする最適な時間単位を決定|利益と勝ちトレードを最大化する 非再塗り、非遅延インジケーターおよびスクリーナー - 手動および自動取引に最適 - すべての資産およびすべての時間単位に対応 $49  最初の50コピーのため - その後 $99 購入後、 コメントを残すかレビューを残してください 、そして99ドル相当の追加インジケーターを送ります。 それは何についてですか? このスクリーナーは、最も評価の高い TrendDECODER の補完ツールです。 これにより、以下のことが可能になります: お気に入りの資産の現在のトレンドアップおよびトレンドダウンのシグナルを、取引に関連するすべての時間枠で取得 利益のためのトレンドフォローやスイングトレードに最適な時間枠の構成を即座に確認 これらの最も有利な時間枠の構成とは? まず、マルチタイムフレームチャートのセットアップを確保します: 下位 / メイン / 上位時間単位 次に、 メイン時間枠が上位時間枠と同じ方向に動く資産 を選択します。 どの資産に適用さ
LEADING AND LAGGING INDICATORS DASHBOARD https://www.mql5.com/en/users/earobotkk/seller#products P/S: If you like this indicator, please rate it with 5 stars in the review section, this will increase its popularity so that other users will be benefited from using it. This dashboard scans all time frames(M1,M5,M15,M30,H1,H4,D1,W1,MN1) and shows up trend and down trend for MACD, PSAR, RSI, STOCHASTIC, MOVING AVERAGE, BOLLINGER BANDS by changing the colours of the relevant boxes.   It also shows ca
FREE
VALUE EDITION LIMITED   は、市場分析における明快さ、正確さ、スピードを求めるトレーダーのために開発された高度なテクニカル指標です。MetaTrader 4および5と互換性があり、スマートなオーバーボート/オーバーソルドゾーン、ダイナミックプライスチャネル、標準化されたローソク足分析、リアルタイムアラートを統合し、あらゆる資産や時間枠での取引を信頼性高くサポートします。 主な特徴 スマート取引ゾーン:   オーバーボートおよびオーバーソルド領域を自動識別。最大、平均、最小レベルを設定可能。 ダイナミックプライスチャネル:   浮動軸と平均ボラティリティを自動計算。重要なエグゾースト( exhaustion )および反転領域を強調表示。 標準化ローソク足分析:   平均からの偏差に基づきローソク足を比例的に再描画し、価格の極値を正確に表示。 自動売買シグナル:   視覚的及び音声アラートオプション付きの設定可能なシグナルを生成。押し目・戻り、ブレイクアウト、トレンド継続戦略に最適。 アラート設定:   クリティカルなレベルでのカスタム通知をサポート。サウンドアラー
Alpha Trend signは私たちの取引システムを検証し、取引信号を明確に提示し、信号がドリフトすることはありません。 主な機能: •市場が活況を示している地域に応じて、指標に基づいて現在の相場がトレンド相場に属しているか、それとも揺れ相場に属しているかを直感的に判断することができる。 そして、指標の指示矢印に基づいて市場に切り込み、緑の矢印は購入を提示し、赤の矢印は販売を提示する。 •小周期変動による頻繁な取引信号の発生を回避するために、5分以上の時間周期で取引を行うことを推奨します。 •最適な取引タイミングを逃さないために、シグナルプロンプトをオンにすることもできます。 •本指標はトレンド相場をよく予測するだけでなく、幅広振動相場でも利益を得ることができる。 •本指標は大道至簡の原則に基づいており、異なる段階のトレーダーが使用するのに適している。 注意事項: •Alpha Trend signには明確な入退場信号があり、損失を与えないように逆位相操作を提案しない。 •Alpha Trend signは特に成熟した指標であり、デルのチー
If you are using volume spread analysis, whether your are a beginner or an expert, this system will give you a lot of features and help in your analysis. Please watch the video to see all the features. Features With one click you will find all the VSA patterns on your chart . Bars without opening price. Easy to read volume indicator. Bar reader (Bar type - Close type - Volume type - Spread type). Daily and weekly levels (Pivot - Camarilla - Fibo). Very light on the trading platform and moving b
インジケーターは、Dynamic ZigZag(https://www.mql5.com/en/market/product/5356   )に基づいてチャートに高調波パターンを表示し、有名なkorHarmonicsのバージョンの1つとほぼ完全に類似しています。インジケーターは、次のパターンとその種類を認識します:ABCD、Gartley(Butterfly、Crab、Bat)、3Drives、5-0、Batman、SHS、One2One、Camel、Triangles、WXY、Fibo、Vibrations。デフォルトでは、ABCDおよびGartleyパターンの表示のみが設定で有効になっています。逆の線は、反対側の頂点を固定するモーメントを定義することを可能にします。カスタマイズ可能なパラメータが多数用意されています。 МetaТrader5バージョン:   https://www.mql5.com/en/market/product/5195 ダウンロード 可能なパラメータについて説明します。
The arrow indicator without redrawing shows potential entry points into the market in the form of arrows of the appropriate color: the up arrows (usually green) suggest opening a purchase, the red down arrows suggest selling. The appearance of arrows may be accompanied by beeps. It is usually assumed to enter at the next bar after the pointer, but there may be non-standard recommendations. Arrow indicators visually "unload" the price chart and save time for analysis: no signal – no deal, if ther
Reversal Prices is an indicator that has a fairly powerful and effective mechanism for adapting to changing market conditions. Reversal Prices - the new word in trend detection! With the development of information technology and a large number of participants, financial markets are less and less amenable to analysis by outdated indicators. Conventional technical analysis tools, such as the Moving Average or Stochastic, in their pure form are not able to determine the direction of the trend or it
The arrow indicator without redrawing shows potential entry points into the market in the form of arrows of the appropriate color: the up arrows (usually green) suggest opening a purchase, the red down arrows suggest selling. The appearance of arrows may be accompanied by beeps. It is usually assumed to enter at the next bar after the pointer, but there may be non-standard recommendations. Arrow indicators visually "unload" the price chart and save time for analysis: no signal – no deal, if ther
This indicator is based on the Weis wave principle of wave volume. Below are few features of the indicator It draws the wave on the chart while the accumulated volume per wave in a different window at the bottom of the chart You can configure the turning point move It displays the accumulated volume (in thousands, eg for 15000 volume it will show 15) at the end of each wave You can also configure to show number of candles in the wave along with the wave volume The indicator calculates the distin
VR Grid
Vladimir Pastushak
5 (3)
VR グリッド インジケーターは、ユーザー定義の設定を使用してグラフィカル グリッドを作成するように 設計 されています。 標準グリッド とは異なり、VR グリッドは 円形レベル を構築するために使用されます。ユーザーの選択に応じて、ラウンド レベル間のステップは任意に設定できます。さらに、他のインジケーターやユーティリティとは異なり、VR Grid は期間が変更されたり、端末が再起動されたりした場合でも、 グリッドの位置を維持 します。 設定、設定ファイル、デモ版、説明書、問題解決方法は、以下から入手できます。 [ブログ] レビューを読んだり書いたりすることができます。 [リンク] のバージョン [MetaTrader 5] 垂直レベル は実際の時間間隔に基づいており、 欠落している または存在しない期間は無視します。したがって、レベル間のステップは、ユーザーが選択した値に厳密に対応します。 VR グリッド インジケーターを使用すると、トレーダーは任意のレベルで 垂直線と水平線のスタイル 、色、太さを変更できます。これにより、金融商品の ラウンドレベル を制御できます。 ラウンド
FREE
Diver OBV
Oleksandr Medviediev
OBV   Divergence Formation  (hereinafter "Diver") is based on On Balance Volume  technical indicator (OBV) that is a momentum indicator that relates volume to price change. Classic (regular) and Reversal (hidden) Divergences - at your choice. Adjustable sizes and all parameters Flexible settings including VOID levels (additional alert function, arrows on price-chart show in which direction to trade) No re-paint / No re-draw (set  CalcOnOpenBar =false) "SetIndexBuffer"  available for all variable
1. Going offline means that the market is in a wait-and-see state. In this situation, it is common to choose to wait and see rather than taking immediate action to wait for more market information or trend confirmation in order to make wiser decisions. 2.When there is a trend of going up and down, the market shows a bullish signal. At this point, investors may consider entering the market in hopes of future price increases and profits. 3.When the market situation is online, it will once again t
v. 1.0 This indicator can show with maximum accuracy up to 1 bar the presence of a Maximum/minimum on the chart, regardless of the timeframe. It has a flexible configuration. You can use either one value on all TF, or you can use your own value on each TF individually. This indicator is already being improved and those who purchase it receive all updates for free. Next, it is planned to display an indication of the strength of the pivot point at each extremum (in % or in color drawing). It wi
This is an indicator for additional signal filtering. It can be used as an additional filter in a trading system. The indicator does not redraw its data and can be used both in forex trading and with binary options. It has 3 operation modes and flexible sensitivity settings. The indicator uses multiple buffers, therefore it can be easily used in various Expert Advisors.
Price Magnet — Price Density and Attraction Levels Indicator Price Magnet is a professional analytical tool designed to identify key support and resistance levels based on statistical Price Density. The indicator analyzes a specified historical period and detects price levels where the market spent the most time. These zones act as “magnets,” attracting price action or forming a structural base for potential reversals. Unlike traditional Volume Profile tools, Price Magnet focuses on price-time d
The indicator detects and displays the AB=CD harmonic pattern on the chart according to the scheme provided in the screenshot. The pattern is plotted by the extreme values of the ZigZag indicator (included in the resources, does not require additional installation). After detecting the pattern, the indicator notifies of that by the pop-up window, a mobile notification and an email. The indicator highlights not only the complete figure, but also the time of its formation. During the formation the
Market Structure - Break of Structure (MS-BOS) for MT4 Added simple dashboard in the right center of the chart - indicating direction of last cancelled BOS level for main set of Timeframes. This panel can be switched off in parameters All my indicators work only at closed bars, they do not repaint any values (if it is not otherwise mentioned in the description). So that they are fully compatible with autotrading, and are ready for making qualitative technical analysis.   Market Structure - Brea
Market Profile Shows where the price has spent more time, highlighting important levels that can be used in trading. It is a powerful tool which is designed to take the fundamental components which comprise every market; price/volume/time, and visually display their relationship in real-time as the market develops for a pre-determined time period. Very powerful tool!
RaysFX Supertrend Bar RaysFX Supertrend Bar è un indicatore personalizzato per MetaTrader 4. Utilizza l'indice di canale delle materie prime (CCI) per generare segnali di trading. L'indicatore mostra dei puntini in una finestra separata sotto il grafico principale per indicare i segnali di trading. Caratteristiche principali: Calcola il CCI per diversi periodi temporali. Visualizza puntini per indicare i segnali di trading. Permette all'utente di modificare i periodi temporali e la distanza tra
Was: $249  Now: $99   Market Profile defines a number of day types that can help the trader to determine market behaviour. A key feature is the Value Area, representing the range of price action where 70% of trading took place. Understanding the Value Area can give traders valuable insight into market direction and establish the higher odds trade. It is an excellent addition to any system you may be using. Blahtech Limited presents their Market Profile indicator for the MetaTrader community. Ins
このプロダクトを購入した人は以下も購入しています
Gann Made Easy は、ミスター・ギャンの理論を使用した取引の最良の原則に基づいた、プロフェッショナルで使いやすい外国為替取引システムです。 W・D・ガン。このインジケーターは、ストップロスとテイクプロフィットレベルを含む正確な買いと売りのシグナルを提供します。 PUSH通知を利用して外出先でも取引可能です。 ご購入後、取引方法の説明と優れた追加インジケーターを無料で入手するには、私にご連絡ください! おそらく、ギャンの取引手法についてはすでに何度も聞いたことがあるでしょう。通常、ギャンの理論は初心者のトレーダーだけでなく、すでにある程度の取引経験がある人にとっても非常に複雑なものです。なぜなら、ギャンの取引手法は理論的にはそれほど簡単に適用できるものではないからです。私はその知識を磨き、最良の原則を私の外国為替インジケーターに組み込むために数年を費やしました。 このインジケーターは非常に簡単に適用できます。必要なのは、それをチャートに添付し、簡単な取引推奨事項に従うだけです。このインジケーターは常に市場分析の仕事を行い、取引の機会を探します。適切なエントリーポイントを検出す
M1 SNIPER は使いやすいトレーディングインジケーターシステムです。M1時間足向けに設計された矢印インジケーターです。M1時間足でのスキャルピングのためのスタンドアロンシステムとして、また既存のトレーディングシステムの一部としても使用できます。このトレーディングシステムはM1時間足での取引に特化して設計されていますが、他の時間足でも使用できます。元々、この手法はXAUUSDとBTCUSDの取引用に設計しましたが、他の市場においても役立つと考えています。 インジケーターのシグナルは、トレンドの方向と逆方向に取引できます。インジケーターのシグナルを利用して両方向に取引するのに役立つ特別な取引テクニックをご紹介します。この手法は、特別な動的なサポートとレジスタンスの価格帯を利用することに基づいています。 ご購入後、M1 SNIPER矢印インジケーターをすぐにダウンロードできます。さらに、M1 SNIPERツールのすべてのユーザーに、以下のスクリーンショットに表示されているApollo Dynamic SRインジケーターを無料で提供しています。この2つのインジケーターを組み合わせることで
Scalper Inside PRO – Since 2020. An exclusive indicator that utilizes an innovative algorithm to swiftly and accurately determine the market trend. The indicator automatically calculates opening, closing, and profit levels, providing detailed trading statistics. With these features, you can choose the most appropriate trading instrument for the current market conditions. Additionally, you can easily integrate your own arrow indicators into Scalper Inside Pro to quickly evaluate their statistics
Ultimate Sniper Dashboard
Hispraise Chinedum Abraham
4.82 (22)
299ドルで割引中! 今後値上げの可能性あり! 下の説明を読んでください! 究極のスナイパーダッシュボードのための最高のエントリーシステム。究極のダイナミックレベル。(私の製品をチェックしてください) 究極のスナイパーダッシュボードはMT4多通貨テスト制限のため、ライブマーケットでのみ作動します。 究極のスナイパーダッシュボードをご紹介します。HA-Sniper、MA-Sniper、その他多くの特別なモードが含まれる最高の製品です。究極のスナイパーダッシュボードは絶対的な獣です! 初心者やエキスパートトレーダーにとって最高のソリューションです。もう二度と動きを見逃さない! シンプルさとピップを愛するトレーダーのために、特別な製品をご用意しました。シンプルでありながら、ダッシュボードは複数のカスタムアルゴリズムに基づき28の通貨ペアを監視し、すべての作業を行います。たった一つのチャートで、プロのように市場を読み解くことができます。もし、為替ペアが動き出したときに、その方向性を正確に特定することができれば、あなたの取引はどれほど改善されることでしょう。   当社のシステムは、高い確率
After purchase, contact me privately to receive 1 month of free testing with EA Forex Proton! This advanced MT4 trading robot automatically executes signals from any MT4 indicator, including Market Makers. The latest version also includes AI integration, allowing each trade signal to be analyzed using Artificial Intelligence. Live Signal with EA Forex Proton: Click here Market Makers is a powerful price action trading system designed to identify high-probability Buy and Sell opportunities based
Trend Screener
STE S.S.COMPANY
4.79 (95)
トレンドインジケーター、1つのツールに組み込まれたすべての重要なトレンド機能を備えたトレンドトレーディングとフィルタリングのための画期的なユニークなソリューション! これは、すべてのシンボル/商品(外国為替、商品、暗号通貨、インデックス、株式)で使用できる100%再描画されていないマルチタイムフレームおよびマルチ通貨インジケーターです。 期間限定オファー: サポートおよびレジスタンス スクリーナー インジケーターは、たった 50 ドルで永久的にご利用いただけます。(元の価格 250 ドル) (オファー延長) トレンドスクリーナーは、チャート内のドットで矢印トレンドシグナルを提供するインジケーターに続く効率的なインジケーターです。 トレンド分析インジケーターで使用できる機能: 1.トレンドスキャナー。 2.最大利益分析を備えたトレンドライン。 3.トレンド通貨強度メーター。 4.アラート付きのトレンド反転ドット。 5.アラート付きの強いトレンドドット。 6.トレンド矢印 毎日の分析例、毎日のシグナルパフォーマンス...など、トレンドスクリーナーインジケーターを使用して、ここで見つけること
まず第一に、この取引インジケーターは再描画されず、再描画されず、遅延しないことを強調する価値があります。これにより、手動取引とロボット取引の両方に理想的なものになります。 ユーザーマニュアル:設定、入力、戦略。 アトミックアナリストは、価格の強さとモメンタムを利用して市場でより良いエッジを見つけるためのPA価格アクションインジケーターです。ノイズや誤ったシグナルを除去し、取引ポテンシャルを高めるための高度なフィルターを備えています。複雑なインジケーターの複数のレイヤーを使用して、アトミックアナリストはチャートをスキャンし、複雑な数学的計算をシンプルなシグナルと色に変換します。これにより、どのような初心者トレーダーでも理解して使用し、一貫した取引の決定を行うことができます。 「アトミックアナリスト」は、新規および経験豊富なトレーダー向けにカスタマイズされた包括的な取引ソリューションです。プレミアムインジケーターとトップノッチの機能を1つの取引戦略に組み合わせ、すべてのタイプのトレーダーにとって汎用性のある選択肢にします。 デイリートレーディングとスキャルピング戦略:高速で正確な
Super Signal – Skyblade Edition プロ仕様のノンリペイント / ノーラグ・トレンドシグナルシステム。卓越した勝率を実現 | MT4 / MT5 対応 1分足、5分足、15分足などの低い時間足で最も効果を発揮します。 主な特徴: Super Signal – Skyblade Edition は、トレンド取引に特化したスマートなシグナルシステムです。マルチレイヤーのフィルターロジックを用いて、明確な方向性と実際のモメンタムに支えられた強力なトレンドのみを検出します。 このシステムは 天井や底を予測するものではありません 。次の3つの条件がすべて満たされた場合にのみシグナルを発生させます: 明確なトレンド方向 モメンタムの増加 健全なボラティリティ構造 市場セッションに基づく流動性分析と組み合わせることで、シグナルの精度とタイミングがさらに向上します。 シグナルの特性: すべての矢印シグナルは 100% 非リペイント / 遅延なし 一度出現したシグナルは固定され、点滅・消失しません チャート上の矢印、情報パネル、ポップアップ通知、音声アラート、プッシュ通知
ON Trade Waves Patterns Harmonic Elliot Wolfeをご紹介します。これは手動および自動の方法を使用して市場のさまざまなパターンを検出するために設計された高度なインジケーターです。以下はその動作方法です: ハーモニックパターン: このインジケーターは、チャートに表示されるハーモニックパターンを識別できます。これらのパターンは、Scott Carneyの「Harmonic Trading vol 1および2」で説明されているように、ハーモニックトレーディング理論を実践するトレーダーにとって重要です。手動で描画するか、自動検出に頼るかにかかわらず、ON Trade Waves Patternsがお手伝いします。 コントロールパネル: このインジケーターはユーザーフレンドリーなコントロールパネルを備えています。チャートと時間枠の設定を保存し、異なる構成間をスムーズに切り替えることができます。チャートスペースを最大限に活用するために最小化することもできます。他の分析ツールで作業することを好む場合、閉じるボタンをクリックするだけで、すべてのインジケーターデ
「 Dynamic Scalper System 」インジケーターは、トレンド波の中でスキャルピング取引を行う手法のために設計されています。 主要通貨ペアと金でテスト済みで、他の取引商品との互換性があります。 トレンドに沿った短期的なポジションオープンのシグナルを提供し、追加の価格変動サポートも提供します。 インジケーターの原理 大きな矢印はトレンドの方向を決定します。 トレンド波の中では、小さな矢印の形でスキャルピングシグナルを生成するアルゴリズムが機能します。 赤い矢印は強気方向、青い矢印は弱気方向です。 トレンドの方向には敏感な価格変動ラインが描かれ、小さな矢印のシグナルと連動します。 シグナルは次のように機能します。適切なタイミングでラインが現れるとエントリーシグナルが形成され、ラインが開いている間はポジションが保持され、完了すると取引が終了します。 推奨される動作時間枠はM1~H4です。 矢印は現在のローソク足に形成され、次のローソク足が開いている場合は、前のローソク足の矢印は再描画されません。 入力パラメータ Trend Wave Period - トレンド方向
PRO Renko Systemは、特別にRENKOチャートを取引するために設計された高精度の取引システムです。 これは、様々な取引商品に適用することができる普遍的なシステムです。 システムは効果的に正確な逆転信号へのアクセスを与えるいわゆる市場の騒音を中和する。 表示器は非常に使いやすく、信号の生成に責任がある1つの変数だけがあります。 あなたは簡単にお好みの任意の取引ツールとレンコバーのサイズにツールを適応させることができます。 私はいつもあなたが私のソフトウェアで収益性の高い取引を支援するために余分なサポートを提供する準備ができています! 私はあなたに幸せで収益性の高い取引をしたいです! ご購入後にご連絡ください! 私はあなたに私のレンコチャートジェネレータを送信します。 私はまた、私の個人的な推奨事項やシステムの他のモジュールを無料で共有します!
説明書(ロシア語)  /  説明書 (英語)  /  バージョン MT5 主な機能: 売り手と買い手のアクティブなゾーンを表示します。 このインジケーターは、買いと売りの適切な最初のインパルスレベル/ゾーンをすべて表示します。これらのレベル/ゾーンがアクティブになると、エントリーポイントの探索が始まり、レベルの色が変わり、特定の色で塗りつぶされます。状況をより直感的に把握できるように、矢印も表示されます。 LOGIC AI - テンプレートをアクティブ化するときにエントリポイントを検索するためのゾーン(円)の表示 視認性を向上させるため、人工知能を用いて進入ポイントを探索したゾーンを表示する機能が追加されました。 より高い時間枠からのレベル/ゾーンの表示(MTFモード) より長い時間間隔でレベル/ゾーンを表示する機能を追加しました。また、インジケーターに自動トレンド検出機能(   TPSproTREND PRO   )を実装しました。 取引のための個別の専門的なステップバイステップのアルゴリズム このアルゴリズムは、トレンドの方向と逆方向の両方でデイトレードを行うために設計されていま
BTMM State Engine Pro is a MetaTrader 4 indicator for traders who use the Beat The Market Maker approach: Asian session context, kill zone timing, level progression, peak formation detection, and a multi-pair scanner from a single chart. It combines cycle state logic with a built-in scanner dashboard so you do not need the same tool on many charts at once. What it does Draws the Asian session range; session times can follow broker server offset or be set in inputs. Tracks level progression (L
Linear Trend Predictor ー - エントリ ポイントと方向サポート ラインを組み合わせたトレンド インジケーター。高値/安値チャネルを突破するという原理に基づいて機能します。 インジケーターのアルゴリズムは市場のノイズをフィルタリングし、ボラティリティと市場の動向を考慮します。 インジケーターの機能  平滑化手法を使用して、市場のトレンドと、買い注文または売り注文を開くためのエントリー ポイントを表示します。  任意の時間枠のチャートを分析して、短期および長期の市場の動きを判断するのに適しています。  あらゆる市場や時間枠に適応可能な入力パラメータにより、トレーダーはインジケーターを独自にカスタマイズできます。  設定されたインジケーター信号は消えず、再描画もされません。ローソク足の終値で決定されます。  いくつかの種類の通知が矢印と組み合わされています。  このインジケーターは、独立した取引システムとして使用することも、他の取引システムへの追加として使用することもできます。  あらゆるレベルの経験を持つトレーダーが使用できます。 主なパラメータ Vol
現在40%オフ 初心者やエキスパートトレーダーに最適なソリューション! このインジケーターは、独自の機能と新しい計算式を取り入れた、ユニークで高品質、かつ手頃な価格のトレーディングツールです。たった1枚のチャートで28の為替ペアの通貨強度を読み取ることができます。新しいトレンドやスキャルピングチャンスの引き金となるポイントを正確に特定することができるので、あなたのトレードがどのように改善されるか想像してみてください。 ユーザーマニュアルはこちら  https://www.mql5.com/en/blogs/post/697384 これが最初の1本、オリジナルだ! 価値のないクローンを買わないでください。 特別な サブウィンドウの矢印で強い通貨の勢いを表示 GAPがあなたのトレードを導く! 基準通貨や気配値が売られすぎ・買われすぎのゾーン(外相フィボナッチレベル)にあるとき、個別チャートのメインウィンドウに警告表示。 通貨がレンジの外側から反落した場合、プルバック/リバーサルのアラート。 クロスパターンの特別なアラート 複数の時間枠を選択可能で、トレンドを素早く確認できます
Easy Breakout
Mohamed Hassan
4.71 (14)
After your purchase, feel free to contact me for more details on how to receive a bonus indicator called VFI, which pairs perfectly with Easy Breakout for enhanced confluence!    Easy Breakout is a powerful price action trading system built on one of the most popular and widely trusted strategies among traders: the Breakout strategy ! This indicator delivers crystal-clear Buy and Sell signals based on breakouts from key support and resistance zones. Unlike typical breakout indicators, it levera
Volatility Trend System - a trading system that gives signals for entries. The volatility system gives linear and point signals in the direction of the trend, as well as signals to exit it, without redrawing and delays. The trend indicator monitors the direction of the medium-term trend, shows the direction and its change. The signal indicator is based on changes in volatility and shows market entries. The indicator is equipped with several types of alerts. Can be applied to various trading ins
トレンドラインプロ   市場の真の方向転換点を理解するのに役立ちます。この指標は、真のトレンド反転と主要プレーヤーが再び参入するポイントを示します。 分かりますか     BOSライン   複雑な設定や不要なノイズなしに、より長い時間足でのトレンドの変化と重要なレベルを把握できます。シグナルは再描画されず、バーが閉じた後もチャート上に残ります。 VERSION MT 5     -     RFI LEVELS PRO インジケーター と組み合わせることで、その潜在能力を最大限に発揮します。 インジケーターが示す内容: 本当の変化   トレンド(BOSライン) 一度シグナルが現れたら、それは有効です!これは、リペイント機能を持つインジケーターとの重要な違いです。リペイント機能を持つインジケーターは、シグナルを発した後、それを変更し、資金の損失につながる可能性があります。これにより、より高い確率と精度で市場に参入できます。また、矢印が現れた後、目標値(利益確定)に達するか、反転シグナルが現れるまで、ローソク足の色を変更する機能もあります。 繰り返しエントリ       主要プレーヤーの
GOLD Impulse with Alert
Bernhard Schweigert
4.67 (12)
このインディケータは、当社の2つの製品 Advanced Currency IMPULSE with ALERT  +   Currency Strength Exotics . のスーパーコンビネーションです。 このインジケーターは全ての時間枠で作動し、8つの主要通貨と1つのシンボルの強弱のインパルスをグラフで表示します。 このインジケータは、金、エキゾチックペア、商品、インデックス、先物など、あらゆるシンボルの通貨強度の加速度を表示することに特化されています。金、銀、原油、DAX、US30、MXN、TRY、CNHなどの通貨強度の加速度(インパルスまたは速度)を表示するために、任意のシンボルを9行目に追加できる、この種の最初のものです。 新しいアルゴリズムに基づいて構築され、潜在的な取引の特定と確認がさらに容易になりました。これは、通貨の強さや弱さが加速しているかどうかをグラフィカルに表示し、その加速の速度を測定するためです。加速すると物事は明らかに速く進みますが、これはFX市場でも同じです。つまり、反対方向に加速している通貨をペアリングすれば、潜在的に利益を生む取引を特定
Order Block Hunter
Noha Mohamed Fathy Younes Badr
5 (10)
Order block hunter indicator is the best indicator for  hunt the order blocks that area where there has been a large concentration of limit orders waiting to be executed Order blocks are identified on a chart by observing previous price action and looking for areas where the price experienced significant movement or sudden changes in direction .This indicator does that for you by using very complicated codes and helps you to take the best areas To buy and sell because it make marks at the best a
- Real price is 80$ - 40% Discount (It is 49$ now) Contact me for instruction, add group and any questions! - Non-repaint - I just sell my products in Elif Kaya profile, any other websites are stolen old versions, So no any new updates or support. - Lifetime update free Related product:   Bitcoin Expert Introduction The breakout and retest strategy is traded support and resistance levels. it involves price breaking through a previous level.  The break and retest strategy is designed to help tr
KT Gaussian Trend Filter は、ガウスフィルターと線形回帰スムージングを組み合わせることで、明確かつ正確なトレンド分析を実現します。わかりやすい買いと売りのシグナルを生成しながら、市場の長期的な方向性を効果的に示します。 機能 カスタマイズ可能なガウスフィルター: 期間やポール設定を調整してスムージング精度を高め、トレンドの明瞭さを向上。 線形回帰による強化: ガウススムージングをさらに最適化し、市場のノイズによる誤信号を最小限に抑えます。 マルチタイムフレームスキャナー: 複数の時間軸におけるガウストレンドの方向を自動検出し、わかりやすいダッシュボードに表示します。 トレーリングバンド機能: トレンド中の深い押し目でのエントリーポイントを簡単に把握可能。 カラーカスタマイズ対応: チャートの配色や取引スタイルに合わせて色を自由に設定できます。 内蔵アラート機能: ポップアップ、メール、プッシュ通知、サウンドアラートで即時通知を受け取れます。 使い方 このインジケーターは明確なシグナルを提供し、トレーダーがエントリーやエグジットのタイミングを判断しやすくします
Special offer : ALL TOOLS , just $35 each! New tools   will be   $30   for the   first week   or the   first 3 purchases !  Trading Tools Channel on MQL5 : Join my MQL5 channel to update the latest news from me ボリュメトリックオーダーブロック多時間枠 インジケーターは、主要な市場参加者が注文を蓄積する重要な価格エリアを特定することで、より深い市場の洞察を求めるトレーダー向けに設計された強力なツールです。これらのエリアはボリュメトリックオーダーブロックとして知られており、サポートやレジスタンスの潜在的ゾーンとして機能し、取引の意思決定において重要な優位性を提供します。 MT5バージョンを見る:   Volumetric Order Blocks MT5 Multi Timeframe See more products at:   https://www.mql5.com/en
Advanced Supply Demand
Bernhard Schweigert
4.91 (299)
現在40%オフ 初心者にもエキスパートトレーダーにも最適なソリューション このインジケーターは独自の機能と新しい公式を多数内蔵しており、ユニークで高品質かつ手頃な取引ツールです。このアップデートでは、2つの時間枠ゾーンを表示できるようになります。より長いTFだけでなく、チャートTFとより長いTF(ネストゾーンを表示)の両方を表示できます。すべてのSupply Demandトレーダーの皆さんのお気に召すはずです。:) 重要情報の公開 Advanced Supply Demandの可能性を最大化するには、 https://www.mql5.com/ja/blogs/post/720245 にアクセスしてください。   エントリーまたはターゲットの正確なトリガーポイントを正確に特定できれば取引がどのように改善されるか想像してみてください。新しい基盤となるアルゴリズムに基づいて構築されているため、買い手と売り手の間の潜在的な不均衡をさらに簡単に特定できます。これは、最も強い需要と供給のゾーンと、過去のパフォーマンス(古いゾーンを表示)がグラフィカルに表現されるためです。これらの機能は、最適な
Route Lines Prices -は、価格の方向性を予測するために設計されたインジケーターです。シンプルなインターフェースには、価格変動と将来の方向性を計算するための複数のアルゴリズムが搭載されています。これらのアルゴリズムには、使用する時間枠に基づいたボラティリティ計算と価格平滑化が含まれています。 このインジケーターには、「 Calculating price values 」値を変更するためのパラメーターが1つだけあります。デフォルト値の1は、バランスの取れた自動計算を提供し、インジケーターを手動で設定することなく使用できます。 値を2から500まで手動で変更することで、インジケーターを独自のトレーディングシステムに合わせてカスタマイズできます。 このインジケーターは、M1からH4の時間枠での使用を推奨します。あらゆる取引銘柄で使用できます。 シグナル矢印はローソク足の終値で生成され、過去の履歴には再描画されません。 メインチャートには、重複した矢印が表示されます。 複数のアラートタイプが利用可能です。内蔵のライン軌跡カウンターは、終値に基づいて動作します。これ
Stratos Pali
Michela Russo
4.43 (7)
Stratos Pali Indicator   is a revolutionary tool designed to enhance your trading strategy by accurately identifying market trends. This sophisticated indicator uses a unique algorithm to generate a complete histogram, which records when the trend is Long or Short. When a trend reversal occurs, an arrow appears, indicating the new direction of the trend. Important Information Revealed Leave a review and contact me via mql5 message to receive My Top 5 set files for Stratos Pali at no cost! Dow
現在40%OFF! 初心者やエキスパートトレーダーのためのベストソリューション! このダッシュボードソフトウェアは、28の通貨ペアで動作しています。それは私達の主要な指標(高度な通貨の強さ28と高度な通貨インパルス)の2に基づいています。それは全体の外国為替市場の大きい概観を与えます。それは、すべての(9)時間枠で28の外国為替ペアのための高度な通貨の強さの値、通貨の動きの速度と信号を示しています。チャート上で1つのインディケータを使用して市場全体を観察し、トレンドやスキャルピングの機会をピンポイントで見つけることができたら、あなたのトレードがどのように改善されるか想像してみてください。 このインディケータには、強い通貨と弱い通貨の識別、潜在的な取引の識別と確認がより簡単になるような機能が搭載されています。このインディケータは、通貨の強さや弱さが増加しているか減少しているか、また、すべての時間枠でどのように機能しているかをグラフィカルに表示します。 新機能として、現在の市場環境の変化に適応するダイナミックなマーケットフィボナッチレベルが追加され、すでに当社のAdvanced
これは、キャンドルの終値を予測する指標です。 このインジケータは、主にD1チャートでの使用を目的としていますが. この指標は、従来の外国為替取引とバイナリオプション取引の両方に適しています。 インジケーターは、スタンドアロンのトレーディングシステムとして使用することも、既存のトレーディングシステムへの追加として機能させることもできます。 このインジケーターは、現在のキャンドルを分析し、キャンドル自体の内部の特定の強度係数と、前のキャンドルのパラメーターを計算します。 したがって、この指標は、市場の動きのさらなる方向性と現在のキャンドルの終値を予測します。 この方法のおかげで、この指標は、短期の日中取引だけでなく、中期および長期の取引にも適しています。 インジケーターを使用すると、市場の状況の分析中にインジケーターが生成する潜在的な信号の数を設定できます。 インジケーターの設定には、このための特別なパラメーターがあります。 また、インジケーターは、チャート上のメッセージの形式で、電子メールで、およびPUSH通知の形式で、新しい信号について通知することができます。 購入後は必ず私に書いて
Scalper Vault は、スキャルピングを成功させるために必要なすべてを提供するプロフェッショナルなスキャルピング システムです。このインジケーターは、外国為替およびバイナリー オプションのトレーダーが使用できる完全な取引システムです。推奨される時間枠は M5 です。 システムは、トレンドの方向に正確な矢印シグナルを提供します。また、トップとボトムのシグナルとギャン マーケット レベルも提供します。 インジケーターは、プッシュ通知を含むすべてのタイプのアラートを提供します。 インジケータの購入後にご連絡ください。私の個人的な取引の推奨事項と素晴らしいボーナス指標を無料で共有します! 幸せで有益な取引をお祈りします!
Miraculous Indicator – ガン・スクエア・オブ・ナインに基づく100%非リペイントのFXおよびバイナリーツール この動画では、FXおよびバイナリーオプションのトレーダー向けに特別に開発された、非常に正確で強力な取引ツールである Miraculous Indicator を紹介しています。このインジケーターがユニークなのは、伝説的な ガン・スクエア・オブ・ナイン と ガンの振動の法則 に基づいている点で、現代の取引で利用できる最も正確な予測ツールの一つとなっています。 Miraculous Indicatorは 完全に非リペイント であり、ローソク足が確定した後にシグナルが変化したり消えたりすることはありません。つまり、見たものがそのまま利用できます。これにより、トレーダーは自信を持ってエントリーおよびエグジットを行うための信頼性と一貫性のある根拠を得ることができます。 主な特徴: ガン・スクエア・オブ・ナインとガン理論に基づいて構築 100%非リペイントのシグナルシステム すべての時間枠(M1、M5、H1、H4、日足、週足)で機能 FXおよびバイナリーオプション取引
作者のその他のプロダクト
WalkForwardOptimizer MT5
Stanislav Korotky
3.78 (9)
WalkForwardOptimizer library allows you to perform rolling and cluster walk-forward optimization of expert advisers (EA) in MetaTrader 5. To use the library include its header file WalkForwardOptimizer.mqh into your EA source code, add call provided functions as appropriate. Once the library is embedded into EA, you may start optimization according to the procedure described in the User guide . When it's finished, intermediate results are saved into a CSV file and some special global variables.
This non-trading expert utilizes so called custom symbols feature ( available in MQL API as well) to build renko charts based on history of real ticks of selected standard symbol. RenkoFromRealTicks generates custom symbol quotes, thus you may open many charts to apply different EAs and indicators to the renko. It also transmits real ticks to update renko charts in real time. The generated renko chart uses M1 timeframe. It makes no sense to switch the renko chart to a timeframe other than M1. T
AutomaticZigZag
Stanislav Korotky
4.5 (2)
This is a non-parametric ZigZag providing 4 different methods of calculation. Upward edge continues on new bars while their `highs` are above highest `low` among previous bars, downward edge continues on next bars while their `lows` are below lowest `high` among previous; Gann swing: upward edge continues while `highs` and `lows` are higher than on the left adjacent bar, downward edge continues while `highs` and `lows` are lower than on the left adjacent bar. Inside bars (with lower `high` and
FREE
This indicator displays volume delta (of either tick volume or real volume) encoded in a custom symbol, generated by special expert advisers, such as RenkoFromRealTicks . MetaTrader does not allow negative values in the volumes, this is why we need to encode deltas in a special way, and then use CustomVolumeDelta indicator to decode and display the deltas. This indicator is applicable only for custom instruments generated in appropriate way (with signed volumes encoded). It makes no sense to ap
FREE
This indicator provides the analysis of tick volume deltas. It monitors up and down ticks and sums them up as separate volumes for buys and sells, as well as their delta volumes. In addition, it displays volumes by price clusters (cells) within a specified period of bars. This indicator is similar to VolumeDeltaMT5 , which uses almost the same algorithms but does not process ticks and therefore cannot work on M1. This is the reason for VolumeDeltaM1 to exist. On the other hand, VolumeDeltaMT5 ca
This is a demo version of a non-trading expert , which utilizes so called the custom symbols feature ( available in MQL as well ) to build renko charts based on historical quotes of selected standard symbol and to refresh renko in real-time according to new ticks. Also it translates real ticks to the renko charts, which allows other EAs and indicators to trade and analyze renko. Place the EA on a chart of a working instrument. The lesser timeframe of the source chart is, the more precise resulti
FREE
WalkForwardDemo is an expert adviser (EA) demonstrating how the built-in library WalkForwardOptimizer (WFO) for walk-forward optimization works. It allows you to easily optimize, view and analyze your EA performance and robustness in unknown trading conditions of future. You may find more details about walk-forward optimization in Wikipedia . Once you have performed optimization using WFO, the library generates special global variables (saved in an "archived" file with GVF-extension) and a CSV-f
FREE
HZZM
Stanislav Korotky
4 (1)
This is an adaptive ZigZag based on modification of  HZZ indicator (original source code is available in this article ). Most important changes in this version: two additional indicator buffers added for zigzag evolution monitoring - they show cross signs at points where zigzag direction first changes; zigzag range (H) autodetection on day by day basis; time-dependent adjustment of zigzag range. Parameters: H - zigzag range in points; this parameter is similar to original HZZ, but it can take 0
FREE
This script allows performing a walk-forward analysis of trading experts based on the data collected by the WalkForwardLight MT5 library. The script builds a cluster walk forward report and rolling walk forward reports that refine it, in the form of a single HTML page. This script is optional, as the library automatically generates the report immediate after the optimization in the tester is complete. However, the script is convenient because it allows using the same collected data to rebuild th
FREE
Order Book, known also as Market Book, market depth, Level 2, - is a dynamically updated table with current volumes of orders to buy and to sell specific financial instument at price levels near Bid and Ask. MetaTrader 5 provides the means for receiving market book from your broker, but in real time only, without access to its history. This expert adviser OrderBook History Playback allows you to playback the market book events on the history using files, created by OrderBook Recorder . The exper
FREE
Order Book, known also as Market Book, market depth, Level 2, - is a dynamically updated table with current volumes of orders to buy and to sell specific financial instument at price levels near Bid and Ask. MetaTrader 5 provides the means for receiving market book from your broker in real time. The expert OrderBook Recorder records market book changes and stores them in local files for further usage in indicators and expert adviser, including testing in the tester. The expert stores market book
FREE
This indicator provides a statistical analysis of price changes (in points) versus time delta (in bars). It calculates a matrix of full statistics about price changes during different time periods, and displays either distribution of returns in points for requested bar delta, or distribution of time deltas in bars for requested return. Please, note, that the indicator values are always a number of times corresponding price change vs bar delta occurred in history. Parameters: HistoryDepth - numbe
FREE
OrderBook Utilities is a script, which performs several service operations on order book hob-files, created by OrderBook Recorder . The script processes a file for work symbol of the current chart. The file date is selected by means of the input parameter CustomDate (if it's filled in) or by the point where the script is dropped on the chart. Depending from the operation, useful information is written into the log, and optionally new file is created. The operation is selected by the input parame
FREE
The indicator calculates running total of linear weighted returns. It transforms rates into integrated and difference-stationary time series with distinctive buy and sell zones. Buy zones are shown in blue, sell zones in red. Parameters: period - number of bars to use for linear weighted calculation; default value - 96; smoothing - period for EMA; default value - 5; mode - an integer value for choosing calculation mode: 0 - long term trading; 1 - medium term trading; 2 - short term trading; defa
FREE
Comparator
Stanislav Korotky
4.75 (4)
This indicator compares the price changes during the specified period for the current symbol and other reference symbol. It allows to analyze the similar movements of highly correlated symbols, such as XAUUSD and XAGUSD, and find their occasional convergences and divergences for trading opportunities. The indicator displays the following buffers: light-green thick line - price changes of the current symbol for TimeGap bars; light-blue thin line - price changes of the reference symbol ( LeadSymbo
FREE
This indicator shows price changes for the same days in past years. D1 timeframe is required. This is a predictor indicator that finds D1 bars for the same days in past 8 years and shows their relative price changes on the current chart. Parameters: LookForward - number of days (bars) to show "future" price changes; default is 5; Offset - number of days (bars) to shift back in history; default is 0; ShowAverage - mode switch; true - show mean value for all 8 years and deviation bounds; false - s
FREE
SOMFX1Builder
Stanislav Korotky
5 (1)
If you like trading by candle patterns and want to reinforce this approach by modern technologies, this script is for you. In fact, it is a part of a toolbox, that includes a neural network engine implementing Self-Organizing Map (SOM) for candle patterns recognition, prediction, and provides you with an option to explore input and resulting data. The toolbox contains: SOMFX1Builder  - this script for training neural networks; it builds a file with generalized data about most characteristic pric
FREE
This indicator predicts rate changes based on the chart display principle. It uses the idea that the price fluctuations consist of "action" and "reaction" phases, and the "reaction" is comparable and similar to the "action", so mirroring can be used to predict it. The indicator has three parameters: predict - the number of bars for prediction (24 by default); depth - the number of past bars that will be used as mirror points; for all depth mirroring points an MA is calculated and drawn on the ch
If you like trading crosses (such as AUDJPY, CADJPY, EURCHF, and similar), you should take into account what happens with major currencies (especially, USD and EUR) against the work pair: for example, while trading AUDJPY, important levels from AUDUSD and USDJPY may have an implicit effect. This indicator allows you to view hidden levels, calculated from the major rates. It finds nearest extremums in major quotes for specified history depth, which most likely form resistence or support levels, a
The indicator displays most prominent price levels and their changes in history. It dynamically detects regions where price movements form attractors and shows up to 8 of them. The attractors can serve as resistance or support levels and outer bounds for rates. Parameters: WindowSize - number of bars in the sliding window which is used for detection of attractors; default is 100; MaxBar - number of bars to process (for performance optimization); default is 1000; when the indicator is called from
This is an intraday indicator that uses conventional formulae for daily and weekly levels of pivot, resistance and support, but updates them dynamically bar by bar. It answers the question how pivot levels would behave if every bar were considered as the last bar of a day. At every point in time, it takes N latest bars into consideration, where N is either the number of bars in a day (round the clock, i.e. in 24h) or the number of bars in a week - for daily and weekly levels correspondingly. So,
Most of traders use resistance and support levels for trading, and many people draw these levels as lines that go through extremums on a chart. When someone does this manually, he normally does this his own way, and every trader finds different lines as important. How can one be sure that his vision is correct? This indicator helps to solve this problem. It builds a complete set of virtual lines of resistance and support around current price and calculates density function for spatial distributi
The indicator draws a histogram of important levels for several major currencies attached to the current cross rates. It is intended for using on charts of crosses. It displays a histogram calculated from levels of nearest extremums of related major currencies. For example, hidden levels for AUDJPY can be detected by analyzing extremums of AUD and JPY rates against USD, EUR, GBP, and CHF. All instruments built from these currencies must be available on the client. This is an extended version of
The indicator provides a statistic histogram of estimated price movements for intraday bars. It builds a histogram of average price movements for every intraday bar in history, separately for each day of week. Bars with movements above standard deviation or with higher percentage of buys than sells, or vice versa, can be used as direct trading signals. The indicator looks up current symbol history and sums up returns on every single intraday bar on a specific day of week. For example, if current
This is an easy to use signal indicator which shows and alerts probability measures for buys and sells in near future. It is based on statistical data gathered on existing history and takes into account all observed price changes versus corresponding bar intervals in the past. The statistical calculations use the same matrix as another related indicator - PointsVsBars. Once the indicator is placed on a chart, it shows 2 labels with current estimation of signal probability and alerts when signal
CCFpExtra is an extended version of the classic cluster indicator - CCFp. This is the MT4 version of indicator  CCFpExt available for MT5. Despite the fact that MT5 version was published first, it is MT4 version which was initially developed and tested, long before MT4 market was launched. Main Features Arbitrary groups of tickers or currencies are supported: can be Forex, CFDs, futures, spot, indices; Time alignment of bars for different symbols with proper handling of possibly missing bars, in
This is a signal indicator for automatic trading which shows probability measures for buys and sells for each bar. It is based on statistical data gathered on existing history and takes into account all observed price changes versus corresponding bar intervals in the past. The core of the indicator is the same as in PriceProbablility indicator intended for manual trading. Unlike PriceProbability this indicator should be called from MQL4 Expert Advisors or used for history visual analysis. The in
The main idea of this indicator is rates analysis and prediction by Fourier transform. Indicator decomposes exchange rates into main harmonics and calculates their product in future. You may use the indicator as a standalone product, but for better prediction accuracy there is another related indicator - FreqoMaster - which uses FreqoMeterForecast as a backend engine and combines several instances of FreqoMeterForecast for different frequency bands. Parameters: iPeriod - number of bars in the ma
The main idea of this indicator is rates analysis and prediction by Fourier transform. The indicator decomposes exchange rates into main harmonics and calculates their product in future. The indicator shows 2 price marks in history, depicting price range in the past, and 2 price marks in future with price movement forecast. Buy or sell decision and take profit size are displayed in a text label in the indicator window. The indicator uses another indicator as an engine for calculations - FreqoMet
This is a very powerful indicator that provides a mix of three running totals of linear weighted returns. Each one is similar to a specific mode of ReturnAutoScale indicator. The result is a scaled superposition of three integrated and difference-stationary time series, each for different trading strategy. Indicator displays three lines: yellow - slow market returns, corresponds to mode 0 in ReturnAutoScale; blue - medium market returns, corresponds to mode 1 in ReturnAutoScale; red - fast marke
フィルタ:
レビューなし
レビューに返信