Visual Tics VIA
- インディケータ
- バージョン: 152.0
- アップデート済み: 31 7月 2020
- アクティベーション: 5

A real rarity for scalpers.
Are you looking for TFs lower than M1 ?
Do you want to see the price dynamics inside the candle?
This is a tool for you.
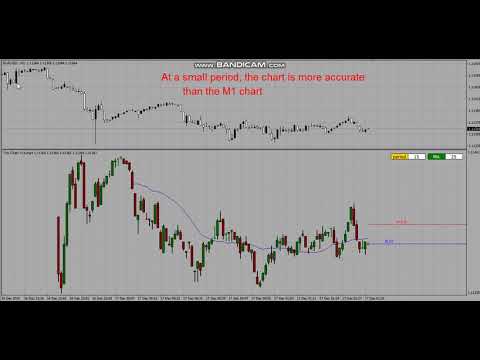
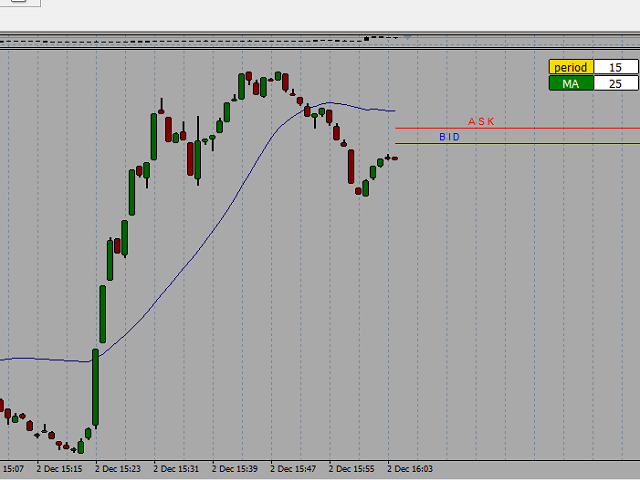
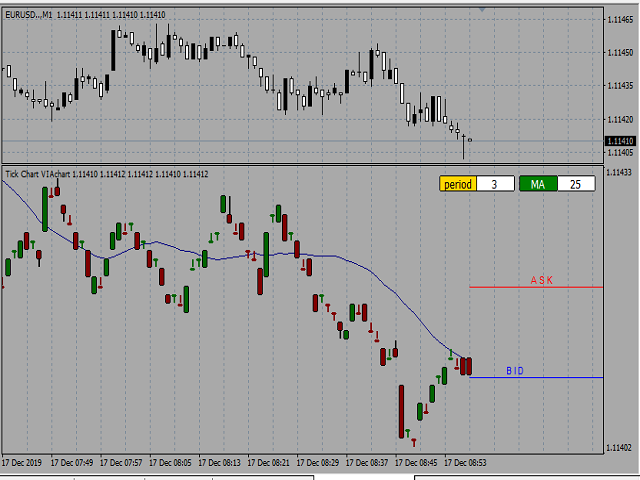
Visual Ticks is an indicator that shows the tick chart in a separate window.
He does it in real time waiting for changing ticks.
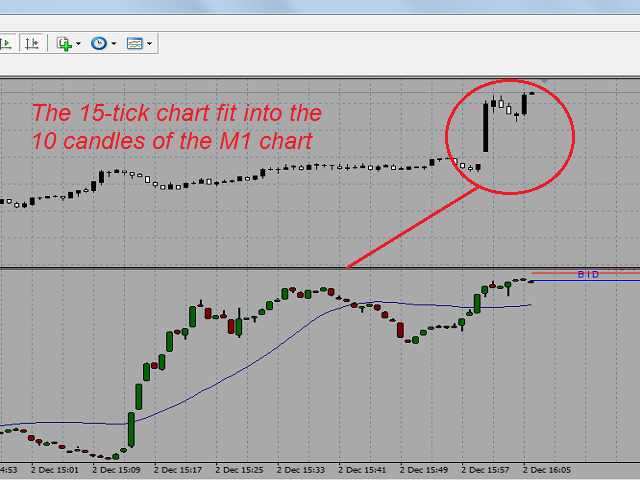
Thanks to Visual Ticks, we can look inside the traditional candle and see the dynamics of the moving price.
By setting "period_of_model" we can shape a chart made of candles.
"period_of_model" defines how many consecutive ticks make one candle.
If we enter period_of_model = 1, the candles will not have a body. The chart will be made of single ticks.
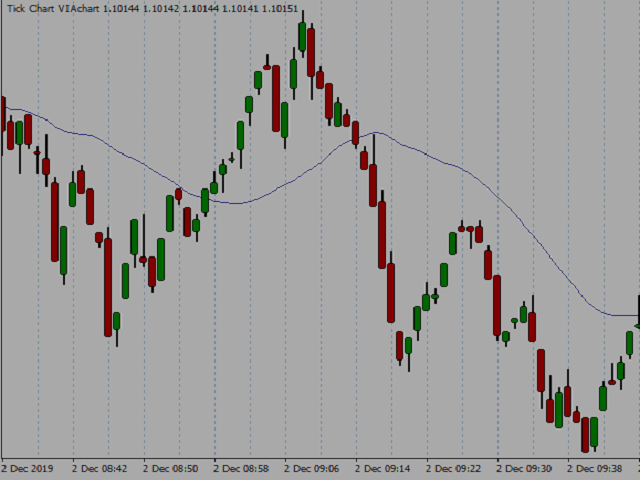
We can add Moving Average calculated from ticks to the chart.
MA service is performed on the chart. You can turn MA off or on again at any time.
You can also change the MA period by clicking on the window and entering the number.
Note: Visual Ticks reads ticks in real time and remembers them.
During work should not turn off Visual Ticks and MT4. After disabling, Visual Ticks resets.
There is a dedicated EA for the Visual Tics indicator.
Thanks to it you can take full advantage of the ticks chart.
You can open transactions directly on the Visual Ticks chart.
This is shown in the movie.
EA is available in the "Free" section ( https://www.mql5.com/en/market/product/44615 ).
Settings :
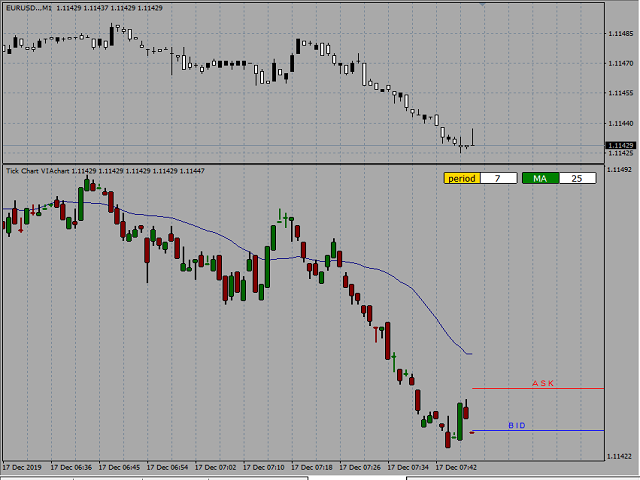
period_of_model - period of Tick chart. Indicates the number of ticks in each candle. This can also be changed in the window on the chart.
colorUP - growth candle color
colorDOWN - downward candle color
colorBORDER - candle border color
show_Bid - show Bid line on the chart
color_Bid - Bid line color
show_Ask - show Ask line on the chart
color_Ask - Ask line color
use_MA - show the Moving Average line on the chart. This can also be changed by pressing the button on the chart.
periodMA - period of Moving Average. This can also be changed in the window on the chart.
Are you looking for TFs lower than M1 ?
Do you want to see the price dynamics inside the candle?
This is a tool for you.
Visual Ticks is an indicator that shows the tick chart in a separate window.
He does it in real time waiting for changing ticks.
Thanks to Visual Ticks, we can look inside the traditional candle and see the dynamics of the moving price.
By setting "period_of_model" we can shape a chart made of candles.
"period_of_model" defines how many consecutive ticks make one candle.
If we enter period_of_model = 1, the candles will not have a body. The chart will be made of single ticks.
We can add Moving Average calculated from ticks to the chart.
MA service is performed on the chart. You can turn MA off or on again at any time.
You can also change the MA period by clicking on the window and entering the number.
Note: Visual Ticks reads ticks in real time and remembers them.
During work should not turn off Visual Ticks and MT4. After disabling, Visual Ticks resets.
There is a dedicated EA for the Visual Tics indicator.
Thanks to it you can take full advantage of the ticks chart.
You can open transactions directly on the Visual Ticks chart.
This is shown in the movie.
EA is available in the "Free" section ( https://www.mql5.com/en/market/product/44615 ).
Settings :
period_of_model - period of Tick chart. Indicates the number of ticks in each candle. This can also be changed in the window on the chart.
colorUP - growth candle color
colorDOWN - downward candle color
colorBORDER - candle border color
show_Bid - show Bid line on the chart
color_Bid - Bid line color
show_Ask - show Ask line on the chart
color_Ask - Ask line color
use_MA - show the Moving Average line on the chart. This can also be changed by pressing the button on the chart.
periodMA - period of Moving Average. This can also be changed in the window on the chart.

ユーザーは評価に対して何もコメントを残しませんでした