Resistance and Support Zones MTF for MT5
- インディケータ
- バージョン: 12.0
- アップデート済み: 5 10月 2020
- アクティベーション: 5

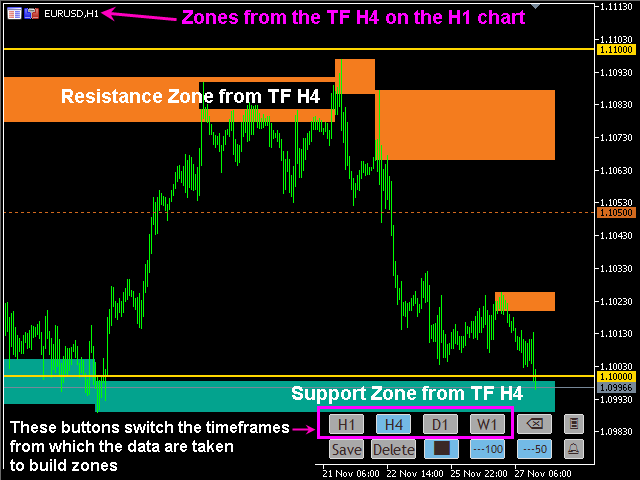
The indicator automatically builds Support/Resistance levels (Zones) from different timeframes on one chart.
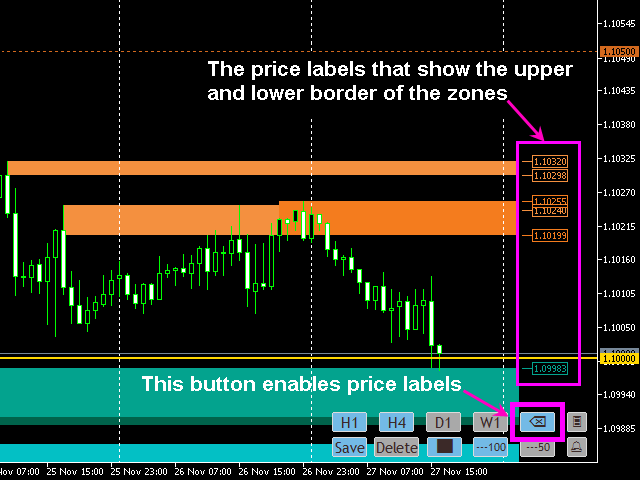
Support-resistance levels are horizontal lines. As a rule, the market does not respond to a specific price level, but to a price range around the level, because demand and supply of market participants are not formed clearly on the line, but are “spread out” at a certain distance from the level.
This indicator determines and draws precisely such a price range within which strong positions for sale and purchase are formed. We will call it the Support-Resistance Zone.
Indicator Features:
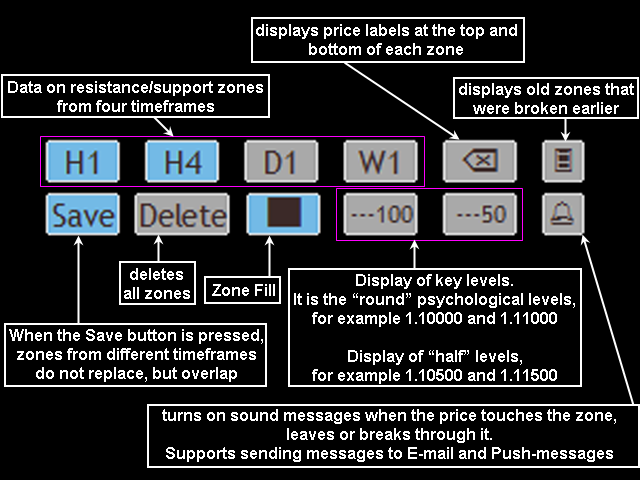
- Data on resistance/support zones are collected from four timeframes (H1, H4, D1 and W1) and analyzed on a single chart of any timeframe (from M1 to MN).
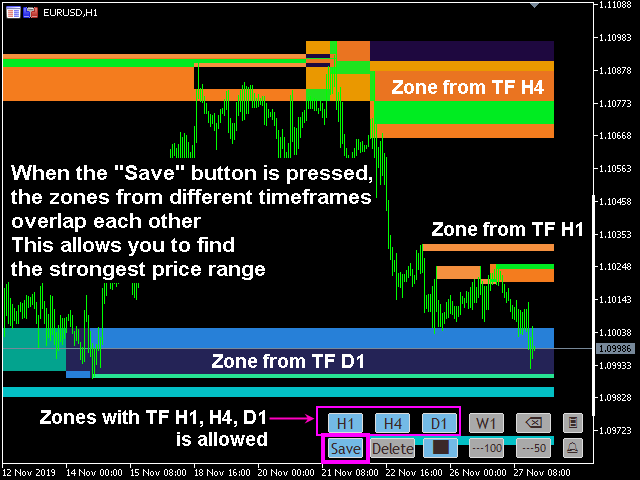
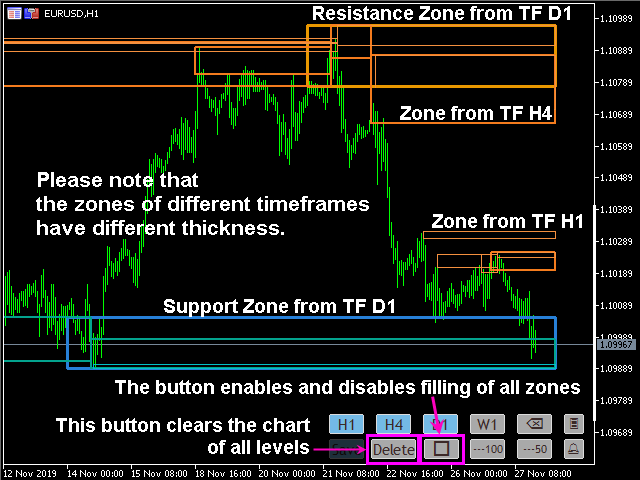
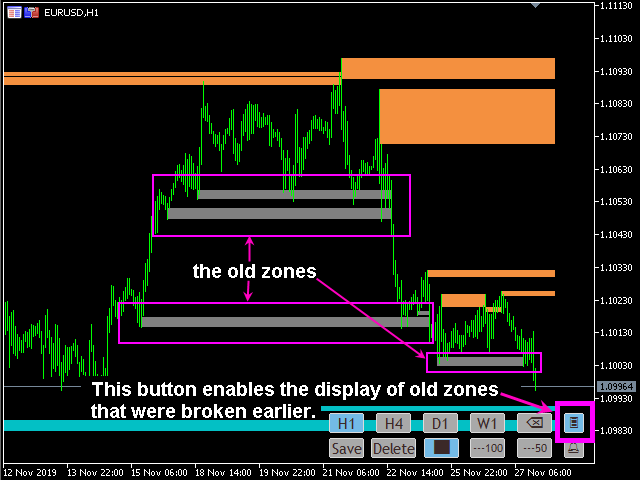
- Any operations with zones for quick and convenient analysis are available: overlapping zones from different TFs in different combinations, deleting, displaying zones with and without filling, showing and hiding “old” zones (worked out) that are already broken.
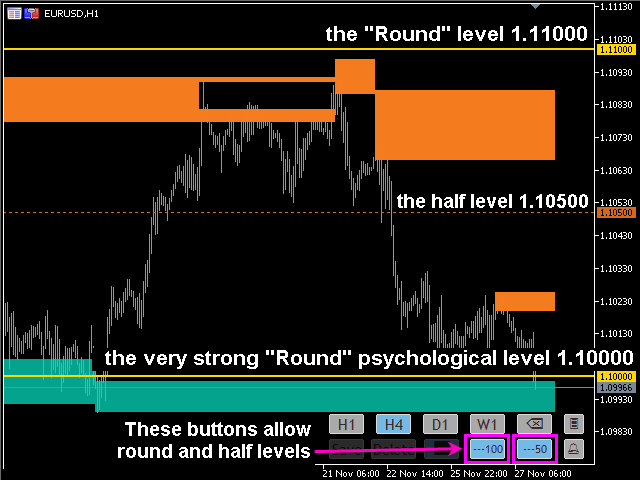
- Display of “round” psychological levels such as 1.30000 and 1.31000. It is possible to display intermediate levels of type 1.31500.
- Quick and easy one-click operation with the keypad.
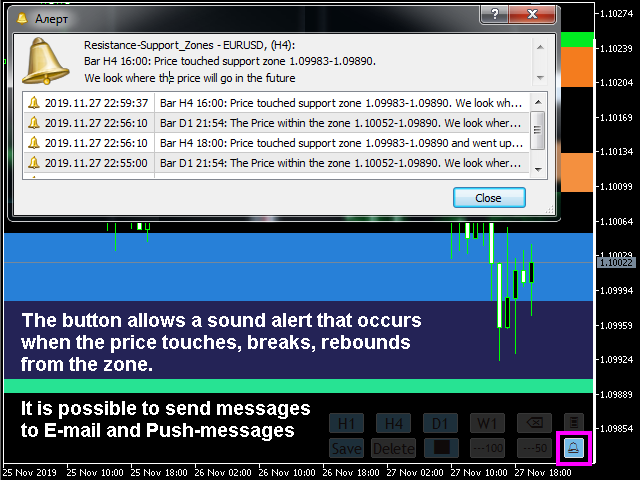
- Sound messages about touch, breakdown, rebound from the zone. Supports sending E-mail and Push messages.
The indicator is absolutely necessary for any trading strategy:
- With its help it is easy to determine where to take profits and set the Stop-Loss level.
- It will increase the reliability of opening a position from any signal:
- Just open a deal on the signal that formed after a rebound from a strong support-resistance zone - the probability of profit will increase many times.
- Close the deal at the nearest border of the opposite zone.
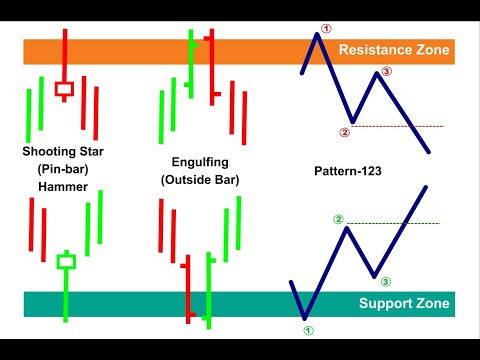
- It perfectly complements the candle analysis - it strengthens the reversal candle models of the Hammer/Shooting Star, Engulfing type.
- Perfectly combined with other elements of the Price Action: Pin-bar, Outside Bar, the Pattern-123.
To automatically detect the Pattern-123 you can use a special “Pattern-123” indicator – the combined use of both indicators brings excellent trading results!
Please note:
- The more support-resistance zones appear on a larger TF, the stronger they are.
- Coincidence of zones from several timeframes increases the probability of a rebound from this price range (to display zones from different TFs simultaneously, the “Save” button must be pressed).
- The reaction of the price to approaching important levels (zones) will help determine the direction of future movement (breakdown or rebound).
Do not use the first reaction of the price to the level for immediate entry into the trade!
This may be a minor correction, after which the price will break through the zone and the old trend will continue. This is especially common in weaker zones from TF H1. Be sure to wait for the zone retest. - The price can react not only to the current active zones, but also to the old zones that were broken earlier. To enable the display of old zones there is a corresponding button.
Indicator Parameters
--- General settings ---
- Control Panel corner - angle bindings of the button control panel
- Number of bars for calculation - number of bars for calculating support-resistance Zones
--- Resistance/Support Zones settings ---
- Support Color H1-H4 (D1-W1) - Support Zone Colors with H1-H4 timeframes (and D1-W1)
- Resistance Color H1-H4 (D1-W1) - Resistance Zone Colors with H1-H4 timeframes (and D1-W1)
- How many days to show Broken Zones - number of days since breaking through the "old" Zones to display them
- Broken Zones Color - Color of the "Old" Zones
--- Round and Half Levels settings ---
- Scale of Round Levels - automatic calculation or you can set manually
- Round Levels Color - Color of "round" levels of type 1.31000
- Round Levels Width - Width of the "round" levels
- Half Levels Color - Color of "Half" levels of type 1.31500
- Half Levels Style - Display style of the "Half" levels
--- Message settings ---
- ON/OFF - Alert – enable messages in the terminal (+ sound)
- ON/OFF - Mail – enable sending notification emails
- ON/OFF - Push – enable sending push notifications to mobile devices


Very good indicator and the support is very good