Strong Pivot Trend

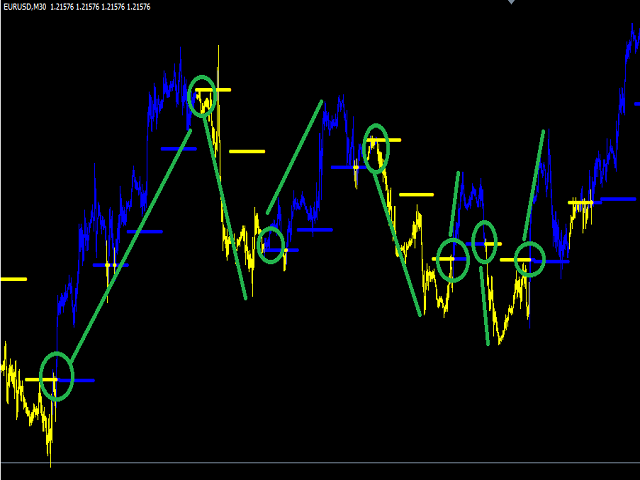
Strong Pivot trend indicator is a trend indicator that uses standard pivot calculation and some indicators. The purpose of the indicator is to calculate the possible trends using the pivot point. And to give the user an idea about trend direction.

You can use this indicator as a trend indicator. Or with other indicators suitable for your strategy.

Features
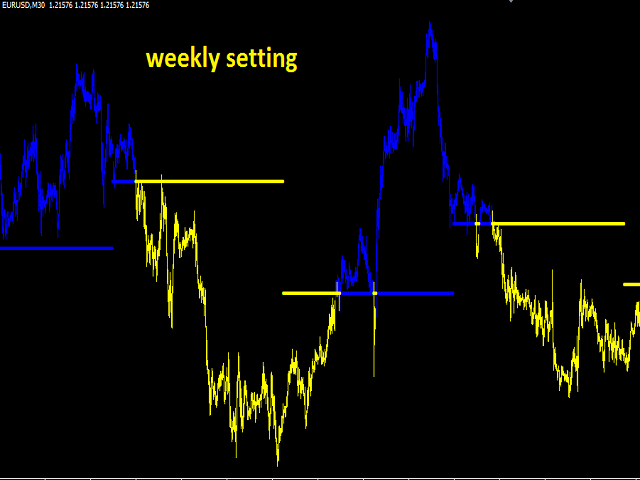
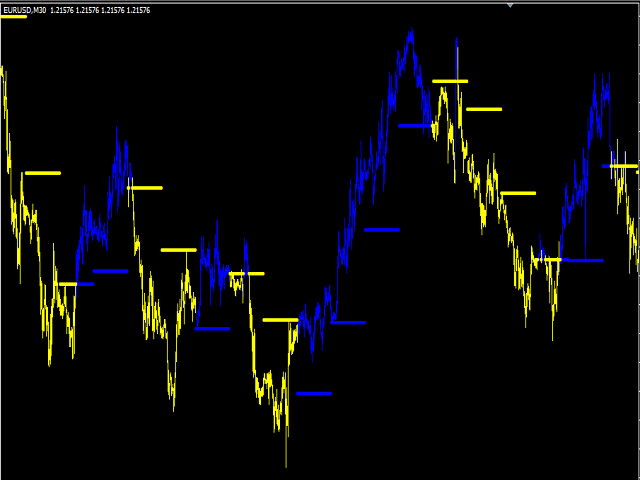
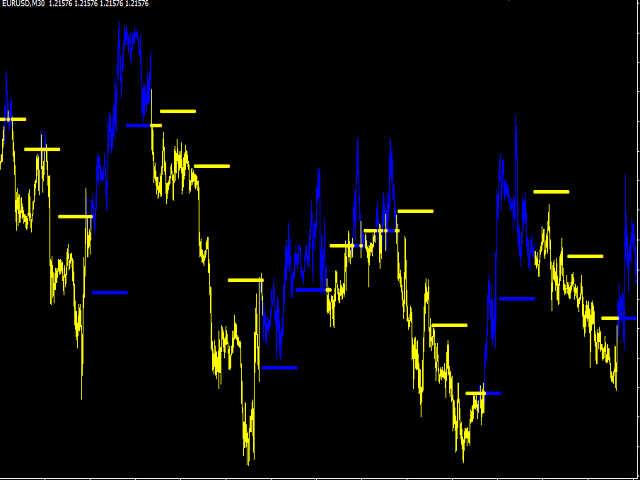
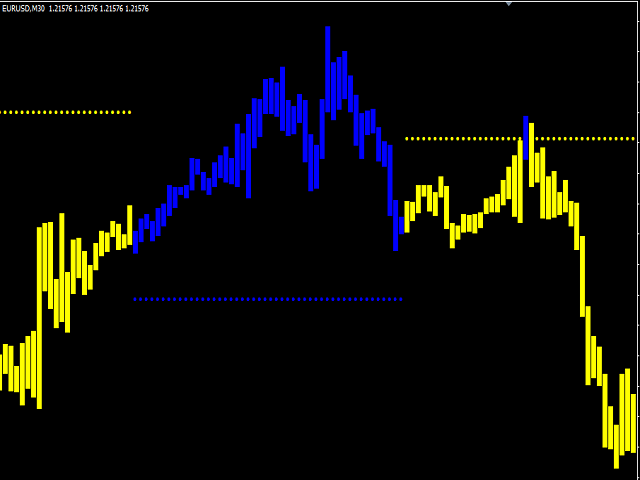
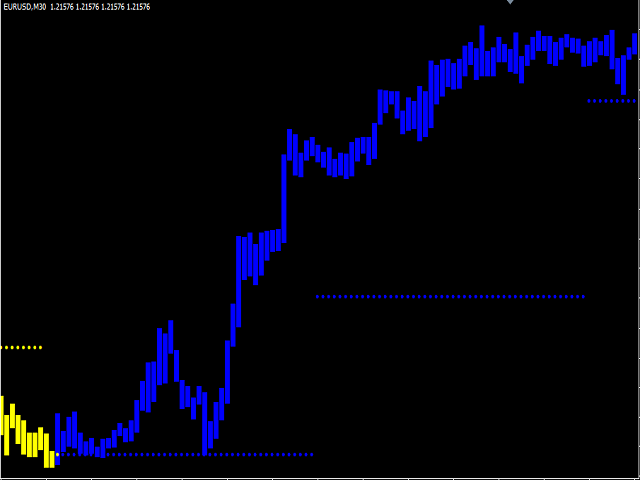
  • The blue bar represents the upward trend.
  • The yellow bar represents the downward trend.
  • The blue pivot point represents the upward trend.
  • The yellow pivot point represents the trend of decline.

Standard setting daily. Recommended setting is weekly. The trend accuracy rate increases at the weekly setting.


Parameters
Period - The time frame for trend calculation is set here.
おすすめのプロダクト
Pivot trend indicator is a trend indicator that uses standard pivot calculation and some indicators. The purpose of the indicator is to calculate the possible trends using the pivot point. And to give the user an idea about trend direction. You can use this display as a trend indicator. Or with other indicators suitable for your strategy. Features The green bar represents the upward trend. The red bar represents the downward trend. The blue pivot point represents the upward trend. The yellow pi
The Auto Super Pivot indicator is an indicator designed to calculate support points and resistance points for pivot points. this indicator has the ability to calculate standard pivot, fibonacci, camarilla, woodie and demark pivot points. It also allows you to use all time zones with the time frame feature. Another feature of the indicator is the auto time slice feature. This feature allows automatic calculations without having to set any time zone. Features 6 different pivot calculation modes A
The price is moving between two curve tunnel lines in a trend. The two lines of a tunnel represent support and resistance. In an uptrend, for instance, a trade might be entered at the support of the trend line (shown by the red line in the chart) and exited at resistance of the upper tunnel line (shown by the blue line). Tunnel show trend direction for any timeframe (if you have enough bars on the chart for higher timeframes). Trend, or price tunnel, can be up, down or sideways. If the current p
Draws high of the day and low of the day anchored VWAPs for multiple days.                   DaysBack = Today only, today + 1 day back, today + 2 days back...               Today recalculates live                             Historical days are computed ONCE and frozen (static).                Colors tab shows exactly 2 entries:                                  High of the day VWAP color  (default: Green)                                   Low of the day VWAP color  (default: Red)               
Pivot Points MT4
KEENBASE SOFTWARE SOLUTIONS
KT Pivot Points は、最新の市場データに基づいて、日足・週足・月足のピボットレベルをチャート上に自動で表示します。ピボットポイントは、特にFX市場において、テクニカル分析で広く利用されている指標の一つです。 特徴 価格がピボットレベルに到達した際にアラートを送信します。  各種類のピボットレベルに対して完全なカスタマイズが可能です。   シンプルな表示で、日足・週足・月足のピボットレベルを一目で確認できます。 最小限のCPUリソースを使用し、高速な計算を実現します。 チャート上の他のインジケーターとも互換性があります。 ピボットポイントとは ピボットポイントは、前の取引日の高値、安値、終値の平均から算出されます。  この計算により、将来のサポートおよびレジスタンスレベルを予測でき、価格がこれらのレベル付近でどのように動くかを判断する手助けとなります。 また、価格がピボットポイントの上にあるときは強気傾向、下にあるときは弱気傾向とされるのが一般的です。 ピボットの計算式 ピボットレベルの計算には、前日、週、または月の高値、安値、終値が使用されます。 P = (H +
Auto Pitchfork Indicator The indicator calculate the Pitch fork for the previous Day (Selectable) with multiple Support and Resistance lines from the Median price which acts as Magnet for the Price that if price touch the above warning (1) or below warning (1) lines and not cross up or down then there is maximum possibilities that it will return to the Median Line, and thus maintain the Price Action in Cyclic Pattern to the Market Move. You are able to select how many warning lines you want to k
フィボナッチ・トレンド・マーカー (Fibonacci Trend Marker) は、現在のローソク足が過去のローソク足の高値-安値(High-Low、HL)範囲に対してどのように振る舞うかを、フィボナッチ・リトレースメントレベルを用いて分析するトレンド指標です。トレンドの強さを視覚的に追跡し、ローソク足の色の変化を通じてトレンドの弱まりや反転の可能性を示します。 特徴: トレンド重視のトレーダーのために設計されており、フィボナッチレベルに基づいてトレンドの変化を素早く検出します。 市場のボラティリティが十分で、3~5本のローソク足が明確な動きを形成する場合、あらゆる時間枠で有効です。 ローソク足のサイズはチャートのスケールに自動的に適応し、ズーム時にも正確な表示を保証します。 現在のローソク足をリアルタイムで分析することでトレンド変化に高い感度を持ち、M1やM5の時間枠でのスキャルピングに最適です。 取引方法: エントリー: 前の閉じたローソク足の色が変化した後にポジションを開きます。例えば、赤いローソク足の後に青で閉じた場合、上昇トレンドのシグナルとなり、買い(Buy)の取引
スペシャルオファー : ALL TOOLS 、1つあたり $35 のみ! New tools   will be   $30   for the   first week   or the   first 3 purchases !  Trading Tools Channel on MQL5 : Join my MQL5 channel to update the latest news from me ボラティリティの高いトレード環境では、パワフルで直感的な分析ツールがあれば、チャンスを素早く捉えることができます。Fibonacci Trend Scanner は従来のFibonacciインジケーター機能とSuperTrendを統合しただけでなく、通貨ペアのスキャン、マルチタイムフレームのモニタリング、そしてトレンドが強気から弱気へ(またはその逆)転換する際にインテリジェントアラートを出す機能など、機能を拡張しています。 See more MT5 version at:   Fibonacci Trend MT5 Scanner See more products at:   A
Fibonacci Wave Bands Indicator The Fibonacci Wave Bands indicator utilizes Fibonacci ratios to create dynamic bands around a central moving average. These bands are derived from key Fibonacci ratios (typically 38.2%, 50%, 61.8%) and adapt to market volatility, offering insights into potential support and resistance zones. Key Features: Fibonacci Levels: The indicator plots multiple bands above and below a central moving average based on Fibonacci ratios. Dynamic Support and Resistance: Bands ser
Introduction Harmonic Patterns are best used to predict potential turning point. Traditionally, Harmonic Pattern was identified manually connecting peaks and troughs points in the chart. Manual harmonic pattern detection is painfully tedious and not suitable for everyone. You are often exposed under subjective pattern identification with manual pattern detection. To avoid these limitations, Harmonic Pattern Plus was designed to automate your harmonic pattern detection process. The functionality
Voenix
Lorentzos Roussos
4.58 (12)
高調波パターン スキャナーとトレーダー。いくつかのチャートパターンも 含まれているパターン: ABCDパターン ガートレーパターン バットパターン 暗号パターン 3ドライブパターン ブラックスワンパターン ホワイトスワンパターン カジモドパターンまたはオーバーアンダーパターン Altバットパターン 蝶のパターン 深いカニ柄 カニ柄 サメ柄 FiveOパターン 頭と肩のパターン 昇順の三角形のパターン ワンツースリーパターン そして8つのカスタムパターン Voenixは、マルチタイムフレームおよびマルチペアのハーモニックパターンスキャナーであり、25のチャートおよびフィボナッチパターンをサポートします。カスタムブロック光学アルゴリズムを利用し、再描画なしで、確認ステップに依存せずに可能なパターンを迅速に発見できます(ジグザグ計算とは異なります)。 )。 選択したパターンを自動的に交換したり、通知を送信したり、テーブルに収集して簡単にアクセスして評価したりできます。 取引には最大3つの利益目標があり、各目標で成約された注文のパーセンテージに関して分散があります。 簡単なステップトレーリン
NO REPAINT ADVANCED CHART PATTERN INDICATOR By definition, a price ( chart)  pattern is a recognizable configuration of price movement that is identified using a series of  trendlines  and/or curves. When a price pattern signals a change in trend direction, it is known as a reversal pattern; a continuation pattern occurs when the trend continues in its existing direction following a brief pause. Advanced Chart Pattern Tracker is designed to find the MOST ACCURATE patterns. A special script is a
Octave Fractal Channel — Dynamic Gann-Based Support/Resistance Levels with Auto-Scaling. This indicator plots a dynamic channel based on the fractal structure of price movement. Channel levels adapt to the current symbol and timeframe, making it suitable for use across various financial instruments — from currency pairs to cryptocurrencies and indices. The indicator can be used in combination with other technical tools, such as the RSI oscillator, to provide additional signal filtering. How to
Advanced version of CyberZingFx Volume Plus, the ultimate MT4 indicator for traders seeking highly accurate buy and sell signals. With an additional strategy and price action dot signals that enhances its effectiveness, this indicator offers a superior trading experience for professionals and beginners alike. The CyberZingFx Volume Plus Advanced version combines the power of volume analysis and historical price data with an additional strategy, resulting in even more precise and reliable signals
Fractal Pivot Lines — Indicator Overview  Fractal Pivot Lines is a custom trend-structure indicator for MetaTrader 4 . It automatically connects key fractal highs and lows with dynamic lines so you can see how price is respecting local structure, building channels, and preparing for potential reversals. Instead of staring at dozens of candles and guessing where the real pivots are, the indicator turns fractals into clear support/resistance paths and trend channels . What the Indicator Does C
This indicator displays potential price levels, support and resistance levels, highest and lowest price levels for Asian, European and American sessions. It works for the day that you select from user interface. It is suitable for gold, bitcoin, all currencies, commodities, crypto currencies and all investment instruments on the metatrader. You can use on the your day trade  transactions easily. This indicator is for metatrader4 platform.
Smart Trendlines – No.1 Trendlines Indicator Smart Trendlines is a precision tool that automatically draws trendlines based on every valid pivot point, helping traders identify key support and resistance zones. It continuously adjusts as new market pivots form, providing a live and accurate reflection of price structure. Whether you’re tracking trends, preparing for reversals, or anticipating breakouts — this indicator keeps you one step ahead. It works seamlessly across all assets including For
EARLY REMINDER: The Starting price is 65 price will rise soon up to 365$ and then 750$ after first 10 copies of sales. Grab this offer now! Introduction Hello, traders! Welcome to the demonstration of the Forex Beast Indicator , a comprehensive tool designed to assist aspiring traders in navigating the complexities of the forex market. This indicator incorporates seven essential components to provide a well-rounded trading experience: Moving Averages Colored Zones Support and Resistance Levels
Classic Fractals indicator for MT4, with additional Trendlines connecting the latest couples of fractals ( fractals are showing highest high, and lowest low on each period) Rules for trendlines: -if new top fractal is below the last one = new resistance line -if new bot fractal is above the last one = new support line -Trendlines can be hidden -Fractals can be hidden Fractal Period = can be both even or uneven number, as it is setting for half (one side) of the bars sequence for findin
MACD Divergence Finder Indicator will help you to find Divergences between your typical MACD values and the Chart Prices as potential points of actual Trend Reversion or Pull Backs to increase your positions as per the current Trend. Indicator Windows draws MACD value and Divergence arrows but not MACD Signal as it is not considered relevant to detect this kind of Classic Divergences. In some computer/VPS with old microprocessors or low RAM size, when you launch this Indicator (attach it, change
Raymond Cloudy Day Indicator for MT4 – Pivot-Based Reversal and Trend Levels Raymond Cloudy Day Indicator is a pivot-based level indicator for MetaTrader 4 (MT4). It was developed by Ngo The Hung based on Raymond’s original idea and is designed to give a structured view of potential reversal zones, trend extensions and support/resistance levels directly on the chart. The default settings are optimised for XAUUSD on the H1 timeframe, but the indicator can be tested and adjusted for other symbols
This indicator filters the Zigzag indicator to calculate the main support and resistance levels. Variables minimum gap between peaks : is the distance (GAP) between the peaks of the Zigzag peaks sensitivity : Minimum number of nearby peaks look back: it means that it has to test the last 50 peaks in the Zigzag object name perfix: a prefix for level’s line name on chart
FREE
このインジケーターは、手動および自動的な方法で描かれる調和パターンを検出します。 ご自身のレビューを追加してください。 注意事項: インジケーターにはコントロールパネルがあり、各(チャートとタイムフレーム)の設定を保存します。スペースを確保するために最小化することができ、他の分析ツールと一緒に作業する際にインジケーターデータをすべて非表示にするために閉じるボタンを押すこともできます。 このインジケーターを使用して設定を変更し、移動平均線やボリンジャーバンドなどのインジケーターを追加する場合、このインジケーターは自動的に編集したテンプレートを保存し、必要なときにロードすることができます。 Windows 10を使用している場合は、MetaTraderアイコンを右クリックして > 互換性 > 高DPI設定の変更 > システム(強化)を選択して、最適な画面設定にしてください(これはHDデバイスで行う必要があります)。 このインジケーターは、チャート上で調和トレーディング理論を解釈したもので、チャート上の調和パターンを検出します。詳しく学びたい場合は、Scott Carneyの「ハーモニックト
BeST_ Classic Pivot Points is an MT4 Indicator that is based on the widely known and definitely classic Pivot Point of a market prices activity. A pivot point is calculated as an average of significant prices (high,low,close) from the performance of a market in the prior trading period. If the market in the following period trades above the pivot point it is usually evaluated as a bullish sentiment, whereas trading below the pivot point is seen as bearish. A pivot point and the associated suppo
FREE
Trend formation channel is a set of lines. The two central lines of the indicator represent moving averages of the specified type and period, they also form a small channel. The large channel is formed - the central lines of the indicator plus / minus the standard deviation estimate, multiplied by the coefficient selected by the user. The basic rule for plotting is that about 5% of prices should be outside these lines, and 95% - inside. If the price crosses the upper or lower line too often, th
VaviStar is an indicator based on trend retracements determined by ZigZag segments. It is theorized, and statistics confirm, that stocks react to certain retracement levels. Many use Fibonacci retracement levels (23.6%, 38.2%, 61.8%). It is assumed that once the price goes beyond the 61.8% retracement, we can already speak of a trend reversal. This indicator allows you to comfortably chart a segment of the ZigZag with the relative operating levels chosen. With a reversal mindset , you can use it
Pivot Point Indicator for MetaTrader 4 (MT4) Overview The Pivot Point Indicator calculates daily, weekly, and monthly pivot points and plots key support and resistance levels on your charts. This indicator helps traders identify potential reversal points and key areas of interest for price action, making it a valuable tool for both short-term and long-term trading strategies. Key Features Daily, Weekly, and Monthly Pivot Points : Easily switch between daily, weekly, and monthly pivot points by a
SMC Venom Model BPR インジケーターは、スマート マネー (SMC) コンセプトで取引するトレーダー向けのプロフェッショナル ツールです。価格チャート上の 2 つの主要なパターンを自動的に識別します。 FVG   (フェアバリューギャップ) は、3 本のローソク足の組み合わせで、最初のローソク足と 3 番目のローソク足の間にギャップがあります。ボリュームサポートのないレベル間のゾーンを形成し、価格修正につながることがよくあります。 BPR   (バランス価格範囲) は、2 つの FVG パターンの組み合わせで、「ブリッジ」を形成します。これは、価格がボリュームアクティビティの少ない動きで動くときに、ブレイクアウトしてレベルに戻るゾーンで、ローソク足の間にギャップを作成します。 これらのパターンは、大規模な市場プレーヤーと一般参加者の相互作用が発生するチャート上のボリュームと価格動向の分析に基づいて、トレーダーが主要なサポート/レジスタンス レベル、ブレイクアウト ゾーン、エントリ ポイントを識別するのに役立ちます。 インジケーターは、長方形と矢印の形でパターンを視
Overview Harmonic Patterns MT4 is a technical analysis indicator designed for the MetaTrader 5 platform. It identifies and displays harmonic price patterns, such as Butterfly, Cypher, Crab, Bat, Shark, and Gartley, in both bullish and bearish directions. The indicator calculates key price levels, including entry, stop loss, and three take-profit levels, to assist traders in analyzing market movements. Visual elements and customizable alerts enhance usability on the chart. Features Detects six ha
Pivot Classic, Woodie, Camarilla, Fibonacci and Demark Floor/Classic Pivot points, or simply pivots, are useful for identifying potential support/resistance levels, trading ranges, trend reversals, and market sentiment by examining an asset's high, low, and closing values. The Floor/Classic Pivot Points can be calculated as follows. Pivot Point (P) = (High + Low + Close)/3 S1 = P * 2 - High S2 = P - (High - Low) S3 = Low – 2*(High - P) R1 = P * 2 - Low R2 = P + (High - Low) R3 = High + 2*(P - L
FREE
このプロダクトを購入した人は以下も購入しています
Gann Made Easy は、ミスター・ギャンの理論を使用した取引の最良の原則に基づいた、プロフェッショナルで使いやすい外国為替取引システムです。 W・D・ガン。このインジケーターは、ストップロスとテイクプロフィットレベルを含む正確な買いと売りのシグナルを提供します。 PUSH通知を利用して外出先でも取引可能です。 ご購入後、取引方法の説明と優れた追加インジケーターを無料で入手するには、私にご連絡ください! おそらく、ギャンの取引手法についてはすでに何度も聞いたことがあるでしょう。通常、ギャンの理論は初心者のトレーダーだけでなく、すでにある程度の取引経験がある人にとっても非常に複雑なものです。なぜなら、ギャンの取引手法は理論的にはそれほど簡単に適用できるものではないからです。私はその知識を磨き、最良の原則を私の外国為替インジケーターに組み込むために数年を費やしました。 このインジケーターは非常に簡単に適用できます。必要なのは、それをチャートに添付し、簡単な取引推奨事項に従うだけです。このインジケーターは常に市場分析の仕事を行い、取引の機会を探します。適切なエントリーポイントを検出す
M1 SNIPER は使いやすいトレーディングインジケーターシステムです。M1時間足向けに設計された矢印インジケーターです。M1時間足でのスキャルピングのためのスタンドアロンシステムとして、また既存のトレーディングシステムの一部としても使用できます。このトレーディングシステムはM1時間足での取引に特化して設計されていますが、他の時間足でも使用できます。元々、この手法はXAUUSDとBTCUSDの取引用に設計しましたが、他の市場においても役立つと考えています。 インジケーターのシグナルは、トレンドの方向と逆方向に取引できます。インジケーターのシグナルを利用して両方向に取引するのに役立つ特別な取引テクニックをご紹介します。この手法は、特別な動的なサポートとレジスタンスの価格帯を利用することに基づいています。 ご購入後、M1 SNIPER矢印インジケーターをすぐにダウンロードできます。さらに、M1 SNIPERツールのすべてのユーザーに、以下のスクリーンショットに表示されているApollo Dynamic SRインジケーターを無料で提供しています。この2つのインジケーターを組み合わせることで
Ultimate Sniper Dashboard
Hispraise Chinedum Abraham
4.82 (22)
299ドルで割引中! 今後値上げの可能性あり! 下の説明を読んでください! 究極のスナイパーダッシュボードのための最高のエントリーシステム。究極のダイナミックレベル。(私の製品をチェックしてください) 究極のスナイパーダッシュボードはMT4多通貨テスト制限のため、ライブマーケットでのみ作動します。 究極のスナイパーダッシュボードをご紹介します。HA-Sniper、MA-Sniper、その他多くの特別なモードが含まれる最高の製品です。究極のスナイパーダッシュボードは絶対的な獣です! 初心者やエキスパートトレーダーにとって最高のソリューションです。もう二度と動きを見逃さない! シンプルさとピップを愛するトレーダーのために、特別な製品をご用意しました。シンプルでありながら、ダッシュボードは複数のカスタムアルゴリズムに基づき28の通貨ペアを監視し、すべての作業を行います。たった一つのチャートで、プロのように市場を読み解くことができます。もし、為替ペアが動き出したときに、その方向性を正確に特定することができれば、あなたの取引はどれほど改善されることでしょう。   当社のシステムは、高い確率
After purchase, contact me privately to receive 1 month of free testing with EA Forex Proton! This advanced MT4 trading robot automatically executes signals from any MT4 indicator, including Market Makers. The latest version also includes AI integration, allowing each trade signal to be analyzed using Artificial Intelligence. Live Signal with EA Forex Proton: Click here Market Makers is a powerful price action trading system designed to identify high-probability Buy and Sell opportunities based
Scalper Inside PRO – Since 2020. An exclusive indicator that utilizes an innovative algorithm to swiftly and accurately determine the market trend. The indicator automatically calculates opening, closing, and profit levels, providing detailed trading statistics. With these features, you can choose the most appropriate trading instrument for the current market conditions. Additionally, you can easily integrate your own arrow indicators into Scalper Inside Pro to quickly evaluate their statistics
Trend Screener
STE S.S.COMPANY
4.79 (95)
トレンドインジケーター、1つのツールに組み込まれたすべての重要なトレンド機能を備えたトレンドトレーディングとフィルタリングのための画期的なユニークなソリューション! これは、すべてのシンボル/商品(外国為替、商品、暗号通貨、インデックス、株式)で使用できる100%再描画されていないマルチタイムフレームおよびマルチ通貨インジケーターです。 期間限定オファー: サポートおよびレジスタンス スクリーナー インジケーターは、たった 50 ドルで永久的にご利用いただけます。(元の価格 250 ドル) (オファー延長) トレンドスクリーナーは、チャート内のドットで矢印トレンドシグナルを提供するインジケーターに続く効率的なインジケーターです。 トレンド分析インジケーターで使用できる機能: 1.トレンドスキャナー。 2.最大利益分析を備えたトレンドライン。 3.トレンド通貨強度メーター。 4.アラート付きのトレンド反転ドット。 5.アラート付きの強いトレンドドット。 6.トレンド矢印 毎日の分析例、毎日のシグナルパフォーマンス...など、トレンドスクリーナーインジケーターを使用して、ここで見つけること
「 Dynamic Scalper System 」インジケーターは、トレンド波の中でスキャルピング取引を行う手法のために設計されています。 主要通貨ペアと金でテスト済みで、他の取引商品との互換性があります。 トレンドに沿った短期的なポジションオープンのシグナルを提供し、追加の価格変動サポートも提供します。 インジケーターの原理 大きな矢印はトレンドの方向を決定します。 トレンド波の中では、小さな矢印の形でスキャルピングシグナルを生成するアルゴリズムが機能します。 赤い矢印は強気方向、青い矢印は弱気方向です。 トレンドの方向には敏感な価格変動ラインが描かれ、小さな矢印のシグナルと連動します。 シグナルは次のように機能します。適切なタイミングでラインが現れるとエントリーシグナルが形成され、ラインが開いている間はポジションが保持され、完了すると取引が終了します。 推奨される動作時間枠はM1~H4です。 矢印は現在のローソク足に形成され、次のローソク足が開いている場合は、前のローソク足の矢印は再描画されません。 入力パラメータ Trend Wave Period - トレンド方向
Super Signal – Skyblade Edition プロ仕様のノンリペイント / ノーラグ・トレンドシグナルシステム。卓越した勝率を実現 | MT4 / MT5 対応 1分足、5分足、15分足などの低い時間足で最も効果を発揮します。 主な特徴: Super Signal – Skyblade Edition は、トレンド取引に特化したスマートなシグナルシステムです。マルチレイヤーのフィルターロジックを用いて、明確な方向性と実際のモメンタムに支えられた強力なトレンドのみを検出します。 このシステムは 天井や底を予測するものではありません 。次の3つの条件がすべて満たされた場合にのみシグナルを発生させます: 明確なトレンド方向 モメンタムの増加 健全なボラティリティ構造 市場セッションに基づく流動性分析と組み合わせることで、シグナルの精度とタイミングがさらに向上します。 シグナルの特性: すべての矢印シグナルは 100% 非リペイント / 遅延なし 一度出現したシグナルは固定され、点滅・消失しません チャート上の矢印、情報パネル、ポップアップ通知、音声アラート、プッシュ通知
まず第一に、この取引ツールはノンリペイント、ノンリドロー、ノンラグの指標であり、プロの取引に理想的ですことを強調する価値があります。 オンラインコース、ユーザーマニュアル、デモ。 スマートプライスアクションコンセプトインジケーターは、新米から経験豊富なトレーダーまで、非常 に強力なツールです。Inner Circle Trader AnalysisやSmart Money Concepts Trading Strategiesなど、20以上の有用な指標を1つに組み合わせています。このインジケーターはスマートマネーコンセプトに焦点を当て、大手機関の取引方法を提供し、彼らの動きを予測するのに役立ちます。 特に、流動性分析に優れており、機関がどのように取引しているかを理解しやすくしています。市場のトレンドを予測し、価格の動きを慎重に分析するのに優れています。機関の戦略とトレードを合わせることで、市場の動向についてより正確な予測ができます。このインジケーターは多目的であり、市場構造を分析し、重要な注文ブロックを特定し、さまざまなパターンを認識するのに優れています。 このインジケーターは
Ultimate Dynamic Levels
Hispraise Chinedum Abraham
4.7 (10)
現在、ホリデーディスカウントで399ドル! 今後値上がりする可能性があります。以下の説明をお読みください。 Ultimate Dynamic Levelsの紹介 - Ultimate Sniper DashboardのBESTエントリーインジケーター! 極めてローリスクなタイムリーエントリーと高RR!!! アルティメットスナイパーダッシュボードはこちら。 初心者はもちろん、プロのトレーダーにとっても最も重要な能力は、いつどこで相場が転換するかを正確に判断し、いかに安全に参入し、利益を得て退場するかを見極めることです。 アルティメット・ダイナミック・レベルズ・インディケーターは、相場が転換する可能性が最も高い場所を簡単に教えてくれるので、極めてローリスクなトレードを自信を持って行うことができ、同時にチャートをクリーンでシンプルに保ちながら、$$$を稼ぐことができるのです! アルティメット・ダイナミック・レベルズ・インディケーターは、複数の時間枠で重要な隠れたレベルを一度に見つけるユニークで強力なアルゴリズムを持っています。また、他の典型的なSRインジケーターのように、レベルを再描
まず第一に、この取引インジケーターは再描画されず、再描画されず、遅延しないことを強調する価値があります。これにより、手動取引とロボット取引の両方に理想的なものになります。 ユーザーマニュアル:設定、入力、戦略。 アトミックアナリストは、価格の強さとモメンタムを利用して市場でより良いエッジを見つけるためのPA価格アクションインジケーターです。ノイズや誤ったシグナルを除去し、取引ポテンシャルを高めるための高度なフィルターを備えています。複雑なインジケーターの複数のレイヤーを使用して、アトミックアナリストはチャートをスキャンし、複雑な数学的計算をシンプルなシグナルと色に変換します。これにより、どのような初心者トレーダーでも理解して使用し、一貫した取引の決定を行うことができます。 「アトミックアナリスト」は、新規および経験豊富なトレーダー向けにカスタマイズされた包括的な取引ソリューションです。プレミアムインジケーターとトップノッチの機能を1つの取引戦略に組み合わせ、すべてのタイプのトレーダーにとって汎用性のある選択肢にします。 デイリートレーディングとスキャルピング戦略:高速で正確な
Route Lines Prices -は、価格の方向性を予測するために設計されたインジケーターです。シンプルなインターフェースには、価格変動と将来の方向性を計算するための複数のアルゴリズムが搭載されています。これらのアルゴリズムには、使用する時間枠に基づいたボラティリティ計算と価格平滑化が含まれています。 このインジケーターには、「 Calculating price values 」値を変更するためのパラメーターが1つだけあります。デフォルト値の1は、バランスの取れた自動計算を提供し、インジケーターを手動で設定することなく使用できます。 値を2から500まで手動で変更することで、インジケーターを独自のトレーディングシステムに合わせてカスタマイズできます。 このインジケーターは、M1からH4の時間枠での使用を推奨します。あらゆる取引銘柄で使用できます。 シグナル矢印はローソク足の終値で生成され、過去の履歴には再描画されません。 メインチャートには、重複した矢印が表示されます。 複数のアラートタイプが利用可能です。内蔵のライン軌跡カウンターは、終値に基づいて動作します。これ
ON Trade Waves Patterns Harmonic Elliot Wolfeをご紹介します。これは手動および自動の方法を使用して市場のさまざまなパターンを検出するために設計された高度なインジケーターです。以下はその動作方法です: ハーモニックパターン: このインジケーターは、チャートに表示されるハーモニックパターンを識別できます。これらのパターンは、Scott Carneyの「Harmonic Trading vol 1および2」で説明されているように、ハーモニックトレーディング理論を実践するトレーダーにとって重要です。手動で描画するか、自動検出に頼るかにかかわらず、ON Trade Waves Patternsがお手伝いします。 コントロールパネル: このインジケーターはユーザーフレンドリーなコントロールパネルを備えています。チャートと時間枠の設定を保存し、異なる構成間をスムーズに切り替えることができます。チャートスペースを最大限に活用するために最小化することもできます。他の分析ツールで作業することを好む場合、閉じるボタンをクリックするだけで、すべてのインジケーターデ
PRO Renko Systemは、特別にRENKOチャートを取引するために設計された高精度の取引システムです。 これは、様々な取引商品に適用することができる普遍的なシステムです。 システムは効果的に正確な逆転信号へのアクセスを与えるいわゆる市場の騒音を中和する。 表示器は非常に使いやすく、信号の生成に責任がある1つの変数だけがあります。 あなたは簡単にお好みの任意の取引ツールとレンコバーのサイズにツールを適応させることができます。 私はいつもあなたが私のソフトウェアで収益性の高い取引を支援するために余分なサポートを提供する準備ができています! 私はあなたに幸せで収益性の高い取引をしたいです! ご購入後にご連絡ください! 私はあなたに私のレンコチャートジェネレータを送信します。 私はまた、私の個人的な推奨事項やシステムの他のモジュールを無料で共有します!
Apollo SR Master は、サポート/レジスタンスゾーンを利用した取引をより容易かつ確実にする特別な機能を備えたサポート/レジスタンスインジケーターです。このインジケーターは、ローカル価格の高値と安値を検出することで、タイムラグなしでリアルタイムにサポート/レジスタンスゾーンを計算します。そして、新たに形成されたSRゾーンを確認するために、インジケーターは特別なシグナルを表示します。このシグナルは、SRゾーンを実際の売りまたは買いシグナルとして考慮して使用できることを示します。この場合、SRゾーンの強度が高まり、SRエリアからの取引が成功する確率も高まります。これがこのインジケーターの基本的な考え方です。 SRゾーンは、ストップロスとテイクプロフィットの設定を容易にします。シグナルの方向に応じて、SRゾーンの上または下のスペースをストップロスとして設定できます。さらに、反対側のSRゾーンは、潜在的なテイクプロフィットエリアとして設定できます。 また、Apollo SRマスターインジケーターをご利用のすべてのユーザーには、「Apollo Price Action System」
通貨強さウィザードは、取引を成功させるためのオールインワン ソリューションを提供する非常に強力な指標です。このインジケーターは、複数の時間枠のすべての通貨のデータを使用して、このまたはその外国為替ペアのパワーを計算します。このデータは、使いやすい通貨インデックスと通貨パワーラインの形式で表され、特定の通貨のパワーを確認するために使用できます。 必要なのは、取引したいチャートにインジケーターを接続することだけです。インジケーターは、取引する通貨の実際の強さを示します。このインジケーターは、トレンドに合わせて取引するときに有利に利用できる売買高の圧力の極値も示します。このインジケーターには、フィボナッチに基づく可能なターゲットも表示されます。 このインジケーターは、PUSH 通知を含むあらゆるタイプのアラートを提供します。 購入後ご連絡下さい。私の取引のヒントをあなたと共有し、素晴らしいボーナスインジケーターを無料で提供します! 幸せで有益な取引をお祈りします。
現在20%OFF! 初心者やエキスパートトレーダーに最適なソリューションです。 このインディケータは、エキゾチックペア・コモディティ・インデックス・先物など、あらゆるシンボルの通貨の強さを表示することに特化したインディケータです。金、銀、原油、DAX、US30、MXN、TRY、CNHなどの通貨の強さを表示するために、9行目にどのシンボルでも追加することができます。独自の機能を多数搭載し、新しい計算式を採用したため、ユニークで高品質、かつ手頃な価格のトレーディングツールとなっています。新しいトレンドやスキャルピングチャンスのトリガーポイントを正確に把握することができるため、あなたのトレードがどのように改善されるか想像してみてください。 ユーザーマニュアル:ここをクリック   https://www.mql5.com/en/blogs/post/708876 すべての時間枠に対応します。あなたはすぐにトレンドを見ることができるようになります! 新しいアルゴリズムに基づいて設計されているため、潜在的な取引の特定と確認がより簡単になります。これは、8つの主要通貨と1つのシンボルの強弱
BTMM State Engine Pro is a MetaTrader 4 indicator for traders who use the Beat The Market Maker approach: Asian session context, kill zone timing, level progression, peak formation detection, and a multi-pair scanner from a single chart. It combines cycle state logic with a built-in scanner dashboard so you do not need the same tool on many charts at once. What it does Draws the Asian session range; session times can follow broker server offset or be set in inputs. Tracks level progression (L
説明書(ロシア語)  /  説明書 (英語)  /  バージョン MT5 主な機能: 売り手と買い手のアクティブなゾーンを表示します。 このインジケーターは、買いと売りの適切な最初のインパルスレベル/ゾーンをすべて表示します。これらのレベル/ゾーンがアクティブになると、エントリーポイントの探索が始まり、レベルの色が変わり、特定の色で塗りつぶされます。状況をより直感的に把握できるように、矢印も表示されます。 LOGIC AI - テンプレートをアクティブ化するときにエントリポイントを検索するためのゾーン(円)の表示 視認性を向上させるため、人工知能を用いて進入ポイントを探索したゾーンを表示する機能が追加されました。 より高い時間枠からのレベル/ゾーンの表示(MTFモード) より長い時間間隔でレベル/ゾーンを表示する機能を追加しました。また、インジケーターに自動トレンド検出機能(   TPSproTREND PRO   )を実装しました。 取引のための個別の専門的なステップバイステップのアルゴリズム このアルゴリズムは、トレンドの方向と逆方向の両方でデイトレードを行うために設計されていま
Linear Trend Predictor ー - エントリ ポイントと方向サポート ラインを組み合わせたトレンド インジケーター。高値/安値チャネルを突破するという原理に基づいて機能します。 インジケーターのアルゴリズムは市場のノイズをフィルタリングし、ボラティリティと市場の動向を考慮します。 インジケーターの機能  平滑化手法を使用して、市場のトレンドと、買い注文または売り注文を開くためのエントリー ポイントを表示します。  任意の時間枠のチャートを分析して、短期および長期の市場の動きを判断するのに適しています。  あらゆる市場や時間枠に適応可能な入力パラメータにより、トレーダーはインジケーターを独自にカスタマイズできます。  設定されたインジケーター信号は消えず、再描画もされません。ローソク足の終値で決定されます。  いくつかの種類の通知が矢印と組み合わされています。  このインジケーターは、独立した取引システムとして使用することも、他の取引システムへの追加として使用することもできます。  あらゆるレベルの経験を持つトレーダーが使用できます。 主なパラメータ Vol
現在40%オフ 初心者やエキスパートトレーダーに最適なソリューション! このインジケーターは、独自の機能と新しい計算式を取り入れた、ユニークで高品質、かつ手頃な価格のトレーディングツールです。たった1枚のチャートで28の為替ペアの通貨強度を読み取ることができます。新しいトレンドやスキャルピングチャンスの引き金となるポイントを正確に特定することができるので、あなたのトレードがどのように改善されるか想像してみてください。 ユーザーマニュアルはこちら  https://www.mql5.com/en/blogs/post/697384 これが最初の1本、オリジナルだ! 価値のないクローンを買わないでください。 特別な サブウィンドウの矢印で強い通貨の勢いを表示 GAPがあなたのトレードを導く! 基準通貨や気配値が売られすぎ・買われすぎのゾーン(外相フィボナッチレベル)にあるとき、個別チャートのメインウィンドウに警告表示。 通貨がレンジの外側から反落した場合、プルバック/リバーサルのアラート。 クロスパターンの特別なアラート 複数の時間枠を選択可能で、トレンドを素早く確認できます
GOLD Impulse with Alert
Bernhard Schweigert
4.67 (12)
このインディケータは、当社の2つの製品 Advanced Currency IMPULSE with ALERT  +   Currency Strength Exotics . のスーパーコンビネーションです。 このインジケーターは全ての時間枠で作動し、8つの主要通貨と1つのシンボルの強弱のインパルスをグラフで表示します。 このインジケータは、金、エキゾチックペア、商品、インデックス、先物など、あらゆるシンボルの通貨強度の加速度を表示することに特化されています。金、銀、原油、DAX、US30、MXN、TRY、CNHなどの通貨強度の加速度(インパルスまたは速度)を表示するために、任意のシンボルを9行目に追加できる、この種の最初のものです。 新しいアルゴリズムに基づいて構築され、潜在的な取引の特定と確認がさらに容易になりました。これは、通貨の強さや弱さが加速しているかどうかをグラフィカルに表示し、その加速の速度を測定するためです。加速すると物事は明らかに速く進みますが、これはFX市場でも同じです。つまり、反対方向に加速している通貨をペアリングすれば、潜在的に利益を生む取引を特定
Trend indicator AI
Ramil Minniakhmetov
4.53 (83)
Trend Ai indicatorは、トレンドの識別と実用的なエントリポイントと反転アラートを組み合わせることで、トレーダーの市場分析を強化する優れたツールです。 この指標は、ユーザーが自信と正確さで外国為替市場の複雑さをナビゲートすることを可能にします トレンドAiインジケーターは、主要なシグナル以外にも、プルバックやリトレースメント中に発生するセカンダリエントリポイントを識別し、トレーダーが確立されたトレンド内の価格修正を活用できるようにします。 重要な利点: *MT4およびMT5の仕事 *明確な買いまたは売りシグナル *再描画しません ·すべての資産で動作します 私はeaやセットをtelegram it詐欺で販売しないように注意してください。 すべての設定はここでブログで無料です。  重要! 指示とボーナスを得るために購入後すぐに私に連絡してください! 私の他のプロダクトと同様、実質操作の監視はここに見つけることができます: https://www.mql5.com/en/users/mechanic/seller&nbsp ; 設定および入力: すべての
Cycle Sniper
Elmira Memish
4.39 (36)
Please contact us after your purchase and we will send you the complimentary indicators to complete the system Cycle Sniper is not a holy grail but when you use it in a system which is explained in the videos, you will feel the difference. If you are not willing to focus on the charts designed with Cycle Sniper and other free tools we provide, we recommend not buying this indicator. We recommend watching the videos about the indiactor and system before purchasing. Videos, settings  and descri
Auto Optimized Parabolic RSI: 高度な3Dモメンタムエンジン ほとんどのリテール向けインジケーターは、市場のボラティリティが変化した瞬間に破綻する静的な入力値に依存しているため、失敗に終わります。Auto Optimized Parabolic RSIは、自らの数学的優位性を継続的に再計算することで「インジケーターの陳腐化」問題を解決し、機関投資家レベルの定量的適応力をMT5ターミナルに直接もたらします。 最大の強み: カスタムインメモリ3D最適化   標準的な自動最適化ツールは、インジケーターの呼び出しで端末に過負荷をかけるため、頻繁にMT5プラットフォームをフリーズさせます。本ツールは、このボトルネックを完全に回避しています。RAMベースのカスタムネイティブ計算機を内蔵した内部エンジンは、チャートを読み込んだりタイムフレームを変更したりするたびに、超高速の3Dグリッド探索を実行します。RSI期間(頻度)、SARステップ(加速度)、SAR最大値(制限速度)を同時にスイープし、プラットフォームを遅延させることなく、数万通りものパラメーターの組み合わせを絶対的
Order Block Hunter
Noha Mohamed Fathy Younes Badr
5 (10)
Order block hunter indicator is the best indicator for  hunt the order blocks that area where there has been a large concentration of limit orders waiting to be executed Order blocks are identified on a chart by observing previous price action and looking for areas where the price experienced significant movement or sudden changes in direction .This indicator does that for you by using very complicated codes and helps you to take the best areas To buy and sell because it make marks at the best a
Advanced Supply Demand
Bernhard Schweigert
4.91 (299)
現在40%オフ 初心者にもエキスパートトレーダーにも最適なソリューション このインジケーターは独自の機能と新しい公式を多数内蔵しており、ユニークで高品質かつ手頃な取引ツールです。このアップデートでは、2つの時間枠ゾーンを表示できるようになります。より長いTFだけでなく、チャートTFとより長いTF(ネストゾーンを表示)の両方を表示できます。すべてのSupply Demandトレーダーの皆さんのお気に召すはずです。:) 重要情報の公開 Advanced Supply Demandの可能性を最大化するには、 https://www.mql5.com/ja/blogs/post/720245 にアクセスしてください。   エントリーまたはターゲットの正確なトリガーポイントを正確に特定できれば取引がどのように改善されるか想像してみてください。新しい基盤となるアルゴリズムに基づいて構築されているため、買い手と売り手の間の潜在的な不均衡をさらに簡単に特定できます。これは、最も強い需要と供給のゾーンと、過去のパフォーマンス(古いゾーンを表示)がグラフィカルに表現されるためです。これらの機能は、最適な
Market Structure Order Block Dashboard MT4 は、市場構造と価格の主要な反応ゾーンをチャート上で直接読み取りたいトレーダーのために設計された MetaTrader 4 用インジケーターです。BOS、ChoCH、Order Blocks、Fair Value Gaps (FVG)、流動性、Kill Zones、Volume Profile、そして素早い分析のためのコンパクトなダッシュボードを統合しています。 このインジケーターは、市場構造、ICT および Smart Money の概念を意思決定の枠組みとして使用するトレーダーを対象としています。トレンド継続、潜在的反転、価格不均衡、流動性ターゲット、関心ゾーンをより構造的に把握するのに役立ちます。 購入者向けリソース 購入後に MQL5 プライベートメッセージで簡単にリクエストするだけで、完全な PDF ユーザーガイドとパラメーター設定のヒントが入手可能です。MQL5 プライベートメッセージで直接技術サポートを提供します。 この MT4 バージョンは MT5 バージョン 1.20 のすべての機能を
- Real price is 80$ - 40% Discount (It is 49$ now) Contact me for instruction, add group and any questions! - Non-repaint - I just sell my products in Elif Kaya profile, any other websites are stolen old versions, So no any new updates or support. - Lifetime update free Related product:   Bitcoin Expert Introduction The breakout and retest strategy is traded support and resistance levels. it involves price breaking through a previous level.  The break and retest strategy is designed to help tr
Volatility Trend System - a trading system that gives signals for entries. The volatility system gives linear and point signals in the direction of the trend, as well as signals to exit it, without redrawing and delays. The trend indicator monitors the direction of the medium-term trend, shows the direction and its change. The signal indicator is based on changes in volatility and shows market entries. The indicator is equipped with several types of alerts. Can be applied to various trading ins
作者のその他のプロダクト
The Super Cross Trend indicator is designed for trend and signal trading. This indicator generates trend signals. It uses many algorithms and indicators to generate this signal. It tries to generate a signal from the points with the highest trend potential. This indicator is a complete trading product. This indicator does not need any additional indicators. You can only trade with this indicator. The generated signals are displayed on the graphical screen. Thanks to the alert features you can ge
This indicator uses Donchian channel and ATR indicators. This trend tracking system uses historical data to buy and sell. This indicator does not repaint. The point at which the signal is given does not change. You can use it in all graphics. You can use it in all pairs. This indicator shows the input and output signals as arrows and alert. Open long deals on blue arrows Open short deals on red arrows When sl_tp is set to true, the indicator will send you the close long and close short warnings.
Box martingale system is an indicator designed to trade martingale. This indicator sends a signal from the highest point where the trend is likely to return. With these signals the user starts the trades. These signals appear in the form of a box. The user can see from which point the signal is given. The important thing in trading martingale is to find a good starting point. This indicator provides this starting point. Trade rules Start processing when the first trade signal arrives. The impor
Face smiling trend indicator is an oscillator designed to search for turning points. Face smiling trend indicator represents an oscillator that uses in his work an average price for a certain period and is designed to determine the price reversal points. Face smiling trend indicator oscillates between 0.00 (oversold) and 105 (overbought) values depending upon market conditions. Red bars suggest bearish pressure and blue bars bullish pressure. Typically, a reversal of the trend occurs when achiev
The High and Low Points indicator is designed to calculate potential order points. The main feature of this indicator is to specify the points that the price can not exceed for a long time. The market always wants to pass points that can not pass. It is necessary to place an order waiting for this point indicated by this indicator. Is an indicator that constitutes many EA strategies. Designed for manual trading. Transaction Strategies High point buy stop order Low point sell stop order For exam
Are you tired of channeling? This indicator is designed to draw channels. Triple graphics channels, automatically installs 3 different graphics channels. These channels are shown on a single graphic. These channels are calculated by a number of different algorithms. Automatically draws on the screen. You can select three time zones. Parameters Period1 - from here you can select the first period. It can be selected from 1 minute time period to monthly time period. Period1_Channel_Color - period1
‌This indicator indicates potential entry points. Rsi indicator and console wax combination. In addition to the signals in the graphic arrows, text comments are also used. Features Works on any currency pairs. It works in all periods. Sensitivity setting. You can set the signal frequency. Use recommended standard settings. ‌The greatest feature of this display is the possibility of manual martingale. The signal intensity region tends to go in the direction of the signal. Works on all charts. An
Pivot trend indicator is a trend indicator that uses standard pivot calculation and some indicators. The purpose of the indicator is to calculate the possible trends using the pivot point. And to give the user an idea about trend direction. You can use this display as a trend indicator. Or with other indicators suitable for your strategy. Features The green bar represents the upward trend. The red bar represents the downward trend. The blue pivot point represents the upward trend. The yellow pi
Strong trend indicator is a special indicator designed to capture healthy signals. There are lines showing the signal of the indicator and the power of buying and selling. The signal line is yellow. The green lines are Buy lines. The ones that are brown are Sell lines. The green line must close above the yellow line to perform the operation. The brown line must close above the yellow line to sell. The important line is the first one that closes above the yellow line. If the first line is green,
The ”Trend Guess” is a complex software that does not involve the MACD, RSI or moving averages. It adapts itself to current market conditions using complicated algorithms based on price action and out custom indicators. The indicator will gives you trading signals Buy or Sell stop loss levels indicated in the popup alert window and graphically. You have to do is to press buy or sell button whenever you get a signal Important Rules Identify a current long term trend. Example – if you trade on a
HC candlestick pattern is a simple and convenient indicator able to define candle patterns.‌ Candlestick charts are a type of financial chart for tracking the movement of securities. They have their origins in the centuries-old Japanese rice trade and have made their way into modern day price charting. Some investors find them more visually appealing than the standard bar charts and the price action is easier to interpret. Hc candlestick pattern is a special indicator designed to find divergence
The Stubborn Scalper indicator can run in any currency pair and at any time interval. The larger the time interval, the less false signals are obtained. Always choose a larger time interval for healthy signals. Trade rules Turn on the Buy action when the Stubborn Scalper indicator turns blue and the trend up warning is displayed. The Stop Loss is set to the level at the end of the green circle. Turn off the operation when the Stubborn Scalper indicator is green or red. Turn on the Sell action w
Big Trend Signal   indicator is designed for trend and signal trading. This indicator generates trend signals.  It uses many algorithms and indicators to generate this signal. It tries to generate a signal from the points with the highest trend potential. This indicator is a complete trading product. This indicator does not need any additional indicators.  You can only trade with this indicator. The generated signals are displayed on the graphical screen.  Thanks to the alert features you can ge
This indicator is designed to find the difference in price and indicator. This indicator uses various indicators. These indicators RSI, Macd, Momentum, RVI, Stochastic, Standard deviation, Derivative, Williams, and custom. You can use these indicators by selecting the indicator type section. This indicator shows the price and indicator difference on the screen. Indicators are individually selectable. You can use the custom type to enter the desired parameters. The user is alerted with the alert
Undefeated trend indicator, an indicator that uses MacD and Bollinger bands. It is a coded indicator to find trends. It finds these trends by its own algorithm. This indicator requires visual monitoring. It does not give any warning because it needs visual follow-up. The main trendline should turn down to find the down trend. The main trend line should go under the white line and then go under the yellow line. The main trendline should turn upward to find the upward trend. The main trend line sh
Super signal series magic arrows is an indicator that generates trade arrows. It generates trade arrows with its own algorithm. These arrows give buying and selling signals. The indicator certainly does not repaint. Can be used in all pairs. Sends a signal to the user with the alert feature. Trade rules Enter the signal when the buy signal arrives. In order to exit from the transaction, an opposite signal must be received. It is absolutely necessary to close the operation when an opposite signa
This indicator is designed to filter trends. Using the RSI indicator we know. It is aimed to confirm trends with this indicator. Can be used alone. It can be used as an indicator to help other indicators. He is already a trend indicator. You can confirm the signals given by other indicators according to your strategy with this indicator. The RSI Trend Filtering indicator confirms trends using a number of complex algorithms. Red below trend zero represents the downward trend. If trend is blue abo
Colored trend indicator is a trend indicator that uses Average True Range and Standard Deviation indications. It is aimed to find more healthy trends with this indicator. This indicator can be used alone as a trend indicator. Detailed review 4 different trend colors appear on this indicator. The blue color represents the upward trend. The dark blue color has a tendency to decline after rising from the rising trend. The red color represents the declining trend. The dark red color has a tendency
Super signal series trend arrows is an indicator designed to generate trading signals. This indicator uses a number of different indicators and generates a signal using a number of historical data. It generally tries to calculate the trend return points. These trend returns may be sometimes very large, sometimes small. The investor should act with the belief that the signal may be small. Monthly median produces 5 to 10 signals. These signals vary according to market conditions. The signals do no
The EMA Trend indicator is a trend indicator using two moving averages. These two moving average is the main trend indicator with 89 EMA. 89 EMA is generally regarded as a trend in the Forex market. The second moving average is 49 EMA. A trend was created using two moving averages. You can use this display alone as a trend indicator. Or with other indicators suitable for your strategy. This indicator sends a warning every new trend starts. Features You can select and edit the periods. Time fram
Every successful trader knows what support and resistance spots are working. And always know that these points need to be kept in mind. They always trade according to this point. The support and resistance point indicator operates in two different modes. The first is the standard support and resistance points we know. The second is Fibonacci levels. This indicator automatically calculates and displays the support and resistance points on the screen. Features You can select the time frame you wa
Real Trend Lines is an indicator that calculates trends using a set of channels and using a set of algorithms. This indicator helps to find trend return points. It generally represents an oscillator. This trend tracking system helps the investor to understand small or large trends and determines the direction according to it. Trending features Up trend Rule 1 - yellow trend line should be below zero level. Rule 2 - the yellow trend line should be in the green and orange channel. Rule 3 - the tr
Super signal series mystery arrows is an indicator designed to generate trading signals. This indicator uses a number of different indicators and generates a signal using a number of historical data. Currency pairs:  Any Time interval:  M5, M15, M30. Suggested M5 Work with at least 20 pairs Parameters AlertsOn -  send alerts. If this feature is activated, it will be activated in other warning properties. AlertsMessage -  send a message AlertsSound -  sound alert setting AlertsEmail -  email ale
Super oscillator indicator is an oscillator designed to calculate trend reversal points. A set of bar calculations and a set of algorithms to calculate trend reversals. Level probing system with high probability trends. All of these features combine to make it easier for investors to find trends. Suggestions and Features There are two levels on the super oscillator indicator. They are at levels of 0.5 and -0.5. The oscillator bar should be below -0.5 to find the upward trend. And a blue color t
Super Trend Bars is a trend finding indicator. It tries to find the trends that are most likely to trend. A set of indicators and a set of algorithms. Trend probability changes color when it finds a high trend. The red color represents the declining trend. The lime color represents the upward trend. Super Trend Bar changes color when it finds a trend. Features This indicator is a trend indicator by itself. It can operate without the need for additional indicators. When you see the first lime co
The super oscillator trading system is a trend finding tool. This system consists of a few indicators and a few algorithms. The aim of this indicator is to direct the investor to find healthy trends. Trade Rules This indicator has two channel lines. These channels are red lines below zero and above zero. There is a line in two places to process. These are blue lines. There is one trend line, the yellow line. Up trend rules Rule 1 - the yellow trend line should close below the red line below the
The trend beads indicator is software that does not include trend indicators such as moving average, Bollinger bands. This indicator works entirely with price and bar movements. The purpose of the indicator is to calculate the most likely trends. To assist the user in determining trend trends. The user determines the trend direction with the colors on the screen. You can use this indicator alone as a trend indicator. Or with other indicators suitable for your strategy. Trade Rules Rising trend
The I Return Signal indicator is a product designed for signal trading. This indicator works by using a number of factors such as a set of indicators, recent history data, bar combinations, price movements, custom filtering system and various algorithms. It uses all of these factors at the same time and generates turn signals. The signals are generated by calculating from the highest possible points of the signal. This indicator is easy to use and understandable. Thanks to the warning features,
Multiple RSI indicator works based on the standard RSI indicator. This indicator will display the RSI indicator from different timeframes on one screen. You will see the RSI indicator for all timeframes on one screen. This indicator saves you from constantly changing charts. At the same time you can analyze the operations of other graphs relative to each other. Features This indicator shows the RSI graph of the timeframe you are working on and the upper timeframe graphs. For example, if you run
The Signal MACD product is an indicator that works with the standard MACD indicator. This indicator is designed to do signal trading using the objective MACD indicator and a set of algorithms. This indicator can be used both as an oscillator and as a signal producing product. So you can use this indicator in two goal. When the indicator finds a signal, it shows arrow marks on the oscillator. These arrows allow investors to trade. Trade Rules "Buy" action when you see a green arrow and receive a
フィルタ:
レビューなし
レビューに返信