Box Martingale System

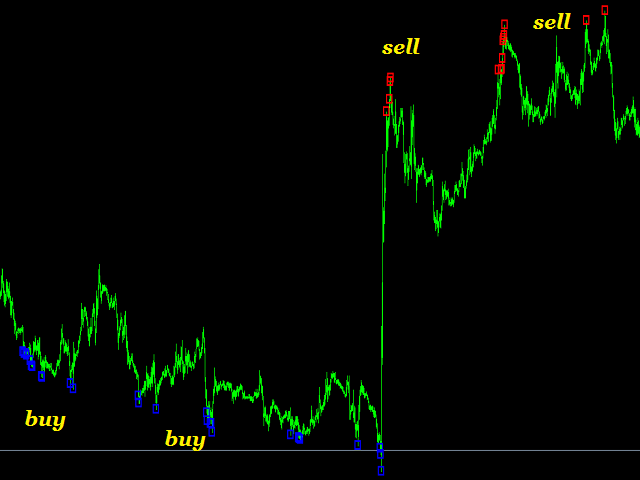
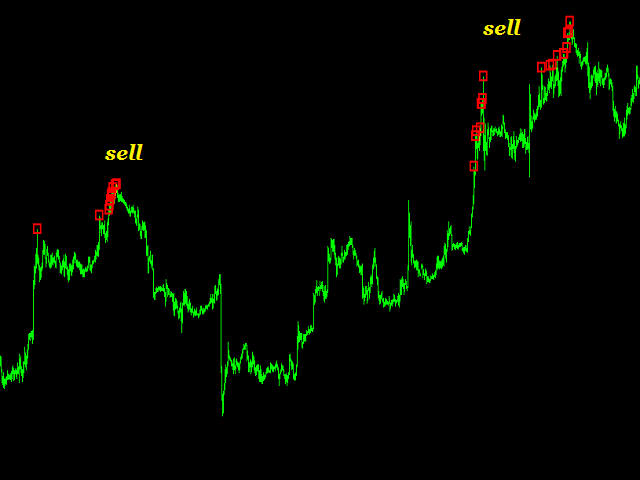
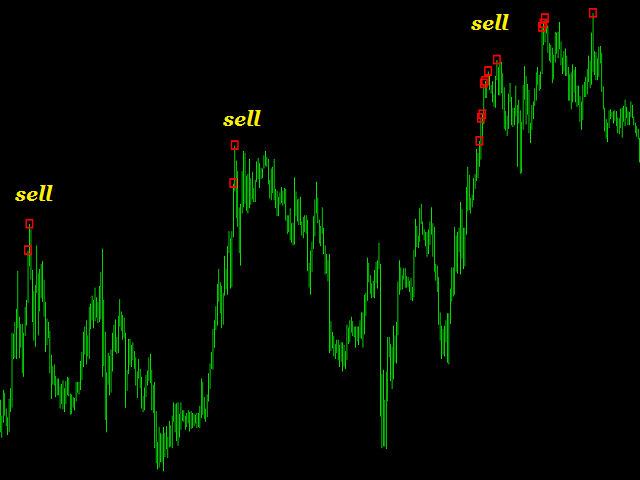
Box martingale system is an indicator designed to trade martingale. This indicator sends a signal from the highest point where the trend is likely to return. With these signals the user starts the trades.

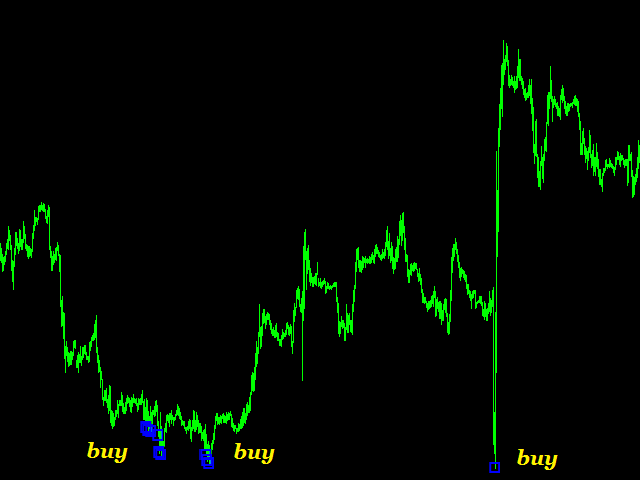
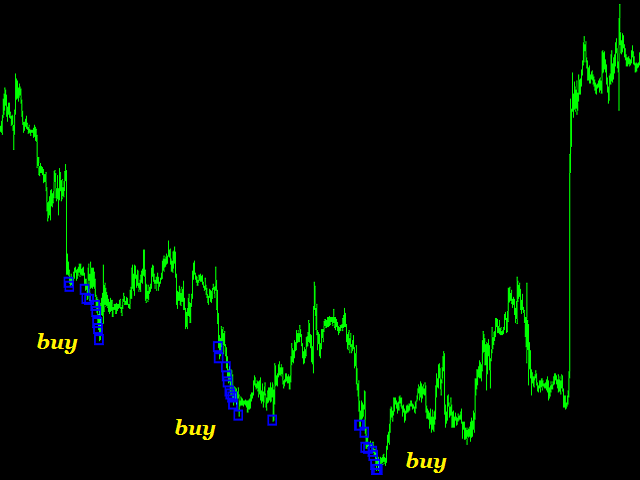
These signals appear in the form of a box. The user can see from which point the signal is given. The important thing in trading martingale is to find a good starting point. This indicator provides this starting point.


Trade rules

  • Start processing when the first trade signal arrives.
  • The important thing is to make the first trade.
  • The indicator will continue to send signals from the points where it finds signals.
  • After that you should proceed according to the plan you choose.
  • Continue to increase the folding order of the lot by 1.1. This is the ideal. It involves more risk.
  • You do not need to follow this indicator constantly.
  • With the help of a VPS.
  • It allows you to send alerts via push notifications and mail.

Recommended time interval: M30

Run with at least 20 pairs.

Operate with a maximum of two pairs at the same time.

For every couple of times a month the trade chance is given.

Because of this reason, if you run over 20 pairs, your chances of trading increase.


Parameters

  • Depth - this property is transaction depth. The higher this is, the more healthy the signal is. The recommended range is 750- 1500.
  • Alerts - this feature sends alerts to the mt4 screen.
  • Alert_mobil - The mobile app sends alerts.
  • Alert_email - this feature will alert you to your mail address.
おすすめのプロダクト
プロトレーダーおよび評価型アカウント(Prop)向けリスク管理・制限監視インジケーター 本ツールは、リスク管理と各種リミットに関する情報をチャート上に表示するのみで、より集中した意思決定をサポートします。インジケーターはポジションの新規/決済/変更を行わず、エキスパートアドバイザー(EA)と干渉しません. 機能 日次および累計ドローダウンの監視 残高(Balance)または有効証拠金(Equity)を基準に日次/累計DDを計算・表示(設定可能)。 設定したリミットまでの残り割合を表示。 チャート上のクリーンでプロフェッショナルなパネル サマリー表:Balance、Equity、現在のP/L、日次/累計DD、アラート閾値。 判断に集中できる読みやすいUI。 リスクに基づくポジションサイズ パーセンテージ/固定金額のリスクと設定したストップロスに基づき概算ロットを算出。 R:R(リスクリワード)比とエントリー、SL、TPをチャートに表示。 アラートと通知 日次/累計DDの閾値に近づいた際にアラート(閾値は設定可能)。 価格がSL/TPに到達、またはその他の定義済みイベント発生時に通知。
Pro Trend Tracking   indicator is designed for trend and signal trading. This indicator generates trend signals.  It uses many algorithms and indicators to generate this signal. It tries to generate a signal from the points with the highest trend potential. This indicator is a complete trading product. This indicator does not need any additional indicators.  You can only trade with this indicator. The generated signals are displayed on the graphical screen.  Thanks to the alert features you can
これは、キャンドルの終値を予測する指標です。 このインジケータは、主にD1チャートでの使用を目的としていますが. この指標は、従来の外国為替取引とバイナリオプション取引の両方に適しています。 インジケーターは、スタンドアロンのトレーディングシステムとして使用することも、既存のトレーディングシステムへの追加として機能させることもできます。 このインジケーターは、現在のキャンドルを分析し、キャンドル自体の内部の特定の強度係数と、前のキャンドルのパラメーターを計算します。 したがって、この指標は、市場の動きのさらなる方向性と現在のキャンドルの終値を予測します。 この方法のおかげで、この指標は、短期の日中取引だけでなく、中期および長期の取引にも適しています。 インジケーターを使用すると、市場の状況の分析中にインジケーターが生成する潜在的な信号の数を設定できます。 インジケーターの設定には、このための特別なパラメーターがあります。 また、インジケーターは、チャート上のメッセージの形式で、電子メールで、およびPUSH通知の形式で、新しい信号について通知することができます。 購入後は必ず私に書いて
This unique multi-currency strategy simultaneously determines the strength of trends and market entry points, visualizing this using histograms on the chart. The indicator is optimally adapted for trading on the timeframes М5, М15, М30, Н1. For the convenience of users, the indicator renders the entry point (in the form of an arrow), recommended take profit levels (TP1, TP2 with text labels) and the recommended Stop Loss level. The take profit levels (TP1, TP2) are automatically calculated for
This is a trend indicator without redrawing Developed instead of the binary options strategy (by the color of the Martingale candlestick) Also works well in forex trading When to open trades (binary options) A signal will appear in the place with a candle signaling the current candle It is recommended to open a deal for one candle of the current timeframe M1 and M5 When a blue dot appears, open a deal up When a red dot appears, open a trade down. How to open trades on Forex. When a signal is rec
フィボナッチリトレースと拡張ラインツール DiNapoliポイント取引方法とゴールデンセクション取引を使用するトレーダーにとって理想的なMT4プラットフォームのフィボナッチリトレースと拡張ラインツール 主な特長: あなたはフィボナッチリトレースメントの複数のセットを直接描くことができ、重要なリターンポイント間の関係は一目瞭然です。 2.フィボナッチ拡張を描画することができます。 3.フィボナッチフォールドバックとラインの延長は、簡単な観察と数値表示のために左右に動かすことができます。 4.チャートは非常に爽やかな 5.数字キーでサイクルを切り替えることができます。 ファンクションキー: 1。 [戻るを押す、要求に応じて描画する、最大8つのグループにする 2。拡張]を描くには[押す] 3。 \を押すと、現在のサイクルの下にあるすべての拡張機能と折り畳みが削除されます 4。フォールドバックを移動して削除して展開する (1)最初のフォールドバックセットのF5行をクリックします。 一度クリックすると(黄色に変わります)、キーボードのDeleteキーを押すと、フォーカ
Trend Bilio - an arrow indicator without redrawing shows potential market entry points in the form of arrows of the corresponding color: upward red arrows suggest opening a buy, green down arrows - selling. The entrance is supposed to be at the next bar after the pointer. The arrow indicator Trend Bilio visually "unloads" the price chart and saves time for analysis: no signal - no deal, if an opposite signal appears, then the current deal should be closed. It is Trend Bilio that is considered
EZZ Elite Zig Zag is an indicator for the MetaTrader 4 terminal. This indicator traces the peak of the trend based on the market reversal, thus showing various opportunities in the financial market. EZZ Elite Zig Zag is a visual tool, intuitive, and easy to understand and use.  Test it Yourself by Downloading it for Free. Author Paulo Rocha all rights reserved
Forex Gump
Andrey Kozak
2.4 (5)
Forex Gump is a fully finished semi-automatic trading system. In the form of arrows, signals are displayed on the screen for opening and closing deals. All you need is to follow the instructions of the indicator. When the indicator shows a blue arrow, you need to open a buy order. When the indicator shows a red arrow, you need to open a sell order. Close orders when the indicator draws a yellow cross. In order to get the most effective result, we recommend using the timeframes H1, H4, D1. There
「ダイナミック・スキャルピング・オシレーター」は、MT4向けの高度なカスタムCrypto_Forexインジケーターです。効率的な取引ツールです! - 新世代のオシレーター - 使い方は画像をご覧ください。 - ダイナミック・スキャルピング・オシレーターは、適応型の売られ過ぎ/買われ過ぎゾーンを備えています。 - オシレーターは、動的な売られ過ぎ/買われ過ぎエリアから正確なエントリーポイントを見つけるための補助ツールです。 - 売られ過ぎ値:グリーンラインより下、買われ過ぎ値:オレンジラインより上。 - このインジケーターは、プライスアクションパターンと組み合わせるのに最適です。 - 標準的なオシレーターよりもはるかに正確です。対応時間枠:M30、H1、H4、D1、W1。 - PCとモバイルの両方でアラート機能付き。 高品質のトレーディングロボットとインジケーターをご覧になるにはここをクリックしてください! これは、このMQL5ウェブサイトでのみ提供されるオリジナル製品です。
SMC Venom Model BPR インジケーターは、スマート マネー (SMC) コンセプトで取引するトレーダー向けのプロフェッショナル ツールです。価格チャート上の 2 つの主要なパターンを自動的に識別します。 FVG   (フェアバリューギャップ) は、3 本のローソク足の組み合わせで、最初のローソク足と 3 番目のローソク足の間にギャップがあります。ボリュームサポートのないレベル間のゾーンを形成し、価格修正につながることがよくあります。 BPR   (バランス価格範囲) は、2 つの FVG パターンの組み合わせで、「ブリッジ」を形成します。これは、価格がボリュームアクティビティの少ない動きで動くときに、ブレイクアウトしてレベルに戻るゾーンで、ローソク足の間にギャップを作成します。 これらのパターンは、大規模な市場プレーヤーと一般参加者の相互作用が発生するチャート上のボリュームと価格動向の分析に基づいて、トレーダーが主要なサポート/レジスタンス レベル、ブレイクアウト ゾーン、エントリ ポイントを識別するのに役立ちます。 インジケーターは、長方形と矢印の形でパターンを視
Was: $249  Now: $99   Market Profile defines a number of day types that can help the trader to determine market behaviour. A key feature is the Value Area, representing the range of price action where 70% of trading took place. Understanding the Value Area can give traders valuable insight into market direction and establish the higher odds trade. It is an excellent addition to any system you may be using. Blahtech Limited presents their Market Profile indicator for the MetaTrader community. Ins
We present you the indicator "Candle closing counter", which will become your indispensable assistant in the world of trading. That’s why knowing when the candle will close can help: If you like to trade using candle patterns, you will know when the candle will be closed. This indicator will allow you to check if a known pattern has formed and if there is a possibility of trading. The indicator will help you to prepare for market opening and market closure. You can set a timer to create a pre
Quantum Balance is a modern arrow indicator that identifies key price reversal points in the market with high accuracy. It is based on a combination of WPR (Williams %R) and RSI (Relative Strength Index), which allows you to identify overbought/oversold moments and enter trades at points of maximum potential. The indicator analyzes price dynamics and market conditions, generating signals only when several confirming factors coincide. This reduces the number of false signals and increases tradin
Unleash Market Volatility with the Titan Force Indicator! Are you ready to dominate the market by capitalizing on volatility? The Titan Force Indicator is your ultimate trading tool, designed for traders who thrive during periods of heightened market activity. Not Optimized for You – Yet! This indicator is a canvas for your creativity. It's been crafted to let you optimize it according to your unique trading strategies and preferences. Your skills, your edge! How Does the Titan Force Indicator
Basic Support and Resistance インジケータは、テクニカル分析を強化するために必要なソリューションです。このインジケータを使用すると、チャートにサポートレベルとレジスタンスレベルを投影できます/ mt5バージョン 機能 フィボナッチレベルの統合: サポートと抵抗レベルとともにフィボナッチレベルを表示するオプションを使用すると、私たちの指標は市場行動と逆転領域の可能性についてさらに深い洞察を提供します。 パフォーマンスの最適化: 各バーの開口部のみで拡張ラインを更新するオプションを使用すると、インジケータは、サポートレベルと抵抗レベルの精度を犠牲にすることなく最適なパフォーマンスを保証します。 入力 メイン設定 Timeframe:  この入力を通じて、より高い時間枠のサポートラインとレジスタンスラインをチャート上に表示することを選択できます。 Support/Resistance Strength [Number of Bars]:  この入力を使用して、サポートと抵抗の強度を決定できます。数が高いほど、サポート/抵抗がより強くなります。 Price m
The new update makes this indicator a complete tool for studying, analyzing and operating probabilistic patterns. It includes: On-chart Multi-asset percentage monitor. Configurable martingales. Twenty-one pre-configured patterns , including Mhi patterns and C3. An advanced pattern editor to store up to 5 custom patterns. Backtest mode to test results with loss reports. Trend filter. Hit operational filter. Martingale Cycles option. Various types of strategies and alerts. Confluence between patte
The Super Arrow Indicator provides non-repainting buy and sell signals with exceptional accuracy. Key Features No repainting – confirmed signals remain fixed Clear visual arrows: green for buy, red for sell Real-time alerts via pop-up, sound, and optional email Clean chart view with no unnecessary clutter Works on all markets: Forex, gold, oil, indices, crypto Adjustable Parameters TimeFrame Default: "current time frame" Function: Sets the time frame for indicator calculation Options: Can be set
MajorAlert - is a professional trading indicator for MetaTrader 4 that combines two distinct market analysis approaches into one powerful tool. By integrating a counter‑trend entry logic (upper block) with a trend‑following filter (lower block), the indicator generates high‑probability signals on the chart with clearly separated arrow colors. Key Features Fully self‑contained   – no external indicators required; all calculations are built‑in. Versatile inputs   – adjust all parameters to suit a
Volume Profile Sniper v11.1は、包括的な市場分析ツールです 取引への専門的なアプローチ ボリュームプロファイルスナイパー v11.1は、市場状況の包括的な評価に基づいて明確な信号を提供し、一つの指標に15以上の主要なフィルタを組み合わせ 主な特長 ボリューム不均衡分析-アルゴリズムは、各キャンドルの買い手と売り手のシェアを計算し、当事者の1つの優位性を通知します(50%から90%までの設定可能なしきい値)。 マルチレベル信号フィルタリング-インジケータは考慮されます: トレンド指標(9/21) 買われ過ぎ/売られ過ぎゾーンを除くRSI キャンドルパターン(ピンバー、吸収、ハンマー) サポート/抵抗レベル(自動検出) 主要なプレーヤーの活動を識別するためのボリュームスパイク クラシックと増幅されたRSIの相違 ボラティリティ評価のためのATR 傾向の強さを決定するためのADX 価格アクション(内部バーと外部バー) 複数の時間枠の確認 市場構造(高値/安値) セッションフィルタ(アジア、ロンドン、ニューヨークセッション) ニュースの
Signal trend indicator. Detects the direction of the trend and is coloured accordingly.  Has built in audible and visual alerts when trends change. Can send notifications to your phone or email. Allows Trend and Counter-Trend trading. Works on all timeframes, all currency pairs, metals, indices and cryptocurrencies. Can be used with binary options. Distinctive features No re-drawing; Simple and clear settings; Four types of alerts; Works on all timeframes and all trading tools; Suitable
Trade Trends Confidently with the Non-Repainting Trend & Arrow Indicator for MT4! Stop missing profitable moves! This powerful indicator helps you: Clearly See the Trend: Easy-to-follow Green/Red lines instantly show you the current market direction (Uptrend/Downtrend). Get Reliable Entry Signals: Accurate Buy/Sell arrows appear precisely when the trend potentially changes. Crucially, these signals are NON-REPAINTING – they appear on bar close and never change afterwards, giving you dependable s
Real Pro Signal   indicator is designed for signal trading. This indicator generates trend signals. It uses many algorithms and indicators to generate this signal. It tries to generate a signal from the points with the highest trend potential. This indicator is a complete trading product. This indicator does not need any additional indicators. The indicator certainly does not repaint. The point at which the signal is given does not change.     Features and Suggestions Time Frame: H1 Works
Heiken Ashi candle chart is an improved version of The Japanese candle chart, which can effectively filter the market "noise" of the Japanese candle chart. It is favored by many traders for its simplicity and intuition. For trend traders, the HA candle chart is a magic tool. Unlike the traditional Japanese candle chart, Heikenashi does not reflect the opening price, high price, low price and closing price of the market. Instead, Heikenashi calculates the value of a single K line in the dominant
Power Bar Signal Indicator 合成通貨ペア向けに設計されたプロフェッショナルなシグナル指標です。マルチステップ検証とリアルタイム統計を使用し、高確率のシグナルを特定するのに役立ちます。 主な機能 マルチステップ検証システム(2/3/4ステップ) 異なる市場状況に適応するシグナルフィルタリング リアルタイムのパフォーマンス統計ダッシュボード 複数のタイムフレームと通貨ペアに対応 合成/OTC市場向けに最適化 動作原理 この指標は価格アクションを分析して高確率のシグナルを特定します。提供される機能: 明確な青/赤矢印による買い/売りシグナル 各ステップごとの勝率統計 チャート上に表示されるパフォーマンス指標 異なる市場セッション向けの適応型フィルタリング 推奨設定 デフォルト設定: 4ステップ検証、ウルトラシグナル有効 ヨーロッパ/米国セッション(07:00-16:00 UTC): 4ステップ検証、ウルトラシグナル有効 アジアセッション(22:00-07:00 UTC): 2-3ステップ検証、ウルトラシグナル無効 パフォーマンス指標 合成通貨ペアでのテスト結果(GB
ナイト ゴースト - バイナリ オプションの矢印インジケーター。 これからのあなたの頼もしいアシスタントです! 11 - チャートの再描画なし - すべての通貨ペアで大活躍! -インジケータの精度は最大 90% (特に夜間) ・長時間の設定不要(バイナリーオプションに最適な設定) - 信号が遅れない - 現在のローソク足でのシグナルの出現 ・M1期にピッタリ(No More!) ・目に優しいキャンドルカラー(赤・青) -インストールされたアラート それを扱う: - 青い矢印は信号アップを示します -赤い下向き矢印 M1 以上のインジケーターをチャートに配置しないでください. シグナルの精度が低下します! インジケーターのスクリーンショットとビデオを見る
Phase Analytics Pro: Advanced Cyclic Market Analyzer Phase Analytics Pro is a sophisticated technical tool designed for traders who prioritize mathematical precision over lag-heavy traditional indicators. Based on the principles of digital signal processing, this indicator decomposes price action into phase and quadrature components to identify the dominant market cycle. How it works: The algorithm calculates the instantaneous phase of the market, allowing it to distinguish between trending and
Title : Market Bias Indicator - Oscillator-Based Trading Tool Introduction : Discover the potential of the "Market Bias Indicator," a revolutionary oscillator-based trading tool designed for precise market analysis. If you're in search of a robust alternative to traditional bias indicators, your quest ends here. Market Bias Indicator offers unparalleled accuracy in identifying market sentiment and is your gateway to confident trading decisions. Recommended Trading Pairs : Market Bias Indicator i
This is the FXTraderariel-TakeProfit - Stop Loss Indicator . It provides you 3 potential Take Profits and 1 Stop Loss. These potential targets are computed based on several methods . The indicator can be used on every time frame, but we advise to use it on H1, H4 and D1. Especially if you are a novice trader. Pro Traders can also you use it for scalping in smaller time frames (M1, M5 and M15). This indicator is not a complete trading system. It doesn't provide you a Signal nor can predict the m
EARLY REMINDER: The Starting price is 65 price will rise soon up to 365$ and then 750$ after first 10 copies of sales. Grab this offer now! Introduction Hello, traders! Welcome to the demonstration of the Forex Beast Indicator , a comprehensive tool designed to assist aspiring traders in navigating the complexities of the forex market. This indicator incorporates seven essential components to provide a well-rounded trading experience: Moving Averages Colored Zones Support and Resistance Levels
このプロダクトを購入した人は以下も購入しています
Gann Made Easy は、ミスター・ギャンの理論を使用した取引の最良の原則に基づいた、プロフェッショナルで使いやすい外国為替取引システムです。 W・D・ガン。このインジケーターは、ストップロスとテイクプロフィットレベルを含む正確な買いと売りのシグナルを提供します。 PUSH通知を利用して外出先でも取引可能です。 ご購入後、取引方法の説明と優れた追加インジケーターを無料で入手するには、私にご連絡ください! おそらく、ギャンの取引手法についてはすでに何度も聞いたことがあるでしょう。通常、ギャンの理論は初心者のトレーダーだけでなく、すでにある程度の取引経験がある人にとっても非常に複雑なものです。なぜなら、ギャンの取引手法は理論的にはそれほど簡単に適用できるものではないからです。私はその知識を磨き、最良の原則を私の外国為替インジケーターに組み込むために数年を費やしました。 このインジケーターは非常に簡単に適用できます。必要なのは、それをチャートに添付し、簡単な取引推奨事項に従うだけです。このインジケーターは常に市場分析の仕事を行い、取引の機会を探します。適切なエントリーポイントを検出す
Ultimate Sniper Dashboard
Hispraise Chinedum Abraham
4.82 (22)
299ドルで割引中! 今後値上げの可能性あり! 下の説明を読んでください! 究極のスナイパーダッシュボードのための最高のエントリーシステム。究極のダイナミックレベル。(私の製品をチェックしてください) 究極のスナイパーダッシュボードはMT4多通貨テスト制限のため、ライブマーケットでのみ作動します。 究極のスナイパーダッシュボードをご紹介します。HA-Sniper、MA-Sniper、その他多くの特別なモードが含まれる最高の製品です。究極のスナイパーダッシュボードは絶対的な獣です! 初心者やエキスパートトレーダーにとって最高のソリューションです。もう二度と動きを見逃さない! シンプルさとピップを愛するトレーダーのために、特別な製品をご用意しました。シンプルでありながら、ダッシュボードは複数のカスタムアルゴリズムに基づき28の通貨ペアを監視し、すべての作業を行います。たった一つのチャートで、プロのように市場を読み解くことができます。もし、為替ペアが動き出したときに、その方向性を正確に特定することができれば、あなたの取引はどれほど改善されることでしょう。   当社のシステムは、高い確率
M1 SNIPER は使いやすいトレーディングインジケーターシステムです。M1時間足向けに設計された矢印インジケーターです。M1時間足でのスキャルピングのためのスタンドアロンシステムとして、また既存のトレーディングシステムの一部としても使用できます。このトレーディングシステムはM1時間足での取引に特化して設計されていますが、他の時間足でも使用できます。元々、この手法はXAUUSDとBTCUSDの取引用に設計しましたが、他の市場においても役立つと考えています。 インジケーターのシグナルは、トレンドの方向と逆方向に取引できます。インジケーターのシグナルを利用して両方向に取引するのに役立つ特別な取引テクニックをご紹介します。この手法は、特別な動的なサポートとレジスタンスの価格帯を利用することに基づいています。 ご購入後、M1 SNIPER矢印インジケーターをすぐにダウンロードできます。さらに、M1 SNIPERツールのすべてのユーザーに、以下のスクリーンショットに表示されているApollo Dynamic SRインジケーターを無料で提供しています。この2つのインジケーターを組み合わせることで
After purchase, contact me privately to receive 1 month of free testing with EA Forex Proton! This advanced MT4 trading robot automatically executes signals from any MT4 indicator, including Market Makers. The latest version also includes AI integration, allowing each trade signal to be analyzed using Artificial Intelligence. Live Signal with EA Forex Proton: Click here Market Makers is a powerful price action trading system designed to identify high-probability Buy and Sell opportunities based
Scalper Inside PRO – Since 2020. An exclusive indicator that utilizes an innovative algorithm to swiftly and accurately determine the market trend. The indicator automatically calculates opening, closing, and profit levels, providing detailed trading statistics. With these features, you can choose the most appropriate trading instrument for the current market conditions. Additionally, you can easily integrate your own arrow indicators into Scalper Inside Pro to quickly evaluate their statistics
まず第一に、この取引ツールはノンリペイント、ノンリドロー、ノンラグの指標であり、プロの取引に理想的ですことを強調する価値があります。 オンラインコース、ユーザーマニュアル、デモ。 スマートプライスアクションコンセプトインジケーターは、新米から経験豊富なトレーダーまで、非常 に強力なツールです。Inner Circle Trader AnalysisやSmart Money Concepts Trading Strategiesなど、20以上の有用な指標を1つに組み合わせています。このインジケーターはスマートマネーコンセプトに焦点を当て、大手機関の取引方法を提供し、彼らの動きを予測するのに役立ちます。 特に、流動性分析に優れており、機関がどのように取引しているかを理解しやすくしています。市場のトレンドを予測し、価格の動きを慎重に分析するのに優れています。機関の戦略とトレードを合わせることで、市場の動向についてより正確な予測ができます。このインジケーターは多目的であり、市場構造を分析し、重要な注文ブロックを特定し、さまざまなパターンを認識するのに優れています。 このインジケーターは
Trend Screener
STE S.S.COMPANY
4.79 (95)
トレンドインジケーター、1つのツールに組み込まれたすべての重要なトレンド機能を備えたトレンドトレーディングとフィルタリングのための画期的なユニークなソリューション! これは、すべてのシンボル/商品(外国為替、商品、暗号通貨、インデックス、株式)で使用できる100%再描画されていないマルチタイムフレームおよびマルチ通貨インジケーターです。 期間限定オファー: サポートおよびレジスタンス スクリーナー インジケーターは、たった 50 ドルで永久的にご利用いただけます。(元の価格 250 ドル) (オファー延長) トレンドスクリーナーは、チャート内のドットで矢印トレンドシグナルを提供するインジケーターに続く効率的なインジケーターです。 トレンド分析インジケーターで使用できる機能: 1.トレンドスキャナー。 2.最大利益分析を備えたトレンドライン。 3.トレンド通貨強度メーター。 4.アラート付きのトレンド反転ドット。 5.アラート付きの強いトレンドドット。 6.トレンド矢印 毎日の分析例、毎日のシグナルパフォーマンス...など、トレンドスクリーナーインジケーターを使用して、ここで見つけること
Route Lines Prices -は、価格の方向性を予測するために設計されたインジケーターです。シンプルなインターフェースには、価格変動と将来の方向性を計算するための複数のアルゴリズムが搭載されています。これらのアルゴリズムには、使用する時間枠に基づいたボラティリティ計算と価格平滑化が含まれています。 このインジケーターには、「 Calculating price values 」値を変更するためのパラメーターが1つだけあります。デフォルト値の1は、バランスの取れた自動計算を提供し、インジケーターを手動で設定することなく使用できます。 値を2から500まで手動で変更することで、インジケーターを独自のトレーディングシステムに合わせてカスタマイズできます。 このインジケーターは、M1からH4の時間枠での使用を推奨します。あらゆる取引銘柄で使用できます。 シグナル矢印はローソク足の終値で生成され、過去の履歴には再描画されません。 メインチャートには、重複した矢印が表示されます。 複数のアラートタイプが利用可能です。内蔵のライン軌跡カウンターは、終値に基づいて動作します。これ
「 Dynamic Scalper System 」インジケーターは、トレンド波の中でスキャルピング取引を行う手法のために設計されています。 主要通貨ペアと金でテスト済みで、他の取引商品との互換性があります。 トレンドに沿った短期的なポジションオープンのシグナルを提供し、追加の価格変動サポートも提供します。 インジケーターの原理 大きな矢印はトレンドの方向を決定します。 トレンド波の中では、小さな矢印の形でスキャルピングシグナルを生成するアルゴリズムが機能します。 赤い矢印は強気方向、青い矢印は弱気方向です。 トレンドの方向には敏感な価格変動ラインが描かれ、小さな矢印のシグナルと連動します。 シグナルは次のように機能します。適切なタイミングでラインが現れるとエントリーシグナルが形成され、ラインが開いている間はポジションが保持され、完了すると取引が終了します。 推奨される動作時間枠はM1~H4です。 矢印は現在のローソク足に形成され、次のローソク足が開いている場合は、前のローソク足の矢印は再描画されません。 入力パラメータ Trend Wave Period - トレンド方向
Ultimate Dynamic Levels
Hispraise Chinedum Abraham
4.7 (10)
現在、ホリデーディスカウントで399ドル! 今後値上がりする可能性があります。以下の説明をお読みください。 Ultimate Dynamic Levelsの紹介 - Ultimate Sniper DashboardのBESTエントリーインジケーター! 極めてローリスクなタイムリーエントリーと高RR!!! アルティメットスナイパーダッシュボードはこちら。 初心者はもちろん、プロのトレーダーにとっても最も重要な能力は、いつどこで相場が転換するかを正確に判断し、いかに安全に参入し、利益を得て退場するかを見極めることです。 アルティメット・ダイナミック・レベルズ・インディケーターは、相場が転換する可能性が最も高い場所を簡単に教えてくれるので、極めてローリスクなトレードを自信を持って行うことができ、同時にチャートをクリーンでシンプルに保ちながら、$$$を稼ぐことができるのです! アルティメット・ダイナミック・レベルズ・インディケーターは、複数の時間枠で重要な隠れたレベルを一度に見つけるユニークで強力なアルゴリズムを持っています。また、他の典型的なSRインジケーターのように、レベルを再描
Super Signal – Skyblade Edition プロ仕様のノンリペイント / ノーラグ・トレンドシグナルシステム。卓越した勝率を実現 | MT4 / MT5 対応 1分足、5分足、15分足などの低い時間足で最も効果を発揮します。 主な特徴: Super Signal – Skyblade Edition は、トレンド取引に特化したスマートなシグナルシステムです。マルチレイヤーのフィルターロジックを用いて、明確な方向性と実際のモメンタムに支えられた強力なトレンドのみを検出します。 このシステムは 天井や底を予測するものではありません 。次の3つの条件がすべて満たされた場合にのみシグナルを発生させます: 明確なトレンド方向 モメンタムの増加 健全なボラティリティ構造 市場セッションに基づく流動性分析と組み合わせることで、シグナルの精度とタイミングがさらに向上します。 シグナルの特性: すべての矢印シグナルは 100% 非リペイント / 遅延なし 一度出現したシグナルは固定され、点滅・消失しません チャート上の矢印、情報パネル、ポップアップ通知、音声アラート、プッシュ通知
ON Trade Waves Patterns Harmonic Elliot Wolfeをご紹介します。これは手動および自動の方法を使用して市場のさまざまなパターンを検出するために設計された高度なインジケーターです。以下はその動作方法です: ハーモニックパターン: このインジケーターは、チャートに表示されるハーモニックパターンを識別できます。これらのパターンは、Scott Carneyの「Harmonic Trading vol 1および2」で説明されているように、ハーモニックトレーディング理論を実践するトレーダーにとって重要です。手動で描画するか、自動検出に頼るかにかかわらず、ON Trade Waves Patternsがお手伝いします。 コントロールパネル: このインジケーターはユーザーフレンドリーなコントロールパネルを備えています。チャートと時間枠の設定を保存し、異なる構成間をスムーズに切り替えることができます。チャートスペースを最大限に活用するために最小化することもできます。他の分析ツールで作業することを好む場合、閉じるボタンをクリックするだけで、すべてのインジケーターデ
現在20%OFF! 初心者やエキスパートトレーダーに最適なソリューションです。 このインディケータは、エキゾチックペア・コモディティ・インデックス・先物など、あらゆるシンボルの通貨の強さを表示することに特化したインディケータです。金、銀、原油、DAX、US30、MXN、TRY、CNHなどの通貨の強さを表示するために、9行目にどのシンボルでも追加することができます。独自の機能を多数搭載し、新しい計算式を採用したため、ユニークで高品質、かつ手頃な価格のトレーディングツールとなっています。新しいトレンドやスキャルピングチャンスのトリガーポイントを正確に把握することができるため、あなたのトレードがどのように改善されるか想像してみてください。 ユーザーマニュアル:ここをクリック   https://www.mql5.com/en/blogs/post/708876 すべての時間枠に対応します。あなたはすぐにトレンドを見ることができるようになります! 新しいアルゴリズムに基づいて設計されているため、潜在的な取引の特定と確認がより簡単になります。これは、8つの主要通貨と1つのシンボルの強弱
まず第一に、この取引インジケーターは再描画されず、再描画されず、遅延しないことを強調する価値があります。これにより、手動取引とロボット取引の両方に理想的なものになります。 ユーザーマニュアル:設定、入力、戦略。 アトミックアナリストは、価格の強さとモメンタムを利用して市場でより良いエッジを見つけるためのPA価格アクションインジケーターです。ノイズや誤ったシグナルを除去し、取引ポテンシャルを高めるための高度なフィルターを備えています。複雑なインジケーターの複数のレイヤーを使用して、アトミックアナリストはチャートをスキャンし、複雑な数学的計算をシンプルなシグナルと色に変換します。これにより、どのような初心者トレーダーでも理解して使用し、一貫した取引の決定を行うことができます。 「アトミックアナリスト」は、新規および経験豊富なトレーダー向けにカスタマイズされた包括的な取引ソリューションです。プレミアムインジケーターとトップノッチの機能を1つの取引戦略に組み合わせ、すべてのタイプのトレーダーにとって汎用性のある選択肢にします。 デイリートレーディングとスキャルピング戦略:高速で正確な
通貨強さウィザードは、取引を成功させるためのオールインワン ソリューションを提供する非常に強力な指標です。このインジケーターは、複数の時間枠のすべての通貨のデータを使用して、このまたはその外国為替ペアのパワーを計算します。このデータは、使いやすい通貨インデックスと通貨パワーラインの形式で表され、特定の通貨のパワーを確認するために使用できます。 必要なのは、取引したいチャートにインジケーターを接続することだけです。インジケーターは、取引する通貨の実際の強さを示します。このインジケーターは、トレンドに合わせて取引するときに有利に利用できる売買高の圧力の極値も示します。このインジケーターには、フィボナッチに基づく可能なターゲットも表示されます。 このインジケーターは、PUSH 通知を含むあらゆるタイプのアラートを提供します。 購入後ご連絡下さい。私の取引のヒントをあなたと共有し、素晴らしいボーナスインジケーターを無料で提供します! 幸せで有益な取引をお祈りします。
説明書(ロシア語)  /  説明書 (英語)  /  バージョン MT5 主な機能: 売り手と買い手のアクティブなゾーンを表示します。 このインジケーターは、買いと売りの適切な最初のインパルスレベル/ゾーンをすべて表示します。これらのレベル/ゾーンがアクティブになると、エントリーポイントの探索が始まり、レベルの色が変わり、特定の色で塗りつぶされます。状況をより直感的に把握できるように、矢印も表示されます。 LOGIC AI - テンプレートをアクティブ化するときにエントリポイントを検索するためのゾーン(円)の表示 視認性を向上させるため、人工知能を用いて進入ポイントを探索したゾーンを表示する機能が追加されました。 より高い時間枠からのレベル/ゾーンの表示(MTFモード) より長い時間間隔でレベル/ゾーンを表示する機能を追加しました。また、インジケーターに自動トレンド検出機能(   TPSproTREND PRO   )を実装しました。 取引のための個別の専門的なステップバイステップのアルゴリズム このアルゴリズムは、トレンドの方向と逆方向の両方でデイトレードを行うために設計されていま
BTMM State Engine Pro is a MetaTrader 4 indicator for traders who use the Beat The Market Maker approach: Asian session context, kill zone timing, level progression, peak formation detection, and a multi-pair scanner from a single chart. It combines cycle state logic with a built-in scanner dashboard so you do not need the same tool on many charts at once. What it does Draws the Asian session range; session times can follow broker server offset or be set in inputs. Tracks level progression (L
Auto Optimized Parabolic RSI: 高度な3Dモメンタムエンジン ほとんどのリテール向けインジケーターは、市場のボラティリティが変化した瞬間に破綻する静的な入力値に依存しているため、失敗に終わります。Auto Optimized Parabolic RSIは、自らの数学的優位性を継続的に再計算することで「インジケーターの陳腐化」問題を解決し、機関投資家レベルの定量的適応力をMT5ターミナルに直接もたらします。 最大の強み: カスタムインメモリ3D最適化   標準的な自動最適化ツールは、インジケーターの呼び出しで端末に過負荷をかけるため、頻繁にMT5プラットフォームをフリーズさせます。本ツールは、このボトルネックを完全に回避しています。RAMベースのカスタムネイティブ計算機を内蔵した内部エンジンは、チャートを読み込んだりタイムフレームを変更したりするたびに、超高速の3Dグリッド探索を実行します。RSI期間(頻度)、SARステップ(加速度)、SAR最大値(制限速度)を同時にスイープし、プラットフォームを遅延させることなく、数万通りものパラメーターの組み合わせを絶対的
Linear Trend Predictor ー - エントリ ポイントと方向サポート ラインを組み合わせたトレンド インジケーター。高値/安値チャネルを突破するという原理に基づいて機能します。 インジケーターのアルゴリズムは市場のノイズをフィルタリングし、ボラティリティと市場の動向を考慮します。 インジケーターの機能  平滑化手法を使用して、市場のトレンドと、買い注文または売り注文を開くためのエントリー ポイントを表示します。  任意の時間枠のチャートを分析して、短期および長期の市場の動きを判断するのに適しています。  あらゆる市場や時間枠に適応可能な入力パラメータにより、トレーダーはインジケーターを独自にカスタマイズできます。  設定されたインジケーター信号は消えず、再描画もされません。ローソク足の終値で決定されます。  いくつかの種類の通知が矢印と組み合わされています。  このインジケーターは、独立した取引システムとして使用することも、他の取引システムへの追加として使用することもできます。  あらゆるレベルの経験を持つトレーダーが使用できます。 主なパラメータ Vol
現在40%オフ 初心者やエキスパートトレーダーに最適なソリューション! このインジケーターは、独自の機能と新しい計算式を取り入れた、ユニークで高品質、かつ手頃な価格のトレーディングツールです。たった1枚のチャートで28の為替ペアの通貨強度を読み取ることができます。新しいトレンドやスキャルピングチャンスの引き金となるポイントを正確に特定することができるので、あなたのトレードがどのように改善されるか想像してみてください。 ユーザーマニュアルはこちら  https://www.mql5.com/en/blogs/post/697384 これが最初の1本、オリジナルだ! 価値のないクローンを買わないでください。 特別な サブウィンドウの矢印で強い通貨の勢いを表示 GAPがあなたのトレードを導く! 基準通貨や気配値が売られすぎ・買われすぎのゾーン(外相フィボナッチレベル)にあるとき、個別チャートのメインウィンドウに警告表示。 通貨がレンジの外側から反落した場合、プルバック/リバーサルのアラート。 クロスパターンの特別なアラート 複数の時間枠を選択可能で、トレンドを素早く確認できます
Easy Breakout
Mohamed Hassan
4.71 (14)
After your purchase, feel free to contact me for more details on how to receive a bonus indicator called VFI, which pairs perfectly with Easy Breakout for enhanced confluence!    Easy Breakout is a powerful price action trading system built on one of the most popular and widely trusted strategies among traders: the Breakout strategy ! This indicator delivers crystal-clear Buy and Sell signals based on breakouts from key support and resistance zones. Unlike typical breakout indicators, it levera
Trend indicator AI
Ramil Minniakhmetov
4.53 (83)
Trend Ai indicatorは、トレンドの識別と実用的なエントリポイントと反転アラートを組み合わせることで、トレーダーの市場分析を強化する優れたツールです。 この指標は、ユーザーが自信と正確さで外国為替市場の複雑さをナビゲートすることを可能にします トレンドAiインジケーターは、主要なシグナル以外にも、プルバックやリトレースメント中に発生するセカンダリエントリポイントを識別し、トレーダーが確立されたトレンド内の価格修正を活用できるようにします。 重要な利点: *MT4およびMT5の仕事 *明確な買いまたは売りシグナル *再描画しません ·すべての資産で動作します 私はeaやセットをtelegram it詐欺で販売しないように注意してください。 すべての設定はここでブログで無料です。  重要! 指示とボーナスを得るために購入後すぐに私に連絡してください! 私の他のプロダクトと同様、実質操作の監視はここに見つけることができます: https://www.mql5.com/en/users/mechanic/seller&nbsp ; 設定および入力: すべての
トレンドラインプロ   市場の真の方向転換点を理解するのに役立ちます。この指標は、真のトレンド反転と主要プレーヤーが再び参入するポイントを示します。 分かりますか     BOSライン   複雑な設定や不要なノイズなしに、より長い時間足でのトレンドの変化と重要なレベルを把握できます。シグナルは再描画されず、バーが閉じた後もチャート上に残ります。 VERSION MT 5     -     RFI LEVELS PRO インジケーター と組み合わせることで、その潜在能力を最大限に発揮します。 インジケーターが示す内容: 本当の変化   トレンド(BOSライン) 一度シグナルが現れたら、それは有効です!これは、リペイント機能を持つインジケーターとの重要な違いです。リペイント機能を持つインジケーターは、シグナルを発した後、それを変更し、資金の損失につながる可能性があります。これにより、より高い確率と精度で市場に参入できます。また、矢印が現れた後、目標値(利益確定)に達するか、反転シグナルが現れるまで、ローソク足の色を変更する機能もあります。 繰り返しエントリ       主要プレーヤーの
Order Block Hunter
Noha Mohamed Fathy Younes Badr
5 (10)
Order block hunter indicator is the best indicator for  hunt the order blocks that area where there has been a large concentration of limit orders waiting to be executed Order blocks are identified on a chart by observing previous price action and looking for areas where the price experienced significant movement or sudden changes in direction .This indicator does that for you by using very complicated codes and helps you to take the best areas To buy and sell because it make marks at the best a
GOLD Impulse with Alert
Bernhard Schweigert
4.67 (12)
このインディケータは、当社の2つの製品 Advanced Currency IMPULSE with ALERT  +   Currency Strength Exotics . のスーパーコンビネーションです。 このインジケーターは全ての時間枠で作動し、8つの主要通貨と1つのシンボルの強弱のインパルスをグラフで表示します。 このインジケータは、金、エキゾチックペア、商品、インデックス、先物など、あらゆるシンボルの通貨強度の加速度を表示することに特化されています。金、銀、原油、DAX、US30、MXN、TRY、CNHなどの通貨強度の加速度(インパルスまたは速度)を表示するために、任意のシンボルを9行目に追加できる、この種の最初のものです。 新しいアルゴリズムに基づいて構築され、潜在的な取引の特定と確認がさらに容易になりました。これは、通貨の強さや弱さが加速しているかどうかをグラフィカルに表示し、その加速の速度を測定するためです。加速すると物事は明らかに速く進みますが、これはFX市場でも同じです。つまり、反対方向に加速している通貨をペアリングすれば、潜在的に利益を生む取引を特定
Apollo SR Master は、サポート/レジスタンスゾーンを利用した取引をより容易かつ確実にする特別な機能を備えたサポート/レジスタンスインジケーターです。このインジケーターは、ローカル価格の高値と安値を検出することで、タイムラグなしでリアルタイムにサポート/レジスタンスゾーンを計算します。そして、新たに形成されたSRゾーンを確認するために、インジケーターは特別なシグナルを表示します。このシグナルは、SRゾーンを実際の売りまたは買いシグナルとして考慮して使用できることを示します。この場合、SRゾーンの強度が高まり、SRエリアからの取引が成功する確率も高まります。これがこのインジケーターの基本的な考え方です。 SRゾーンは、ストップロスとテイクプロフィットの設定を容易にします。シグナルの方向に応じて、SRゾーンの上または下のスペースをストップロスとして設定できます。さらに、反対側のSRゾーンは、潜在的なテイクプロフィットエリアとして設定できます。 また、Apollo SRマスターインジケーターをご利用のすべてのユーザーには、「Apollo Price Action System」
KT Gaussian Trend Filter は、ガウスフィルターと線形回帰スムージングを組み合わせることで、明確かつ正確なトレンド分析を実現します。わかりやすい買いと売りのシグナルを生成しながら、市場の長期的な方向性を効果的に示します。 機能 カスタマイズ可能なガウスフィルター: 期間やポール設定を調整してスムージング精度を高め、トレンドの明瞭さを向上。 線形回帰による強化: ガウススムージングをさらに最適化し、市場のノイズによる誤信号を最小限に抑えます。 マルチタイムフレームスキャナー: 複数の時間軸におけるガウストレンドの方向を自動検出し、わかりやすいダッシュボードに表示します。 トレーリングバンド機能: トレンド中の深い押し目でのエントリーポイントを簡単に把握可能。 カラーカスタマイズ対応: チャートの配色や取引スタイルに合わせて色を自由に設定できます。 内蔵アラート機能: ポップアップ、メール、プッシュ通知、サウンドアラートで即時通知を受け取れます。 使い方 このインジケーターは明確なシグナルを提供し、トレーダーがエントリーやエグジットのタイミングを判断しやすくします
Advanced Supply Demand
Bernhard Schweigert
4.91 (299)
現在40%オフ 初心者にもエキスパートトレーダーにも最適なソリューション このインジケーターは独自の機能と新しい公式を多数内蔵しており、ユニークで高品質かつ手頃な取引ツールです。このアップデートでは、2つの時間枠ゾーンを表示できるようになります。より長いTFだけでなく、チャートTFとより長いTF(ネストゾーンを表示)の両方を表示できます。すべてのSupply Demandトレーダーの皆さんのお気に召すはずです。:) 重要情報の公開 Advanced Supply Demandの可能性を最大化するには、 https://www.mql5.com/ja/blogs/post/720245 にアクセスしてください。   エントリーまたはターゲットの正確なトリガーポイントを正確に特定できれば取引がどのように改善されるか想像してみてください。新しい基盤となるアルゴリズムに基づいて構築されているため、買い手と売り手の間の潜在的な不均衡をさらに簡単に特定できます。これは、最も強い需要と供給のゾーンと、過去のパフォーマンス(古いゾーンを表示)がグラフィカルに表現されるためです。これらの機能は、最適な
Volatility Trend System - a trading system that gives signals for entries. The volatility system gives linear and point signals in the direction of the trend, as well as signals to exit it, without redrawing and delays. The trend indicator monitors the direction of the medium-term trend, shows the direction and its change. The signal indicator is based on changes in volatility and shows market entries. The indicator is equipped with several types of alerts. Can be applied to various trading ins
PRO Renko Systemは、特別にRENKOチャートを取引するために設計された高精度の取引システムです。 これは、様々な取引商品に適用することができる普遍的なシステムです。 システムは効果的に正確な逆転信号へのアクセスを与えるいわゆる市場の騒音を中和する。 表示器は非常に使いやすく、信号の生成に責任がある1つの変数だけがあります。 あなたは簡単にお好みの任意の取引ツールとレンコバーのサイズにツールを適応させることができます。 私はいつもあなたが私のソフトウェアで収益性の高い取引を支援するために余分なサポートを提供する準備ができています! 私はあなたに幸せで収益性の高い取引をしたいです! ご購入後にご連絡ください! 私はあなたに私のレンコチャートジェネレータを送信します。 私はまた、私の個人的な推奨事項やシステムの他のモジュールを無料で共有します!
作者のその他のプロダクト
The Super Cross Trend indicator is designed for trend and signal trading. This indicator generates trend signals. It uses many algorithms and indicators to generate this signal. It tries to generate a signal from the points with the highest trend potential. This indicator is a complete trading product. This indicator does not need any additional indicators. You can only trade with this indicator. The generated signals are displayed on the graphical screen. Thanks to the alert features you can ge
This indicator uses Donchian channel and ATR indicators. This trend tracking system uses historical data to buy and sell. This indicator does not repaint. The point at which the signal is given does not change. You can use it in all graphics. You can use it in all pairs. This indicator shows the input and output signals as arrows and alert. Open long deals on blue arrows Open short deals on red arrows When sl_tp is set to true, the indicator will send you the close long and close short warnings.
Face smiling trend indicator is an oscillator designed to search for turning points. Face smiling trend indicator represents an oscillator that uses in his work an average price for a certain period and is designed to determine the price reversal points. Face smiling trend indicator oscillates between 0.00 (oversold) and 105 (overbought) values depending upon market conditions. Red bars suggest bearish pressure and blue bars bullish pressure. Typically, a reversal of the trend occurs when achiev
The High and Low Points indicator is designed to calculate potential order points. The main feature of this indicator is to specify the points that the price can not exceed for a long time. The market always wants to pass points that can not pass. It is necessary to place an order waiting for this point indicated by this indicator. Is an indicator that constitutes many EA strategies. Designed for manual trading. Transaction Strategies High point buy stop order Low point sell stop order For exam
Are you tired of channeling? This indicator is designed to draw channels. Triple graphics channels, automatically installs 3 different graphics channels. These channels are shown on a single graphic. These channels are calculated by a number of different algorithms. Automatically draws on the screen. You can select three time zones. Parameters Period1 - from here you can select the first period. It can be selected from 1 minute time period to monthly time period. Period1_Channel_Color - period1
‌This indicator indicates potential entry points. Rsi indicator and console wax combination. In addition to the signals in the graphic arrows, text comments are also used. Features Works on any currency pairs. It works in all periods. Sensitivity setting. You can set the signal frequency. Use recommended standard settings. ‌The greatest feature of this display is the possibility of manual martingale. The signal intensity region tends to go in the direction of the signal. Works on all charts. An
Pivot trend indicator is a trend indicator that uses standard pivot calculation and some indicators. The purpose of the indicator is to calculate the possible trends using the pivot point. And to give the user an idea about trend direction. You can use this display as a trend indicator. Or with other indicators suitable for your strategy. Features The green bar represents the upward trend. The red bar represents the downward trend. The blue pivot point represents the upward trend. The yellow pi
Strong trend indicator is a special indicator designed to capture healthy signals. There are lines showing the signal of the indicator and the power of buying and selling. The signal line is yellow. The green lines are Buy lines. The ones that are brown are Sell lines. The green line must close above the yellow line to perform the operation. The brown line must close above the yellow line to sell. The important line is the first one that closes above the yellow line. If the first line is green,
The ”Trend Guess” is a complex software that does not involve the MACD, RSI or moving averages. It adapts itself to current market conditions using complicated algorithms based on price action and out custom indicators. The indicator will gives you trading signals Buy or Sell stop loss levels indicated in the popup alert window and graphically. You have to do is to press buy or sell button whenever you get a signal Important Rules Identify a current long term trend. Example – if you trade on a
HC candlestick pattern is a simple and convenient indicator able to define candle patterns.‌ Candlestick charts are a type of financial chart for tracking the movement of securities. They have their origins in the centuries-old Japanese rice trade and have made their way into modern day price charting. Some investors find them more visually appealing than the standard bar charts and the price action is easier to interpret. Hc candlestick pattern is a special indicator designed to find divergence
The Stubborn Scalper indicator can run in any currency pair and at any time interval. The larger the time interval, the less false signals are obtained. Always choose a larger time interval for healthy signals. Trade rules Turn on the Buy action when the Stubborn Scalper indicator turns blue and the trend up warning is displayed. The Stop Loss is set to the level at the end of the green circle. Turn off the operation when the Stubborn Scalper indicator is green or red. Turn on the Sell action w
Big Trend Signal   indicator is designed for trend and signal trading. This indicator generates trend signals.  It uses many algorithms and indicators to generate this signal. It tries to generate a signal from the points with the highest trend potential. This indicator is a complete trading product. This indicator does not need any additional indicators.  You can only trade with this indicator. The generated signals are displayed on the graphical screen.  Thanks to the alert features you can ge
This indicator is designed to find the difference in price and indicator. This indicator uses various indicators. These indicators RSI, Macd, Momentum, RVI, Stochastic, Standard deviation, Derivative, Williams, and custom. You can use these indicators by selecting the indicator type section. This indicator shows the price and indicator difference on the screen. Indicators are individually selectable. You can use the custom type to enter the desired parameters. The user is alerted with the alert
Undefeated trend indicator, an indicator that uses MacD and Bollinger bands. It is a coded indicator to find trends. It finds these trends by its own algorithm. This indicator requires visual monitoring. It does not give any warning because it needs visual follow-up. The main trendline should turn down to find the down trend. The main trend line should go under the white line and then go under the yellow line. The main trendline should turn upward to find the upward trend. The main trend line sh
Super signal series magic arrows is an indicator that generates trade arrows. It generates trade arrows with its own algorithm. These arrows give buying and selling signals. The indicator certainly does not repaint. Can be used in all pairs. Sends a signal to the user with the alert feature. Trade rules Enter the signal when the buy signal arrives. In order to exit from the transaction, an opposite signal must be received. It is absolutely necessary to close the operation when an opposite signa
This indicator is designed to filter trends. Using the RSI indicator we know. It is aimed to confirm trends with this indicator. Can be used alone. It can be used as an indicator to help other indicators. He is already a trend indicator. You can confirm the signals given by other indicators according to your strategy with this indicator. The RSI Trend Filtering indicator confirms trends using a number of complex algorithms. Red below trend zero represents the downward trend. If trend is blue abo
Colored trend indicator is a trend indicator that uses Average True Range and Standard Deviation indications. It is aimed to find more healthy trends with this indicator. This indicator can be used alone as a trend indicator. Detailed review 4 different trend colors appear on this indicator. The blue color represents the upward trend. The dark blue color has a tendency to decline after rising from the rising trend. The red color represents the declining trend. The dark red color has a tendency
Super signal series trend arrows is an indicator designed to generate trading signals. This indicator uses a number of different indicators and generates a signal using a number of historical data. It generally tries to calculate the trend return points. These trend returns may be sometimes very large, sometimes small. The investor should act with the belief that the signal may be small. Monthly median produces 5 to 10 signals. These signals vary according to market conditions. The signals do no
The EMA Trend indicator is a trend indicator using two moving averages. These two moving average is the main trend indicator with 89 EMA. 89 EMA is generally regarded as a trend in the Forex market. The second moving average is 49 EMA. A trend was created using two moving averages. You can use this display alone as a trend indicator. Or with other indicators suitable for your strategy. This indicator sends a warning every new trend starts. Features You can select and edit the periods. Time fram
Every successful trader knows what support and resistance spots are working. And always know that these points need to be kept in mind. They always trade according to this point. The support and resistance point indicator operates in two different modes. The first is the standard support and resistance points we know. The second is Fibonacci levels. This indicator automatically calculates and displays the support and resistance points on the screen. Features You can select the time frame you wa
Real Trend Lines is an indicator that calculates trends using a set of channels and using a set of algorithms. This indicator helps to find trend return points. It generally represents an oscillator. This trend tracking system helps the investor to understand small or large trends and determines the direction according to it. Trending features Up trend Rule 1 - yellow trend line should be below zero level. Rule 2 - the yellow trend line should be in the green and orange channel. Rule 3 - the tr
Super signal series mystery arrows is an indicator designed to generate trading signals. This indicator uses a number of different indicators and generates a signal using a number of historical data. Currency pairs:  Any Time interval:  M5, M15, M30. Suggested M5 Work with at least 20 pairs Parameters AlertsOn -  send alerts. If this feature is activated, it will be activated in other warning properties. AlertsMessage -  send a message AlertsSound -  sound alert setting AlertsEmail -  email ale
Super oscillator indicator is an oscillator designed to calculate trend reversal points. A set of bar calculations and a set of algorithms to calculate trend reversals. Level probing system with high probability trends. All of these features combine to make it easier for investors to find trends. Suggestions and Features There are two levels on the super oscillator indicator. They are at levels of 0.5 and -0.5. The oscillator bar should be below -0.5 to find the upward trend. And a blue color t
Super Trend Bars is a trend finding indicator. It tries to find the trends that are most likely to trend. A set of indicators and a set of algorithms. Trend probability changes color when it finds a high trend. The red color represents the declining trend. The lime color represents the upward trend. Super Trend Bar changes color when it finds a trend. Features This indicator is a trend indicator by itself. It can operate without the need for additional indicators. When you see the first lime co
The super oscillator trading system is a trend finding tool. This system consists of a few indicators and a few algorithms. The aim of this indicator is to direct the investor to find healthy trends. Trade Rules This indicator has two channel lines. These channels are red lines below zero and above zero. There is a line in two places to process. These are blue lines. There is one trend line, the yellow line. Up trend rules Rule 1 - the yellow trend line should close below the red line below the
The trend beads indicator is software that does not include trend indicators such as moving average, Bollinger bands. This indicator works entirely with price and bar movements. The purpose of the indicator is to calculate the most likely trends. To assist the user in determining trend trends. The user determines the trend direction with the colors on the screen. You can use this indicator alone as a trend indicator. Or with other indicators suitable for your strategy. Trade Rules Rising trend
The I Return Signal indicator is a product designed for signal trading. This indicator works by using a number of factors such as a set of indicators, recent history data, bar combinations, price movements, custom filtering system and various algorithms. It uses all of these factors at the same time and generates turn signals. The signals are generated by calculating from the highest possible points of the signal. This indicator is easy to use and understandable. Thanks to the warning features,
Multiple RSI indicator works based on the standard RSI indicator. This indicator will display the RSI indicator from different timeframes on one screen. You will see the RSI indicator for all timeframes on one screen. This indicator saves you from constantly changing charts. At the same time you can analyze the operations of other graphs relative to each other. Features This indicator shows the RSI graph of the timeframe you are working on and the upper timeframe graphs. For example, if you run
The Signal MACD product is an indicator that works with the standard MACD indicator. This indicator is designed to do signal trading using the objective MACD indicator and a set of algorithms. This indicator can be used both as an oscillator and as a signal producing product. So you can use this indicator in two goal. When the indicator finds a signal, it shows arrow marks on the oscillator. These arrows allow investors to trade. Trade Rules "Buy" action when you see a green arrow and receive a
Advanced awesome indicator is a modified and advanced version of the standard awesome oscillator. With this indicator you can now make adjustments that you can not do on the awesome indicator. You can change and edit this indicator to suit your strategy. You can easily use it to recognize large and small trends. Features The period can be set to define larger and smaller trends with the fast and period slow feature. You can change the input mode with the price mode. You can use Simple, Exponent
フィルタ:
レビューなし
レビューに返信