Over BS RSI Zone Alarm
- インディケータ
- バージョン: 1.10
- アップデート済み: 29 9月 2018
- アクティベーション: 5

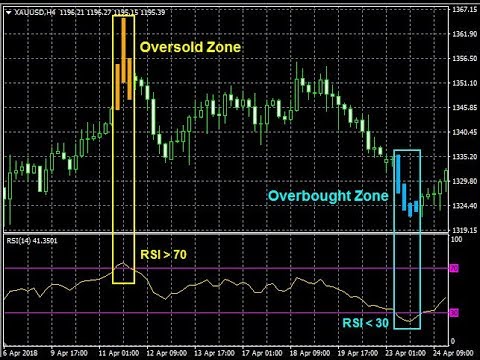
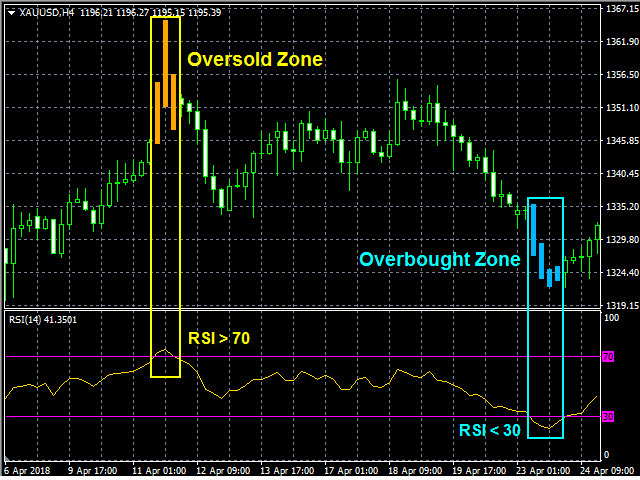
Over BS RSI Zone Alarm is an oscillator indicator which based on RSI oversold/overbought indicator.
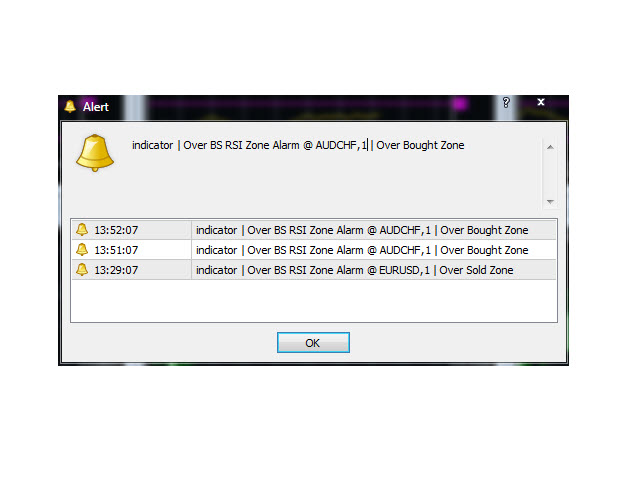
It'll alert signal on next bar open with an audio or pop up on the chart
When RSI above 70 that the signal oversold alert.
And RSI below 30 that the signal overbought alert.
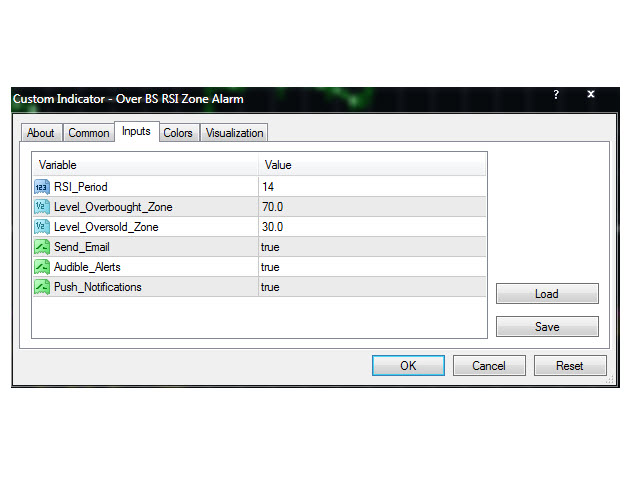
The indicator can customize Level of Relative Strength Index.
Messages/Sounds (Notifications and sound settings)
RSI_Period - Period of Relative Strength Index.
Level_Overbought_Zone - Level of Relative Strength Index for Overbought.
Level_Oversold_Zone - Level of Relative Strength Index for Oversold.
Send_EMail - enable/disable sending emails.
Audible_Alerts - enable/disable messages in the terminal when signals occur.
Push_Notifications - enable/disable sending push notifications to mobile devices.