Triple
- インディケータ
- バージョン: 1.0
- アクティベーション: 5
Triple gives you three great indicators in one:
- Commodity Chanel Index (CCI)
- Exponential Moving Averages (EMA's) x 3
- Relative Strength Index (RSI)
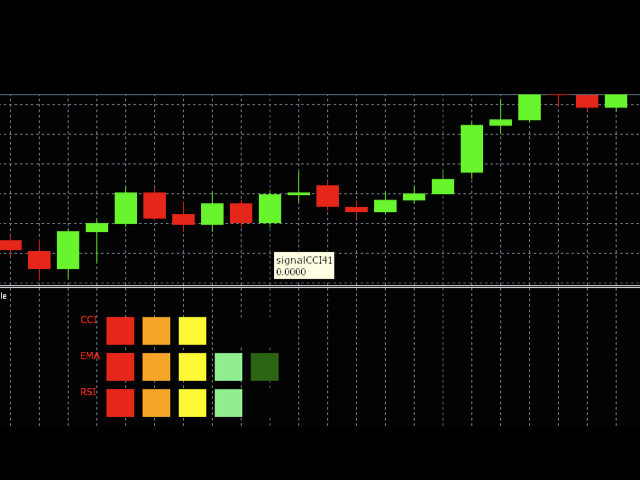
How the indicator works
The indicator works by displaying a grid of 3 different indicators and puts them on a scale from red (bearish) to dark green (bullish).
With a clear and easy to read display metric of 5 separate colours across each indicator.
- Dark Green - Strong Bullish
- Light Green - Bullish
- Yellow - Indifference
- Orange - Bearish
- Red - Strong Bearish
Timeframes & Currencies
The indicator can be used across multiple timeframes and multiple currencies giving you a clear indication of the strength for each setting. Recommended timeframes:
- D1 - Daily Charts
- H1 - Hourly Charts
Features
- Clear visual display
- Easy to use interface
- Chart system to display the strengths of currencies based on each indicator
- Make decisions based on multiple indicators, not just one
- Chart system allows you to identify when patterns start to change direction
Useful Information
- The indicators work on the "Close" of a bar
- Best suited to candlestick charting
- Chart displays best on a black background