Interactive RSI Matrix
- インディケータ
- バージョン: 1.1
- アップデート済み: 10 1月 2018
- アクティベーション: 8

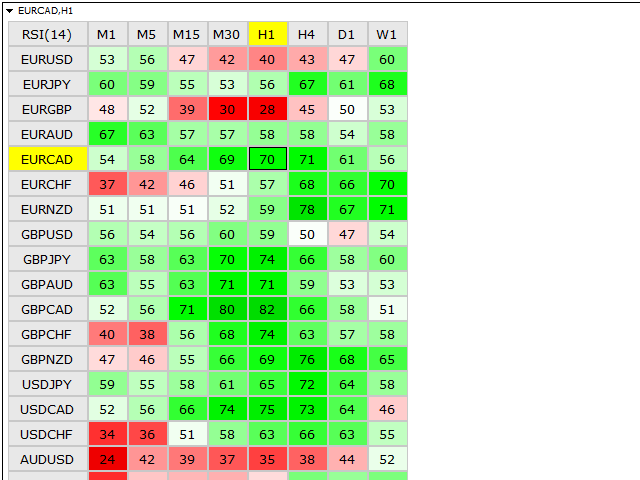
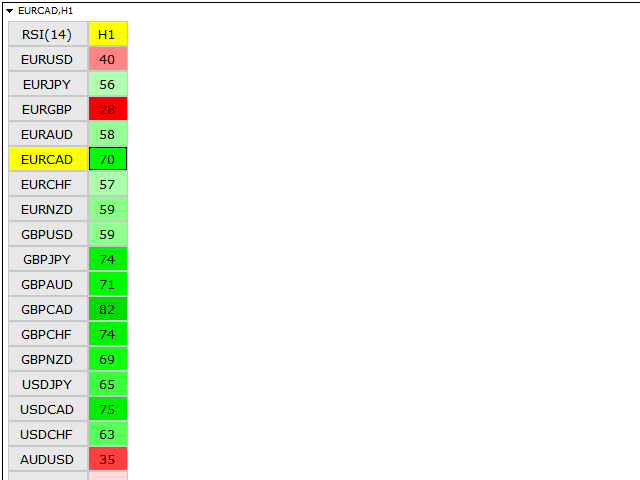
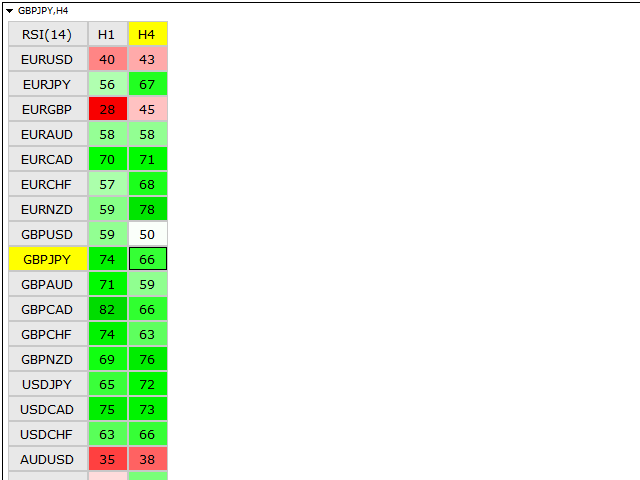
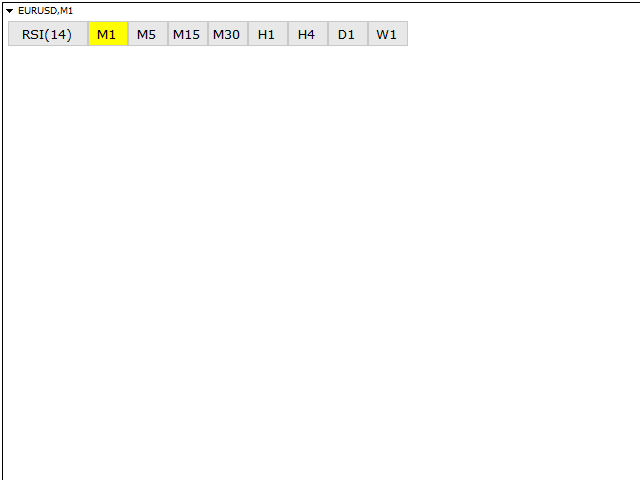
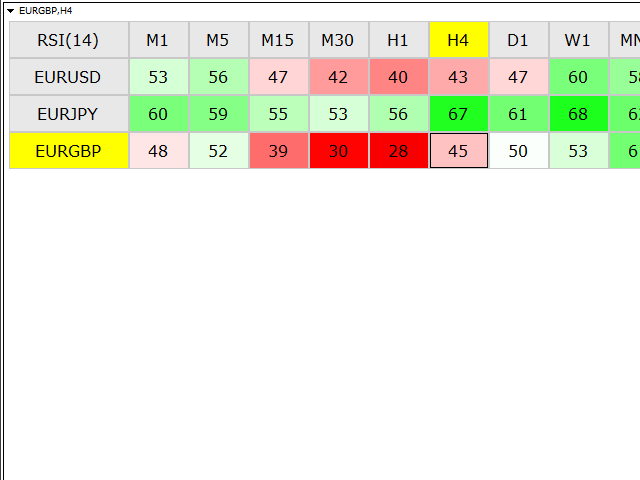
This indicator shows the current RSI values for multiple symbols and multiple timeframes and allows you to switch between timeframes and symbols with one click directly from the matrix.
With this indicator, you can analyze large number of symbols across multiple timeframes and detect the strongest trends in just a few seconds.
Features
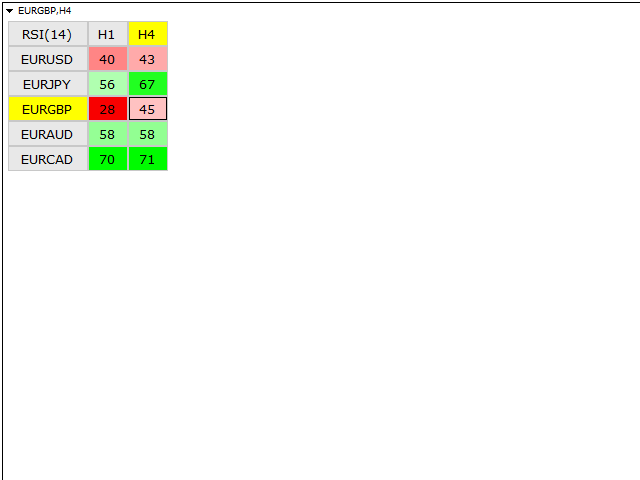
- Shows RSI values for multiple symbols and timeframes simultaneously.
- Colored cells with progressive color intensity depending on the RSI values.
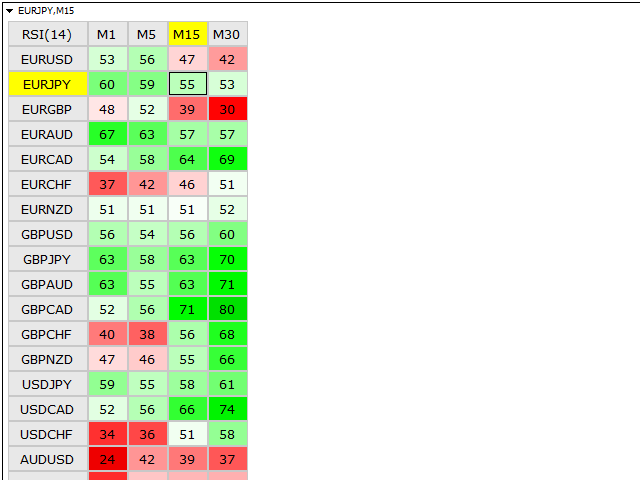
- Ability to change the symbol and the timeframe on the chart with one click directly from the matrix.
- Ability to adjust the size of the interface and the font.
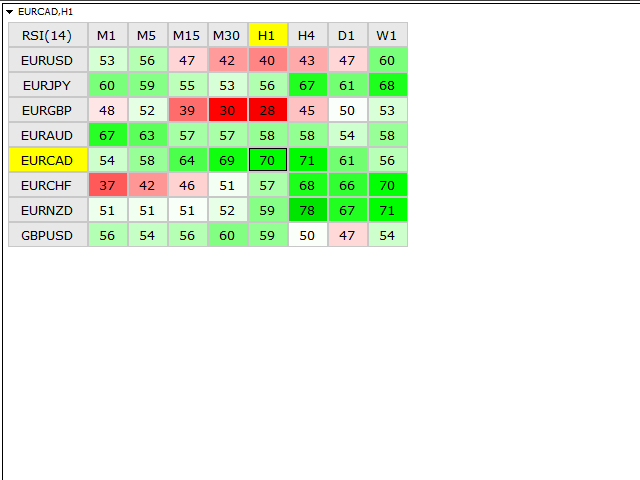
- Ability to set the number of symbols and timeframes.
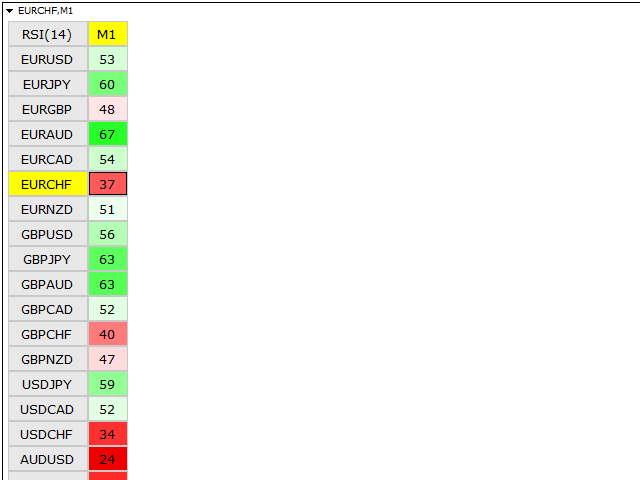
- Ability to set neutral zone. (For example - red color below 30, gray color from 30 to 70, green color above 70)
- The indicator is automatically synchronized with the Market Watch window in MetaTrader 4 where you can set custom lists with symbols.
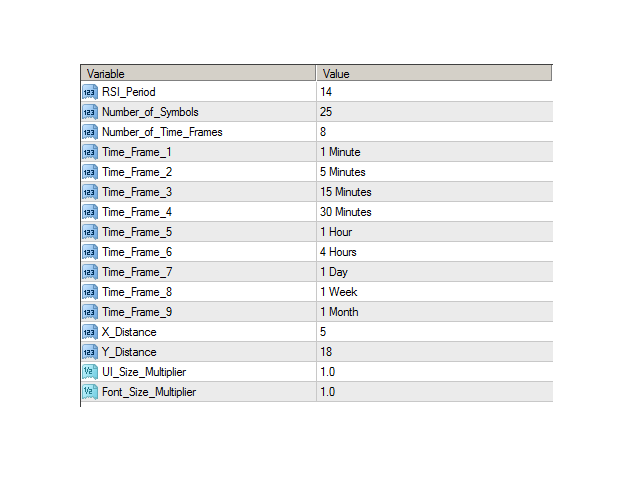
Settings
- RSI Period - number of periods (the standard is 14).
- Number of Symbols - how many symbols to display.
- Number of Time Frames - how many timeframes to display.
- Neutral Zone High - maximum RSI value.
- Neutral Zone Low - minimum RSI value.
- Time Frame 1 - select timeframe.
- Time Frame 2 - select timeframe.
- Time Frame 3 - select timeframe.
- Time Frame 4 - select timeframe.
- Time Frame 5 - select timeframe.
- Time Frame 6 - select timeframe.
- Time Frame 7 - select timeframe.
- Time Frame 8 - select timeframe.
- Time Frame 9 - select timeframe.
- X Distance - horizontal distance from the upper left corner.
- Y Distance - vertical distance from the upper left corner.
- UI Size Multiplier - increase or decrease the size of the interface.
- Font Size Multiplier - increase or decrease the size of the font.
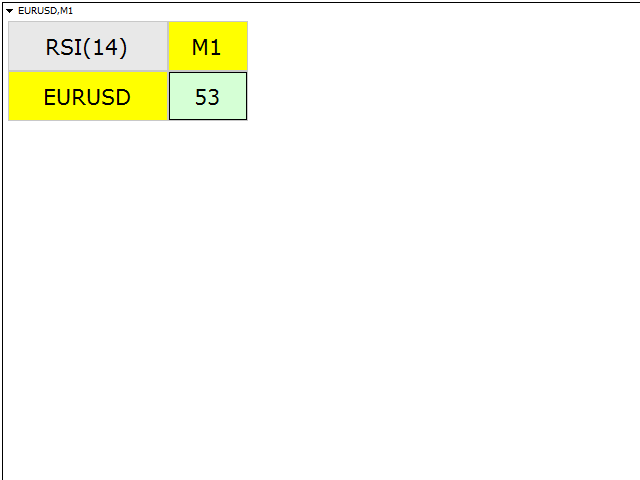
Note! The demo is not fully functional because the tester works only with one symbol at a time. So there is no way to switch between symbols or timeframes.
If you have some questions or if you need help, contact me via PM.


作者,您 好,非常棒的指标,有个建议,能不能添加增减货币对的功能 。就是自己定义货币对,现在好多没有用的货币对占用空间。
是自己操作还不熟练,自己想办法已经解决了。