Ratio TP SL

5

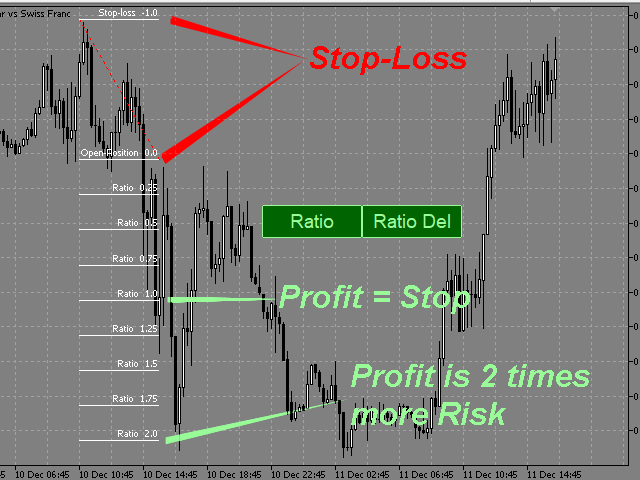
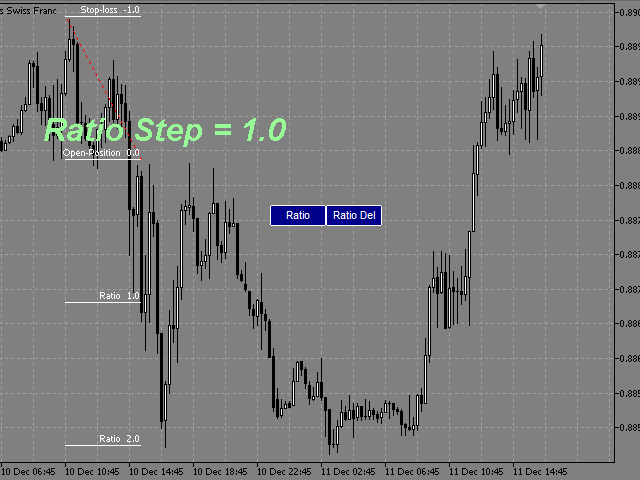
This indicator allows you to measure the profitability of each specific transaction (the ratio of Stop and Profit).

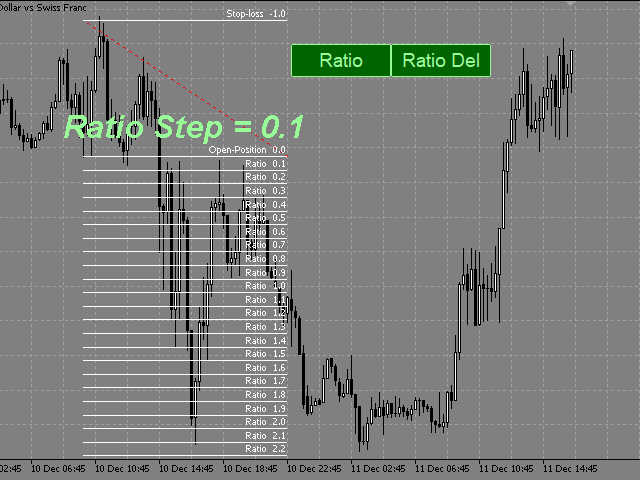
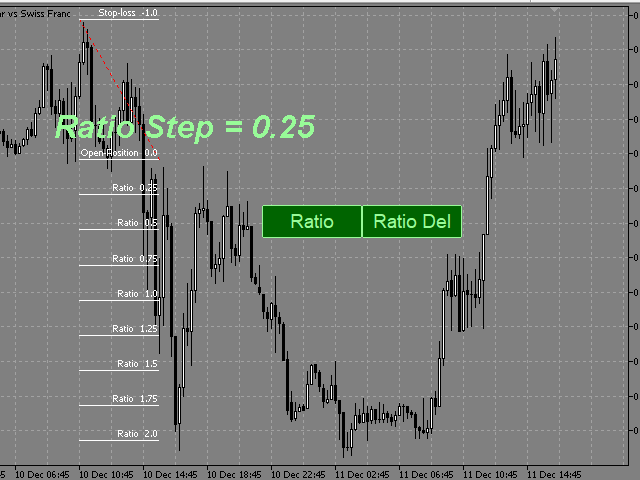
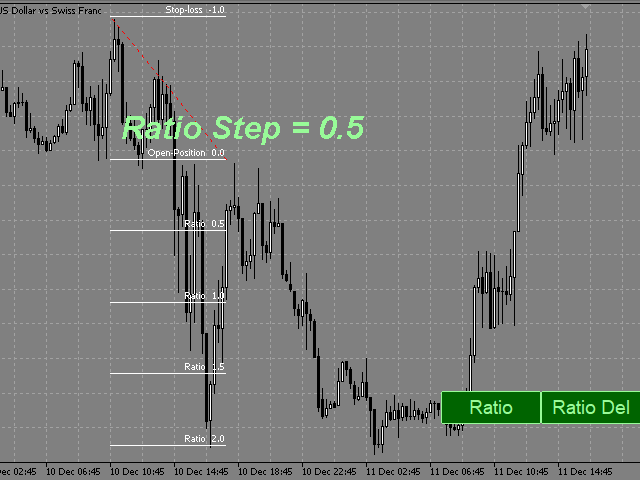
The indicator allows you to adjust the ratio by step size and number of steps.

You can build an unlimited number of ratios to compare the risks from different movements.


Note: in MT4, the number of horizontal lines in a single ratio cannot exceed 32.


Building a line
: click the "Ratio" button and draw a line (mouse click - the first point of the line, where the mouse is released - the second point of the line).  

Changing the Ratio: select a line and drag it with the mouse.

Delete all ratios: click "Ratio_Del". During the number of seconds selected in the "Ratio_Del_Cancel" setting, the "Ratio_Del" button can be clicked to cancel, and the "Ratio_Del" command will be canceled.

The size of the buttons depends on the font in the Button_Font setting and its size in the Button_FontSize setting.
On-screen buttons can be dragged with the mouse.
You can assign keyboard shortcuts to on-screen buttons (a-Z, 0-9). 


    Настройки

    • Ratio_Step - ratio step.
    • Ratio_Maximum - the maximum value of the ratios.
    • Ratio_key -hotkey for drawing the ratio (you can assign (a-Z, 0-9)).
    • Ratio_Del_key - hotkey for deleting all ratios (you can assign (a-Z, 0-9))
    • (ratios are deleted after the pause selected in the Ratio_Del_Cancel setting).
    • Ratio_Del_Cancel - time to cancel the Ratio_Del_key command (in seconds).
    • Button_Color color of text and button borders.
    • Button_Background_Color - buttons background color (if Button_Background_Color=clrNONE, the buttons background is the same as the graph background color).
    • Button_Pressed_Color - color of the text and border of the buttons when pressed.
    • Button FontSize - button font size.
    • Button_Font - the font of the buttons.
    • Line_Color - color of the ratio control line.
    • Line_Style - style of the ratio control line. 
    • Line_Width - the thickness of the ratio control line. 
    • Ratio_Lines_Color - the color of the lines ratio.
    • Ratio_Lines_Style - the style lines of the ratio.
    • Ratio_Lines_Width - the thickness of the lines ratio.
      レビュー 1
      krisnara123
      2114
      krisnara123 2022.02.02 08:36 
       

      What a nice product ! This tool really helps focus on risk reward. Winning trades are of little use if they dont fetch a good R Ratio .This tool projects all Reward Targets and there is open to configure the step size factor.A great trade planning and trade management tool.

      おすすめのプロダクト
      PZ Trade Pad EA
      PZ TRADING SLU
      4.27 (30)
      This simple visual expert advisor allows you to trade easily from the chart. It handles risk management for you and can perform several useful tasks with your existing trades, saving time and making risk-management for each individual trade easier.  [ Installation Guide | Update Guide | Troubleshooting | FAQ | All Products ] Trade easily from the chart Trade with precise risk management, hassle free Trade pending order with drag and drop price selection Set SL and TP levels with drag and drop pr
      FREE
      this EA draws vertical lines on the chart, either consecutive or alternating lines, depending on the input settings. Since vertical lines often represent time events, timing is important in trading. StartTime = D'2025.03.12 23:00';  // Starting point (time and date) NumberOfLines = 10;                    // Total number of lines to draw IntervalCandles = 1;                   // Interval in candles (must be > 0) IntervalMinutes = 30;                  // Interval in minutes (0 to disable) Directi
      FREE
      Free automatic Fibonacci is an indicator that automatically plots a Fibonacci retracement based on the number of bars you select on the BarsToScan setting in the indicator. The Fibonacci is automatically updated in real time as new highest and lowest values appears amongst the selected bars. You can select which level values to be displayed in the indicator settings. You can also select the color of the levels thus enabling the trader to be able to attach the indicator several times with differe
      FREE
      Every trader is watching over his account over and over.... trying to anlayse every system he or she has. With this tool you are able to  export your complete history of every account export withdrawls / deposits / rebates to a separate file export account status with balance / equity / current drawdown recalculate micro to standard lots / profits ...  export decimal by "." or ","  combine a series of Magic Numbers to one unique Magic Number   filter to ignore OrderComments.
      Round numbers (or key levels) is an amazing strategy. These numbers are strong support and resistance levels. So what this indicator does is draw horizontal lines on the chart to help you find these levels. Configurations: 1St level: Color - lines color. Style - lines style. Width -  lines width. 2Nd level: Second level lines? -  turn off second level lines. Color -  lines color. Style -  lines style. Width -  lines width. Space between lines in points -  I don't need explain :) Display at backg
      FREE
      Scalping One MT4 free バージョンです。 1ポジションを1つのボタンで表示します。リアルタイムで損益、  Lot、  Pointを表示。チャート通貨のみと全通貨ペアのポジションの表示を切り替え可能。(free版は3ポジションのみ) 日本語、英語に自動識別対応(設定タブは英語のみですが http://www.emkyuradias.shop/emkyuradias.shop/instruction.html にて日本語Helpを用意) 口座通貨表記はドル、ユーロ、ポンド、円に対応(自動識別) タイムラインの描画機能は、ローカルタイム(PC時間)、カレントタイム、東京、ニューヨーク、ロンドン、シドニー時間を選択可能な時計表示と連動可能、サマータイム対応。 ラウンドナンバー、日、週、月、年の安値、高値ライン表示、非表示がワンクリックで可能、高値安値は時間表示上のデータ表示部分にて個別に表示も可能です。
      FREE
      MT4用NAS100 Auto SL and TP Makerをご紹介します: MetaTrader4でナスダック100市場をナビゲートするトレーダーにとって不可欠なアシスタントであるNAS100オートSLおよびTPメーカーで、ストップロスおよびテイクプロフィットの設定をもう見逃すことはありません。このツールは、ストップロスとテイクプロフィットのレベル管理を自動化するシームレスなソリューションを求める方々のために設計されています。 主な特徴 簡単な自動化: ストップロスやテイクプロフィットのないナスダック100取引を自動的に監視します。 ユーザーが構成した設定に基づいてレベルを動的に調整します。 注文タイプの多様性: Nasdaq100の成行注文と未決済注文の両方に対応。 MetaTrader 4で利用可能な様々な注文タイプをサポートします。 カスタマイズされた設定: ユーザーフレンドリーなパラメータ設定により、トラッキング設定とストップロス/テイクプロフィットレベルのカスタマイズが可能です。 柔軟な範囲: 実行する特定のNAS100商品、または取引されるすべての商品に対してStop
      FREE
      このプロジェクトが好きなら、5つ星レビューを残してください。 このインジケータは、指定されたためのオープン、ハイ、ロー、クローズ価格を描画します 特定のタイムゾーンの期間と調整が可能です。 これらは、多くの機関や専門家によって見られた重要なレベルです トレーダーは、彼らがより多くのかもしれない場所を知るために有用であり、 アクティブ。 利用可能な期間は次のとおりです。 前の日。 前週。 前の月。 前の四半期。 前年。 または: 現在の日。 現在の週。 現在の月。 現在の四半期。 現年。
      FREE
      Free informative Indicator-helper. It'll be usefull for traders who trade many symbols or using grid systems (Averaging or Martingale). Indicator counts drawdown as percent and currency separate. It has a number of settings: Count deposite drawdown according equity value and send e-mail or notifications to user if DD more than set; Sending e-mail when max open orders reached; Shows price and remaining pips amount before MarginCall on current chart and Account generally; Display summary trade lot
      FREE
      MT4 の R 2EMA Color インジケーターは、2 つの EMA のクロスオーバーに基づく堅実な取引シグナルを提供します。 キーポイント 価格が 2 つの緑色の EMA を超えて閉じると、買いトレード シグナルが作成されます。 価格が 2 つの赤い EMA を超えて閉じると、売りトレード シグナルが作成されます。 R 2EMA Color Forex インジケーターにより、売買のタイミングをより簡単に判断できます 2 つの EMA ラインが緑色に変わると、買いシグナルが発生します。 2 つの EMA ラインが赤くなると、売りシグナルが発生します。 それと取引する方法は? 2 つの EMA シグナル ラインが赤色から緑色に変わるとすぐに買い取引を開始します。トレンドは現在ポジティブです。 2 つの EMA シグナル ラインが緑色から赤色に変わるとすぐに売りトレードを開始します。トレンドは現在ネガティブです。 チャート上で反対の取引シグナルが発生したら、取引を終了します。 R 2EMA Color インジケーターで取引を開始および終了するために、お好みの取引方法を自由に使用
      FREE
      Tipu Trader is a part of Tipu Panel ecosystem that was developed out of need for quick and simple trading. Tipu Trader is an easy to use trade panel for commonly used trade functions. Create you own signals with Tipu Panel and trade along with Tipu Trader, a simple and easy to use trade panel. Features An easy to use trade panel for most commonly used trade functions. Create your own personal trade signals with Tipu Panel , and trade with Tipu Trader. Customizable Panel. The panel can be moved
      FREE
      このユーティリティを使用すると、戦略テスターで戦略を手動でテストできます。視覚化チャート上でワンクリック取引。 このユーティリティの最新バージョンは、トレーダーが取引戦略を手動でテストするための高度な機能を提供します。ストラテジー テスターを使用すると、シミュレートされた環境で取引戦略の有効性を評価できるようになります。この機能を使用すると、取引テクニックのパフォーマンスを分析し、それらを改良して取引スキルを向上させることができます。 さらに、ストラテジー テスターは、視覚化チャート上でワンクリック取引で取引を実行する便利で効率的な方法を提供します。この機能により、異なる画面を切り替えることなく、希望の価格レベルで取引を迅速に開始および終了することができます。 ストラテジー テスターで利用できる完全な機能を使用すると、取引戦略をシミュレーションして洗練し、結果を分析して、取引スキルを効果的かつ効率的に最適化できます。 MT5 のバージョン 完全な説明 +DEMO +PDF 購入する方法 インストールする方法     ログファイルの取得方法     テストと最適化の方法     E
      FREE
      Activation initiates the sequence from the initial symbol in the Market Watch roster, forming a perpetual loop that continues until deactivation. The system employs global terminal variables to sustain operational continuity amid symbol-induced reinitializations, thereby ensuring uninterrupted performance. This EA should not be checked off as 'Allowed live Trading' and is functional with that checkmark box, when uploading the EA. Principal advantages encompass augmented productivity in overseein
      FREE
      Lot by Risk
      Sergey Vasilev
      4.83 (23)
      Lot by Risk tradingパネルは、手動取引用に設計されています。 これは、注文を送信するための代替手段です。 パネルの最初の特徴は、管理線を使用した注文の便利な配置です。 第二の特徴は、ストップロスラインの存在下で与えられたリスクのための取引量の計算です。 制御線はホットキーを使用して設定されます: 利益を取る-デフォルトではTキー; 価格-デフォルトではPキー; ストップロス-デフォルトでは、Sキー; 取引パネルの設定で自分でキーを設定できます。 操作のアルゴリズム: 1)-レベルを希望の場所に配置します(すべてのレベルを配置する必要はありません); 2)-リスクを指定します(オプション); 3)-緑の送信注文ボタンをクリックします; 4)-注文が行われるのを待っているか、エラーメッセージ付きのアラートが表示されます; 5)-マジックでExpert Advisorにリンクされている現在のシンボルのすべての注文を閉じる場合は、注文を閉じるボタンをクリックします。 注文を送信ボタンを何度も押すべきではありません。 一度で十分です。 注文後、ボタンは「
      FREE
      ボラティリティに適応し、取引ポジションに報酬を与えるための潜在的なリスクは、平均真の範囲に基づいて示されています。 "購入または売却"ボタンをクリックすると、リスク-報酬-ボックスが表示されます! ATR計算の有用性は、取引を終了するときのためのハードな決定の一部ではない問題で喜ぶ。 この問題は、あなたのリスク管理の決定を支援します。  仕様 平均真の範囲は、ピップまたは価格で市場のボラティリティを測定する一般的に使用される指標です。 真の範囲は、任意の期間におけるローソク足の最低取引価格と最高取引価格との差です。 平均真の範囲は、すべてで、日の"前の"期間のこれらの高値と安値を平均します。 例では、ATRインジケータのデフォルト設定は、私たちに14日間の期間を与えます。 ATRは、14日で割って、ピップ値で高値と安値を収集します。 しかし、もちろん、これは一般的な指標、ATRを超えています。 実際には、3つの全く異なるTPsは、異なるピップ消費のために独自の時間枠にのみ依存しています。 ローソク足のルールは、各時間枠で技術的に異なります。 したがって、同じ期間を使用すると、時間枠
      FREE
      ExpertLines
      Josemar Pinheiro
      1 (1)
      ExpertLines is a productivity expert to open orders by the breaking of the buy or sell lines, providing risk x reward and pips information on every trade. The expert can close the opened order by virtual lines of stop loss and take profit or by close buy or sell button. He also has a trailing stop resource if enabled. All this in a fast and easy way. Arm your trade with ExpertLines and have a good trade. Main Parameters Magic_Number - It is the magic number that the expert advisor uses to ident
      FREE
      This is a multi-timeframe version of the popular Hull Moving Average (HMA). The Double HMA MTF Light indicator combines two timeframes on a single chart. The HMA of the higher timeframe defines the trend, and the HMA of the current timeframe defines short-term price movements. The indicator is freely distributed and hasn't audio signals or messages. Its main function is the visualization of price movements. If you need advanced functionality of the HMA multi-timeframe indicator (information ab
      FREE
      As traders, we all know that risk management is the most important aspect of profitable trading. So, we need to determine the lot size, every time we need to open a new trade. The FX lot size calculator is a simple tool that will help you to determine your lot size easily without using any third-party service but you will be able to do that by your MetaTrader terminal. LIMITED TIME OFFER: 30$ FOR 10 ACTIVATION. Inputs: Maximum_Risk_Prc: To determine your preferred risk%. For example, if your ris
      FREE
      With Easy News, you can trade breakouts from a range at specific times. This is particularly lucrative for news and economic announcements because high risk/reward ratios are often present in these situations. This tool is suitable for all currencies and timeframes. It includes profit pyramiding. This means that when the first order is in profit by xx points (adjustable), another order is opened (depending on the set quantity). How does it work? At a specific time, the tool creates 2 stop orde
      FREE
      You can manually open a trade (one click), and this EA will take care of setting the SL and TP. SL and TP are set based on the number of pips you specify in the input screen. You can also choose monetary SL and TP. SL and TP are determined based on the weighted average price (WAP), so if you open a new trade, SL and TP will be updated according to the new WAP. The WAP is not unique but differentiated between buy and sell trades (this is useful only if you open opposite trades on the same chart)
      FREE
      This is a DEMO version of the Smarter Trade Manager Smarter Trade Manager  is an advanced trade management tool that can monitor and manage your manual and EA trades according to the settings you choose. It works as an Expert Advisor (EA), it does not open any trades but it closes trades as per the auto closing settings or when manually pressing any of the close buttons. FEATURES: Three-dimensional  interactive  view of your trades Trade Summary, P/L, Alerts, Closure by  Currency Trade Summary,
      FREE
      Rainbow MT4 is a technical indicator based on Moving average with period 34 and very easy to use. When price crosses above MA and MA changes color to green, it’s a signal to buy. When price crosses below MA and MA changes color to red, it’s a signal to sell. The Expert advisor ( Rainbow EA MT4) based on Rainbow MT4 indicator, as you can see in the short video below is now available here .
      FREE
      Fastest way to change the period. Suitable for traders who use many charts and timeframes. Size, shape and color can be customized. Inputs Parameters Corner — Choose corner placement Standart is "Right lower chart corner" Color — Background color of the button ColorText — Text color of the button ColorOn — Background color of the button for the current period ColorOnText — Text color of the button for the current period Font — Arial, Verdana... FontSize — Size of the font in pixels DistanceX —
      FREE
      When executing an order, whether through the Metatrader ticket on a computer or the Metatrader app on a mobile device, either manual or pending, Easy Trade will automatically set the take profit and stop loss levels, as well as a limit order with its respective take profit and stop loss levels. It follows the trading strategy for market open (US30, US100, US500), but it can be applied to any market asset.
      FREE
      Check out other great products from  https://www.mql5.com/en/users/augustinekamatu/seller   This indicator is the best so far at determining the currency strength of each pair. It provides stable values and is highly adaptive to market changes. It is a great tool to add to your arsenal to make sure you are on the right side of the trend at all times. No inputs required, it is simple plug and play. A Winning Trading Strategy This article describes the components and logic needed to develop a tra
      FREE
      DG Equity Monitor is a useful tool that keeps track of the daily transactions made on the account. The EA automatically and instantly closes all the trades running based on two conditions: 1. If the daily profit target is hit. 2. If the maximum drawdown is reached. An alert is sent immediately one of the above conditions are met. Parameters: Show Account Info -Choose whether or not to display the Account Info on the chart. Show Pop Up Alert -Show alert on chart when either condition 1 or 2 are
      FREE
      SX Theme Setter is intended for changing chart appearance in 2 modes: - Gradient background mode: In this mode, the indicator creates a gradient background for your chart. Colors, steps and gradient type can be selected by user. - Color theme: Color theme mode provides more than 50 built-in different color themes which can be selected from a list. Most of these themes are converted from official color themes of real trading platforms of the past and present. Try them out and see if they suit
      FREE
      Are you tired of drawing trendlines every time you're analyzing charts? Or perhaps you would like more consistency in your technical analysis. Then this is for you. This indicator will draw trend lines automatically when dropped on a chart. How it works Works similar to standard deviation channel found on mt4 and mt5. It has 2 parameters: 1. Starting Bar 2. Number of bars for calculation The   starting bar   is the bar which drawing of the trend lines will begin, while the   number of bars for c
      FREE
      This simple but useful script calculates the lot in % of the deposit. It is indispensable for risk management. There is only one customizable parameter: MaxRisk - risk in % for lot calculation. The product works as a standard script. Launch it once on an appropriate chart and start trading using the calculated lot value. Genious is simplicity! Happy trading!
      FREE
      Macd Martin
      Roman Yablonskiy
      2.5 (2)
      Double Breakout   is an automatic expert advisor with two separate strateges that uses martingale. The MACD indicator with adjustable parameters is used as inputs for each flow of orders. The specified takeprofit and stoploss levels are used to exit the position.  General recommendation The minimum recommended deposit is 1000 cents. Spread is recommended not more than 3 points. It is better to use trend currency pairs. The martingale parameter can be set from 0.1 to any value. When martingale i
      FREE
      このプロダクトを購入した人は以下も購入しています
      Trade Manager EAへようこそ。これは、取引をより直感的、正確、そして効率的にするために設計された究極の リスク管理ツール です。これは単なるオーダー実行ツールではなく、包括的な取引計画、ポジション管理、リスク管理のためのソリューションです。初心者から上級者、迅速な実行を必要とするスキャルパーまで、Trade Manager EAはあらゆるニーズに対応し、為替、指数、商品、暗号通貨などさまざまな市場で柔軟に対応します。 Trade Manager EAを使用すると、複雑な計算が過去のものになります。市場を分析し、エントリーポイント、ストップロス、テイクプロフィットのレベルをチャート上のラインでマークし、リスクを設定するだけで、Trade Managerが最適なポジションサイズを即座に計算し、SLとTPをピップ、ポイント、口座通貨でリアルタイムに表示します。すべての取引が簡単かつ効果的に管理されます。 主な機能: ポジションサイズ計算機 :定義されたリスクに基づいて取引サイズを瞬時に決定します。 簡単な取引計画 :エントリー、ストップロス、テイクプロフィットを設定するためのド
      The product will copy all telegram signal to MT4   ( which you are member  ) , also it can work as remote copier.  Easy to set up, copy order instant, can work with almost signal formats, image signal, s upport to translate other language to English Work with all type of channel or group, even channel have "Restrict Saving Content", work with  multi channel, multi MT5 Work as remote copier: with signal have ticket number, it will copy exactly via ticket number. Support to backtest signal. How to
      Copy Cat More Trade Copier MT4 (コピー猫MT4) は単なるローカル取引コピーツールではなく、現代の取引課題に対応するために設計された完全なリスク管理と実行フレームワークです。Propファームのチャレンジから個人の資産管理まで、強力な実行力、資金保護、柔軟な設定、高度な取引処理を組み合わせ、あらゆる状況に適応します。 このコピーツールは Master(送信側) と Slave(受信側) の両モードで動作し、成行注文や指値注文のリアルタイム同期、取引修正、部分決済、Close By 操作をサポートします。デモ口座・リアル口座の両方に対応し、取引用パスワードまたは投資家パスワードでも利用可能です。Persistent Trade Memory 技術により、EA・ターミナル・VPS が再起動しても復元可能です。複数の Master と Slave を同時に管理でき、ブローカー間の違いはプレフィックス/サフィックスの自動調整やシンボルマッピングで処理されます。 マニュアル/設定: Copy Cat Trading Copier マニュアル Copy Cat Mo
      Crystal Trade Manager PRO – MT4向け 高度リスク管理・トレードコントロールシステム 無料版: https://www.mql5.com/en/market/product/150632 概要 Crystal Trade Manager PRO(CTM)は、MetaTrader 4 のために設計された、プロフェッショナル向けのリスク管理および取引管理ユーティリティです。 厳密な執行、強力な資金保護、高度な自動化を必要とするトレーダーのために構築されています。 本システムは、リスク管理、エクイティ保護、日次制限、SL/TP の自動設定を行い、プロレベルの高速ワンクリック取引パネルを提供します。 Prop Firm チャレンジ、デイトレード、スキャルピング、資金運用者に最適です。 MT5版も利用可能です。 主な特徴 1. 高度なリスク・ドローダウン保護 日次ドローダウン上限を 1%〜70% の範囲で設定可能。 上限超過時、 全てのポジションを即時クローズ 。 オプションで 全ての保留注文(Pending Orders)を自動削除 。 日次ロックアウトモード:翌日
      Exp COPYLOT CLIENT for MT4
      Vladislav Andruschenko
      4.65 (66)
      MetaTrader4のコピー機を取引します。     それは任意の口座からの外国為替取引、ポジション、注文をコピーします。 それは最高の貿易コピー機の1つです     MT4 - MT4、MT5 - MT4     のために     COPYLOT MT4     バージョン(または     MT4 - MT5  MT5 - MT5     のために     COPYLOT MT5     バージョン)。 MT5のバージョン 完全な説明   +DEMO +PDF 購入する方法 インストールする方法     ログファイルの取得方法     テストと最適化の方法     Expforex のすべての製品 のコピー機 バージョン       MetaTrader 5 ターミナル(   МТ5 - МТ5、МТ4 - МТ5   )-   コピーロットクライアントMT5 独自のコピーアルゴリズムにより、すべての取引がマスターアカウントからクライアントアカウントに正確にコピーされます。 また、動作速度が速いことでも知られています。タフなエラー処理。 強力な機能セット。 プログラムは、複数
      One tool to protect all your EAs — news filter, equity protection, time filter and more — free demo available Take a Break has evolved from a basic news filter into a comprehensive account protection solution. It pauses your other Expert Advisors during news events or based on custom filters. When trading resumes, it automatically restores your entire chart setup , including all EA settings. Typical use cases: One news filter for all your EAs. Pause trading during news or high volatility — and c
      TradePanel MT4
      Alfiya Fazylova
      4.85 (92)
      Trade Panelは多機能なトレーディングアシスタントです。アプリには手動取引用の50以上のトレーディング機能が搭載されており、ほとんどの取引作業を自動化することができます。 役立つリンク: デモ口座用のアプリケーションの試用版 アプリケーションの取扱説明書 取引。 ワンクリックで取引操作を行うことができます: リスクを自動計算して指値注文やポジションを開く。 複数の注文やポジションをワンクリックで開く。 注文のグリッドを開く。 保留中の注文やポジションをグループごとに閉じる。 ポジションの方向を反転(Buyを閉じてSellを開く、またはSellを閉じてBuyを開く)。 ポジションをブロックする(不足している量のポジションを開くことでBuyとSellのポジション量を等しくする)。 すべてのポジションを部分的にワンクリックで閉じる。 すべてのポジションの利食い(Take Profit)および損切り(Stop Loss)を同じ価格レベルに設定する。 すべてのポジションの損切りを建値(ブレークイーブン)レベルに設定する。 注文およびポジションを開く際には、次の機能を使用できます: 複数の
      日ごとおよび週ごとのクローズ取引履歴、現在のオープン取引、および外国為替エクスポージャーを 1 つのチャートで即座に確認できます。ヒートマップを使用して、収益性の高い取引と、取引ポートフォリオ内の現在のドローダウンの位置を特定します。 クイック クローズ ボタン クイック クローズ ボタンを使用すると、1 つのシンボルのすべての取引をクローズしたり、個々の取引を完全にクローズしたり、ボタンをクリックするだけで部分的な利益または損失を取得したりできます。リストで取引を探したり、取引の一部をクローズする方法を考えたりする必要はもうありません。ダッシュボードには、外国為替ペアの取引中に各通貨シンボルの現在のエクスポージャーも表示されるため、主要なニュース イベントの前にエクスポージャーが過剰になっている可能性のある領域を特定するのに役立ちます。ボタンを使用して、ニュースの前にエクスポージャーを即座にすばやく減らすことができます。または、ニュースがすでに発生して利益が出ている場合は、1 回のクリックでその利益をすばやく銀行に預けることができます。 オープン取引ヒートマップ 取引ヒートマッ
      News Filter EA: Advanced Algo Trading Assistant News Filter EA is an advanced algo trading assistant designed to enhance your trading experience. By using the   News Filter EA , you can integrate a Forex economic news filter into your existing expert advisor, even if you do not have access to its source code. In addition to the news filter, you can also specify   trading days   and   hours   for your expert. The News Filter EA also includes   risk management   and   equity protection   features
      MT4 to Telegram Signal Provider は使いやすく、完全にカスタマイズ可能なツールで、Telegramに信号を送信し、あなたのアカウントを信号提供者に変えることができます。 メッセージのフォーマットは 完全にカスタマイズ可能です! しかし、簡単な使用のために、あらかじめ定義されたテンプレートを選択し、メッセージの特定の部分を有効または無効にすることもできます。 [ デモ ]   [ マニュアル ] [ MT5バージョン ] [ Discordバージョン ] [ Telegramチャンネル ]  New: [ Telegram To MT5 ] セットアップ ステップバイステップの ユーザーガイド が利用可能です。 Telegram APIの知識は必要ありません。開発者が必要なものをすべて提供します。 主要機能 購読者に送信される注文の詳細をカスタマイズする機能 例えばブロンズ、シルバー、ゴールドなど、階層型のサブスクリプションモデルを作成できます。ゴールドサブスクリプションでは、すべての信号が得られますなど。 ID、シンボル、またはコメントによる注文のフ
      Ultimate MT4 to Telegram (UMT) sends controlled trades (via symbol, magic, comment) to your telegram channel. It sends open and closed trades, including pending orders and TP/SL modifications, along with chart screenshots, to any telegram channel. Additionally, you can send trade reports of open trades and summary profit/pip reports for day, week, or month. You can customize the design of the trade actions or reports with variables and emoticons.  A beautiful panel allows you to visualize all t
      What is it? Think about it, you can send all the orders/positions info to your telegram channel or group to create your community or VIP signals on telegram. Position info means this EA forward all of your new positions open details (Open price, Open time, Position Type, position Symbol and volume), positions changes ( SL or TP modifying or pending price changes) and position close (Close price, profit or loss, position duration time) and also EA Send NEWS alert (Economic calendar event) on you
      Rocket FX Trading Manager PRO Note: Once you download the manager, message me for the background files The Ultimate All-in-One Trade Management Solution for MetaTrader 4 Version:   4.5 |   Platform:   MetaTrader 4 |   Category:   Utility / Trade Manager   Overview Rocket Fx Trading Manager v4.5 is a comprehensive, all-in-one trade management system designed to transform your trading experience. This powerful utility combines   intelligent position sizing ,   multi-target order placement
      VirtualTradePad mt4 Extra
      Vladislav Andruschenko
      4.86 (59)
      ワンクリックで取引できるトレーディングパネル。ポジションと注文の操作!チャートまたはキーボードから取引。 手動取引用の取引パネル。チャート(チャートウィンドウ)またはキーボードから取引できます。開閉、リバース、ロックポジションと注文を処理する МetaТrader4のメインオーダーのトレーディングコントロールパネル:売買、売却、売却、売却、売却、閉じる、削除、修正、トレーリングストップ、ストップロス、takeproft MT5のバージョン 完全な説明   +DEMO +PDF 購入する方法 インストールする方法     ログファイルの取得方法     テストと最適化の方法     Expforex のすべての製品 シンボルウィンドウからの取引とキーボードからの取引! あなたはMetaTrader 4ターミナル - バーチャルコントロールパネルVirtualTradePadのためのユニークなプラグインを持っています。 Description on English 注意!  ストラテジーテスターの 取引方法を学びたい場合は、無料の TesterPad ユーティリティをチェックしてくだ
      DrawDown Limiter MT4
      Haidar Lionel Haj Ali
      5 (8)
      Drawdown Limiter EA You are in the right place if you were searching for Drawdown control, Drawdown limiter, Balance protection, Equity Protection or Daily Drawdown Limit related to Prop Firm, FTMO, or Funded account trading, or if you want to protect your trading account. Have you suffered from controlling your drawdown when trading funded accounts? This EA is meant for you. Prop firms usually set a rule called “Trader Daily Drawdown”, and if it is not respected, you are disqualified.  I am an
      The utility copies trades from the signal provider accounts (master accounts, one or multiple providers) to unlimited number of receiver accounts (slave accounts).  Attention! Y ou need to use identifiers (Provider number) of the same length if you use several master copiers. For example. 1, 2, 3 or 11, 13, 22. The copying can be set in the opposite direction. The comments with all the recently performed actions are displayed on the screen to monitor the utility actions in slave mode. To avoid p
      Comprehensive on chart trade panel with the unique ability to be controllable from mobile as well. Plus has a library of downloadable configuration, e.g. exit rules, extra panel buttons, pending order setup and more. Please see our product video. Works with all symbols not just currency pairs. Features On chart panel plus controllable from free app for Windows, iPhone and Android Built-in script engine with library of downloadable configuration, e.g. add 'Close All Trades in Profit' button, exit
      Custom Alerts:複数市場を監視し、重要なチャンスを見逃さない 概要 Custom Alerts は、複数の銘柄にまたがるトレードチャンスを一元的に監視したいトレーダーのためのダイナミックなソリューションです。FX Power、FX Volume、FX Dynamic、FX Levels、IX Power などの主要ツールと連携し、複数のチャートを切り替える手間なく、重要な市場変動を自動で通知します。ブローカーが提供するすべての資産クラスに対応しており、シンボルを入力する必要はありません。設定で資産クラスを選択するだけで、すぐにアラートを構成できます。 1. Custom Alerts がトレーダーにとって非常に有益な理由 オールインワンの市場監視 • Custom Alerts は、為替、金属、暗号資産、指数、株式(ブローカーが対応している場合)からのシグナルを収集・統合します。 • 複数のチャートを切り替える必要がなくなり、明確で一元化された通知が得られます。 戦略に合わせたアラート構成 • ボリューム急増、通貨強弱の閾値、極端な価格変動など、目的に応じたアラート
      トレーディングスペシャル – 40%オフ Advanced Trade Manager – より速く、よりスマートに、より安全に手動取引を行うための究極のオールインワンソリューション。 NextGen Trade Manager AIで手動取引を変革しましょう。これは、即時執行、視覚的な取引プランニング、そして強力なリスク管理を1つの直感的なツールに統合した、プロフェッショナルなオンチャートパネルです。チャートを離れることなく、注文執行、リスク管理、そして利益確保をかつてないほど迅速に行うことができます。取引の精度と効率性を高めたいすべてのトレーダーに最適です。 MT4ストラテジーテスターでリスクなしでテスト デモ版をダウンロードして、ペーパートレード機能をご利用ください。本番運用前に、安全なシミュレーション環境で執行の練習、リスク管理ルールのテスト、そして戦略の改良を行うのに最適な方法です。 完全なユーザーマニュアルとステップバイステップガイドについては、 https://www.mql5.com/en/blogs/post/764217 をご覧ください。 主なメリット:
      コピー機->便利で高速なインターフェースインタラクション、ユーザーはすぐに使用できます     ->>>> WindowsコンピュータまたはVPS Windowsでの使用を推奨 特徴: 多様でパーソナライズされたコピー取引設定:1. 異なるシグナルソースに異なるロットモードを設定できます。2. フォワードコピー取引とリバースコピー取引に異なるシグナルソースを設定できます。3. シグナルはコメントで設定できます。4. 契約ロットに応じてロットを調整するかどうか 多様でパーソナライズされたコピー注文設定2:1.品種ごとに異なるロットモードを設定できます2.順方向コピー注文と逆方向コピー注文に異なる品種を設定できます3.コメントでシグナルを設定できます4.契約ロットに応じてロットを調整するかどうか コメントフィルタリング、MAGICフィルタリング、シグナルロットフィルタリング、ローカル製品フィルタリング 勤務時間設定 逆同期SLAVE終了 注文バインド機能: 任意の注文を設定されたシグナルソース注文にバインドできます (テーブルをダブルクリックして編集します) アカウントリスク管理 基本
      これは視覚的な取引パネルであり、取引を簡単に配置および管理し、人為的エラーを回避し、取引活動を強化するのに役立ちます。使いやすい視覚的なインターフェースと、健全なリスクおよび位置管理アプローチを組み合わせています。 [ インストールガイド | 更新ガイド | トラブルシューティング | よくある質問 | すべての製品 ] 驚くほど使いやすい チャートから簡単に取引 正確なリスク管理との取引、手間のかからない 資本の保存が最優先事項です 気をつけずに利益を上げましょう できるだけ早くリスクのない取引をお楽しみください 開かれているすべての取引の自動トレーリングストップ 最初のストップロスは、取引が行われるとすぐに配置されます EAは、取引を行った後に次のタスクを実行します。 最初のストップロス/テイクプロフィットは自動的に配置されます できるだけ早くフリーライドにロックします(オプション) ストップロスを初めて損益分岐点に移動します(オプション) 停止するまで、希望の方法を使用してストップロスを追跡します その他のクールな機能は次のとおりです。 優れたターミナルアクティビティレポート
      TelegramからMT4へ: 究極のシグナルコピーソリューション Telegram to MT4 は、DLLを必要とせず、TelegramのチャンネルやチャットからMetaTrader 4プラットフォームに取引シグナルを直接コピーできる最先端のユーティリティです。この堅牢なソリューションは、比類のない精度とカスタマイズオプションにより、シグナルのシームレスな実行を保証し、時間を節約し、効率性を向上させます。 [ Instructions and DEMO ] 主な特徴 直接的なTelegram API統合 電話番号とセキュアコードで認証します。 ユーザーフレンドリーな EXE ブリッジを使用して、チャット ID を簡単に取得および管理します。 複数のチャネル/チャットを追加、削除、更新して、同時に信号をコピーします。 高度なフィルターによる信号解析 カスタム例外語 (例: 「レポート」、「概要」) を含む不要な信号をスキップします。 柔軟な SL および TP 形式 (価格、ピップ、ポイント) をサポートします。 シグナルが価格ではなくポイントを指定する場合、エントリ ポイントを自動
      Trade Manager は、リスクを自動的に計算しながら、取引を迅速に開始および終了するのに役立ちます。 過剰取引、復讐取引、感情的な取引を防止する機能が含まれています。 取引は自動的に管理され、アカウントのパフォーマンス指標はグラフで視覚化できます。 これらの機能により、このパネルはすべてのマニュアル トレーダーにとって理想的なものとなり、MetaTrader 4 プラットフォームの強化に役立ちます。多言語サポート。 MT5バージョン  |  ユーザーガイド + デモ Trade Manager はストラテジー テスターでは機能しません。 デモについてはユーザーガイドをご覧ください。 危機管理 % または $ に基づくリスクの自動調整 固定ロットサイズを使用するか、ボリュームとピップに基づいた自動ロットサイズ計算を使用するオプション RR、Pips、または価格を使用した損益分岐点ストップロス設定 トレーリングストップロス設定 目標に達したときにすべての取引を自動的に終了するための 1 日あたりの最大損失 (%)。 過度のドローダウンからアカウントを保護し、オーバートレードを防ぎま
      MT4 to Discord Signal Provider は、Discord へ直接トレーディングシグナルを送信するために設計された、使いやすく完全にカスタマイズ可能なユーティリティです。このツールは、あなたのトレーディングアカウントを効率的なシグナルプロバイダーに変えます。 スタイルに合わせてメッセージフォーマットをカスタマイズ!利便性を考え、事前にデザインされたテンプレートから選択し、メッセージのどの要素を含めるか除外するかを選択できます。 [ デモ ] [ マニュアル ] [ MT5 バージョン ] [ Telegram バージョン ]  New: [ Telegram To MT5 ] セットアップ 簡単なセットアップのために、私たちの詳細な ユーザーガイド に従ってください。 Discord API の事前知識は必要ありません。必要なツールはすべて提供されます。 主な特徴 購読者の更新のための注文詳細をカスタマイズ。 ブロンズ、シルバー、ゴールドなど、各レベルで異なるシグナルアクセスを提供する階層的サブスクリプションモデルを実装。 注文が実行されたチャートのスクリーン
      Smart Channel M4
      Vahidreza Heidar Gholami
      The trend in the market can be predicted using trend lines but the problem is you don’t know where exactly the price is going to touch the trend line where you can put your pending orders on. Smart Channel Expert Advisor makes it possible to put an advanced channel around the price data, which can be configured to handle placing orders, opening and closing positions, managing risk per trade, spread, slippage, and trailing stop-loss and take-profit automatically. Features Money Management (Calcul
      Ultimate No Nonsense FX Backtester - You can Run Forward Test Simulation with this tool! Do Not Download the Demo Here, Please Read Below! Step by Step Manual Guide PDF for this backtester PDF List of Commands(Shortcuts) for this backtester Ultimate NNFX Backtester is a powerful utility tool that significantly reduces the length of backtesting process for NNFX followers.  As well as for Forex traders that operates their entries and exits at the close of a candle and manage the risk using ATR.
      Riskless Pyramid
      Snapdragon Systems Ltd
      5 (1)
      Introduction This powerful MT4 trade mangement EA offers a way potentially to aggressively multiply trade profits in a riskfree manner. Once a trade has been entered with a defined stoploss and take profit target then the EA will add three pyramid add-on trades in order to increase the overall level of profit. The user sets the total combined profit target to be gained if everything works out. This can be specified either as a multiple of the original trade profit or as a total dollar amount. Fo
      MetaQuant PRO is a professional account analytics dashboard for MetaTrader 4, built to give traders a clear, visual, and data-driven view of their trading performance directly inside MT4. It converts your account history into clean metrics, charts, and insights without relying on external websites or spreadsheets. Main features • Overview (full account) • Daily (today only) • Monthly (current month) • All-Time (entire history) Visual performance analysis • Smooth equity curve from real closed t
      Custom Alerts AIO:マルチマーケット監視を一括で実現 — 設定不要ですぐに使えるインテリジェントツール 概要 Custom Alerts AIO は、追加のインジケーター設定が不要で、インストール後すぐに利用できる高機能マーケットスキャナーです。FX Power、FX Volume、FX Dynamic、FX Levels、IX Power を内部にすべて統合し、主要なすべての資産クラス(為替、金属、指数、暗号資産)を一括監視できます。MetaTrader の仕様により、株式は個別のシンボルとして追加可能ですが、一般的には利用頻度は低めです。 1. なぜ Custom Alerts AIO を選ぶべきか 追加ライセンス不要 • 必要なすべての Stein Investments インジケーターが内蔵されており、すぐに使用可能です。 • チャートに表示されるグラフィックは省略されており、アラート生成に特化した構成です。 市場を広範囲にカバー • 為替、金属、暗号資産、株価指数に対応(株式は手動追加可能)。 • シンボル名を入力する必要はなく、プロパティで資産クラス
      News Loader Pro is a tool that automatically updates every economic news in real time with detailed information from several online data sources. It uses the unique technology to load data with full details from popular Forex websites. An alert will be sent to your mobile/email before an upcoming news release. Moreover, it also marks the news release points on the chart for further review and research. In Forex trading, news is one of the important factors that move the market. Sticking with new
      作者のその他のプロダクト
      The indicator is a trading system for short-term trading. Scalper Assistant helps to determine the direction of the transaction, and also shows the entry and exit points. The indicator draws two lines (possible points for opening positions). At the moment of the breakdown of the upper line up (and when all trading conditions are met), an up arrow appears (a buy signal), as well as 2 goals. At the moment of the breakdown of the lower line down (and when all trading conditions are met), a down ar
      The indicator defines a trading corridor, a flat market, and corrections. Allows you to compare the significance of different flat and trend areas (by time of existence and by volatility). This makes it possible to assess the market cycle and its mood at a glance. That is, how long does the flat last on average, and how long is the trend and what kind of volatility they have in points. As a rule, the longer the flat lasts, the more likely it is to accumulate the potential for a strong movem
      The indicator shows the market turning points (entry points). Reversals allow you to track rebound/breakout/testing from the reverse side of the lines of graphical analysis or indicators. Reversals can be an independent signal. The indicator allows you to determine reversals taking into account the trend and without it. You can choose a different period for the movement preceding the reversal, as well as the volatility coefficient. When plotting reversals, the indicator takes into account volati
      Measures the length of the selected movement in points, shows the duration of the movement, as well as the speed of movement.   Outputs the average value of each dimension. It is designed to calculate the expected target based on typical market movements. The intended goal will provide information about the ratio of the stop size to the possible profit and will allow you not to open positions with a small expected profit. It will also help you determine the point at which it is more logical to c
      The indicator allows you to quickly switch from one instrument to another, from one time period to another using the keyboard or buttons on the monitor. Each command can be assigned a hot key from 0-9, a-Z (case-insensitive) and VK_OEM_COMMA ("<" on the keyboard) and VK_OEM_PERIOD (">" on the keyboard). This can help you to operate the maximum number of instruments that are available at your broker, analyze more instruments/periods in less time. This product cannot be tested in the tester , beca
      The script displays info about the share's corporate reports and dividends. The data is downloaded from   investing.com : Report date Profit per share (EPS) Revenue Market capitalization Amount of dividends Date of payment of dividends Dividend income The product cannot be tested in the tester (since it is not possible to receive data from the Internet). Before launching:  Add 2   URL   https://ru.investing.com/earnings-calendar/Service/getCalendarFilteredData  and   https://ru.investing.com/di
      The Envelopes indicator determines the presence of a trend or flat. It has 3 types of signals, shows the probable retracement levels and levels of the possible targets. The Fibonacci coefficients are used in the indicator's calculations. Signals (generated when touching the lines or rebounding from lines): Trend - the middle line of the Envelopes has a distinct inclination; the lines below the channel's middle line are used for buy trades, the lines above the middle line and the middle line itse
      The indicator shows and highlights the chart candles, which are formed as a result of large players entering the market in large volumes. Such candles can also be formed after achieving a certainty on the market, when most of the participants hold positions in the same direction. The movement is likely to continue in that direction after such candles. The indicator highlights the significant candles from the existing ones on the chart; The indicator allows identifying the trends based on candles
      The indicator identifies the most suitable moment for entering the market in terms of market volatility, when the market has the strength to move (the signal is indicated by an arrow under the candle). For each of the signals, the presence of trends on the current and higher timeframes is determined, so that the signal is in the direction of the majority of positions opened on the market (denoted near the signal by abbreviations of timeframes with a trend present). The signal appears after the c
      The indicator displays the key support and resistance levels on the chart. The significance of these levels lies in that the price may reverse or strengthen the movement when passing such levels, since they are formed as a consequence of the natural reaction of market participants to the price movement, depending on which positions they occupied or did not have time to occupy. The psychology of the level occurrence: there always those who bought, sold, hesitated to enter or exited early. If the
      This indicator is a multitimeframe trading strategy. It has the levels for stop loss, take profit and entry point. The order level can also be set manually. The indicator uses the regularity of the market, which manifests itself on all instruments, and does not require adjustment of the parameters. The strategy uses a proprietary approach to determining: trend, volatility, hierarchy of timeframe significance, the size of the history period (the number of candles), which is important for making a
      Trend Sync
      Pavel Verveyko
      5 (1)
      The indicator shows the trend of 3 timeframes: higher timeframe; medium timeframe; smaller (current) timeframe, where the indicator is running. The indicator should be launched on a chart with a timeframe smaller than the higher and medium ones. The idea is to use the trend strength when opening positions. Combination of 3 timeframes (smaller, medium, higher) allows the trend to be followed at all levels of the instrument. The higher timeframes are used for calculations. Therefore, sudden change
      The indicator detects important peaks and troughs (extremes) on the chart. These points can be used to plot support/resistance levels and trend lines, as well as any other graphical analysis. These points can serve as reference points for setting trading orders. The indicator does not redraw . Settings: Size_History  - the size of the calculated history. Num_Candles_Right  - number of candles to the right of the peak or trough. Num_Candles_Left  - number of candles to the left of the peak or
      The indicator draws support and resistance lines on an important part of the chart for making decisions. After the trend line appears, you can trade for a breakout or rebound from it, as well as place orders near it. Outdated trend lines are deleted automatically. Thus, we always deal with the most up-to-date lines. The indicator is not redrawn . Settings: Size_History  - the size of the calculated history. Num_Candles_extremum  - the number of candles on each side of the extremum. Type_Arrow
      The indicator shows key volumes confirmed by the price movement. The indicator allows you to analyze volumes in the direction, frequency of occurrence, and their value. There are 2 modes of operation: taking into account the trend and not taking into account the trend (if the parameter Period_Trend = 0, then the trend is not taken into account; if the parameter Period_Trend is greater than zero, then the trend is taken into account in volumes). The indicator does not redraw . Settings History_S
      This trading system is based on market impulses of varying complexity.   To generate a signal, the indicator uses the moments when the direction of the pulse and the necessary section of the trend coincide. The indicator also takes into account the current market volatility. Stop_loss tags can be set with the parameter "0" or "1", then Stop_Loss will take into account market volatility.   Take_Profit tags can be set with the parameter "0", then Take_Profit will take into account market volatil
      The stocks that make up the index are one of the drivers of the movement. Analyzing the financial performance of all elements of the index, we can assume further development of the situation. The program (script) displays corporate reports of shares that are part of the index selected in the settings.   "Indexes" cannot be tested in the tester (since there is no way to get information from the Internet). Information is downloaded from the site investing.com: Report Date Earnings per share (E
      The indicator builds a graphical analysis based on the Fibonacci theory. Fibo Fan is used for the analysis of the impulses and corrections of the movement. Reversal lines (2 lines at the base of the Fibonacci fan) are used to analyze the direction of movements. The indicator displays the of 4 the target line in each direction. The indicator takes into account market volatility. If the price is above the reversal lines, it makes sense to consider buying, if lower, then selling. You can open posi
      The indicator determines the state of the market: trend or flat. The state of the market is determined by taking into account volatility. The flat (trading corridor)is displayed in yellow. The green color shows the upward trend. The red color shows the downward trend. The height of the label corresponds to the volatility in the market. The indicator does not redraw . Settings History_Size   - the amount of history for calculation. Period_Candles  - the number of candles to calculate the indicat
      The indicator plots flexible support and resistance levels (dots). A special phase of movement is used for construction. Levels are formed dynamically, that is, each new candle can continue the level or complete it. The level can provide resistance or support to the price even where it is no longer there. Also, support and resistance levels can change roles. The importance of levels is affected by: the amount of time the level is formed and the number of touches. The significance of these lev
      The trading system is designed to work with gold on time periods: 30M, 1H. The indicator allows you to adjust to the market situation. Parameters for 1H :   PERIOD=9F ,   FILTER=300 .   Parameters for  30M :   PERIOD=22B ,   FILTER=450 .   A small adjustment to a specific broker is allowed .   If you change the amount of history displayed, you may also need to adjust the parameters. The indicator is not redrawn.     "Gold n XAU" uses different rules for entering a trade and different rules fo
      The indicator builds "psychological levels": levels of round numbers and intermediate levels of round numbers. Round numbers play an important role in forming support and resistance levels. There is a pattern in which the decline or growth of the price can stop at round numbers. The level whose price ends at 0 is the level of a round number of the first order. Intermediate level, this is the level between two round levels, for example, between 10 and 20 this is level 15. In the " Num_Zeros "
      Ichimoku Map (instant look at the markets) - built on the basis of the legendary Ichimoku Kinko Hyo indicator. The task of the Ichimoku Map is to provide information about the market strength on the selected time periods and instruments, from the point of view of the Ichimoku indicator. The indicator displays 7 degrees of buy signal strength and 7 degrees of sell signal strength. The stronger the trend, the brighter the signal rectangle in the table. The table can be dragged with the mouse. The
      The indicator displays a stock chart of a non-standard type, in which the price and time have the same value. The usual chart of Japanese candlesticks does not take into account all the information that the time analysis can give. Renko charts do not use all the information that price can give in relation to time. The "Chart Price and Time" indicator takes into account price and time equally and shows the predominance of price or time. Taking into account price and time equally gives an idea
      The indicator tracks sharp volatility (moments when the market has shown increased activity and movement may occur), on the selected instruments and time periods. The information is displayed as colored rectangles. Thus, it is possible to assess at a glance which tool should be given priority attention. The indicator will be useful for scalpers when they need a quick reaction or for traders working with a large number of instruments. The indicator does not redraw. The indicator displays 8 degree
      The Alert Creator indicator is designed to create alerts for selected conditions. You can select one or several indicators for the notification. If several conditions are selected, the alert is triggered when all the selected conditions are met. The signals can be configured separately for buying and separately for selling. Example, a buy alert: the closing price is above the moving average, the RSI is below 20. (In this example, 2 indicators are used to generate an alert: MA and RSI) At the
      The indicator determines the strength of the trend and its possible reversal points, based on the author's arithmetic approach . Each new peak or trough is a trend development. Such peaks and troughs are numbered so that the strength of the trend development can be seen. Attempts to change the trend are also numbered. This gives an understanding of a possible change in the direction of the trend. Indicator signals are generated when trying to change the trend . In the settings, it is possible
      The indicator draws potential levels that may become significant support and resistance levels in the future. The longer the line, the higher the probability of a price reversal or an increase in price movement after the breakdown of this level. With a decrease in the probability of the formation of a level, the length of the line is reduced. The indicator does not require adjustment. In the settings, you can change the design of the indicator. The "L ine_Length " button is placed on the ch
      The indicator is a trading system for AUDUSD or NZDUSD currency pairs. The indicator was developed for time periods: M15, M30. At the same time, it is possible to use it on other tools and time periods after testing. "Kangaroo Forex" helps to determine the direction of the transaction, shows entry points and has an alert system. When the price moves in the direction of the transaction, the maximum length of the movement in points is displayed. The indicator does not redraw, all actions occur a
      The indicator implements the author's approach to the construction of the popular "Zig-Zag" indicator. The advantages of the "ZIgZag Level" indicator is that it filters out market noise and shows levels. "ZIg Zag Level" is based on peaks and troughs, displays levels. These levels can be disabled and configured. The indicator displays the price of the level, the price tag can be disabled. The "zigzag" line between the points can also be disabled. The indicator has a built-in notification s
      フィルタ:
      krisnara123
      2114
      krisnara123 2022.02.02 08:36 
       

      What a nice product ! This tool really helps focus on risk reward. Winning trades are of little use if they dont fetch a good R Ratio .This tool projects all Reward Targets and there is open to configure the step size factor.A great trade planning and trade management tool.

      レビューに返信