AI Supply and Demand Zones Indicator
- インディケータ
- バージョン: 1.0

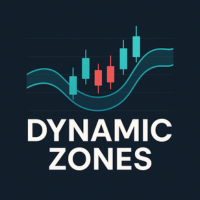
Automatic supply and demand zones built from real base-and-departure price action.
How it works
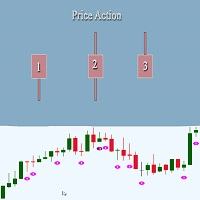
The indicator looks for a base of one to three small candles (body below a set share of ATR) followed by a strong departure candle (body above a larger ATR multiple) that closes beyond the base. A bullish departure creates a demand zone around the base, and a bearish departure creates a supply zone.
Each zone is then tracked candle by candle. A fresh zone has not been revisited. When price comes back into it for the first time, it becomes tested and is drawn in a lighter color. When a candle closes through the far side of the zone, it counts as broken and is removed from the chart.
Key features
- Base-and-departure detection on closed candles only
- Fresh, tested and broken zone states with separate colors
- Zones extend to the right of the current price
- Maximum number of zones per side to keep the chart clean
- Optional higher timeframe source, for example H4 zones on an M15 chart
- Optional "Supply" / "Demand" labels and price tooltips
- First retest arrows (when the source timeframe equals the chart timeframe)
- Alerts on new zones and first retests
Recommended
Any symbol. H1 and H4 zones are popular for swing trading, and M15 zones for intraday trading.
Inputs
Source timeframe, ATR period, maximum base candles, base and departure size in ATR, maximum zones per side, max bars to calculate, zone colors for each state, labels, retest arrows, zone extension and alert options.
Note
Zones are built only from closed candles of the source timeframe, so a zone never appears and then disappears because of an unfinished candle. Zones are removed only when price closes through them.