AURUM Move Origin XAUUSD

  • インディケータ
  • Pieter Van Aswegen
    Pieter Van Aswegen
    I am an investment risk professional with over 15 years of experience in global financial markets, specialising in risk management, portfolio analytics, and systematic trading oversight. My work has focused on developing quantitative models, stress testing, and governance frameworks to strengthen
  • バージョン: 2.42
  • アクティベーション: 20

AURUM Move Origin

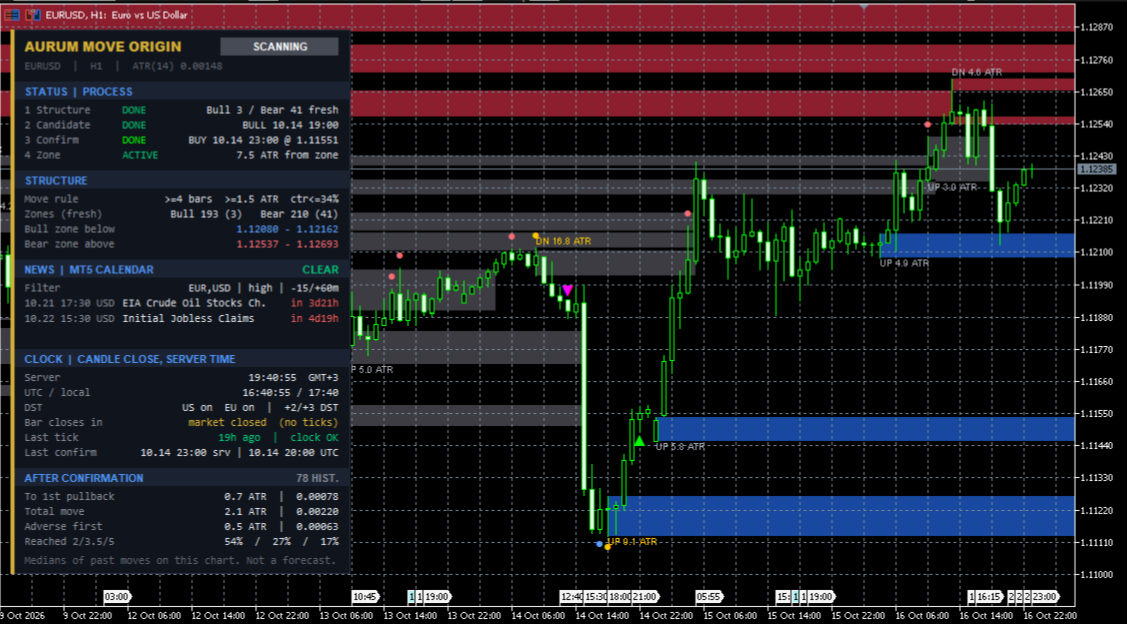
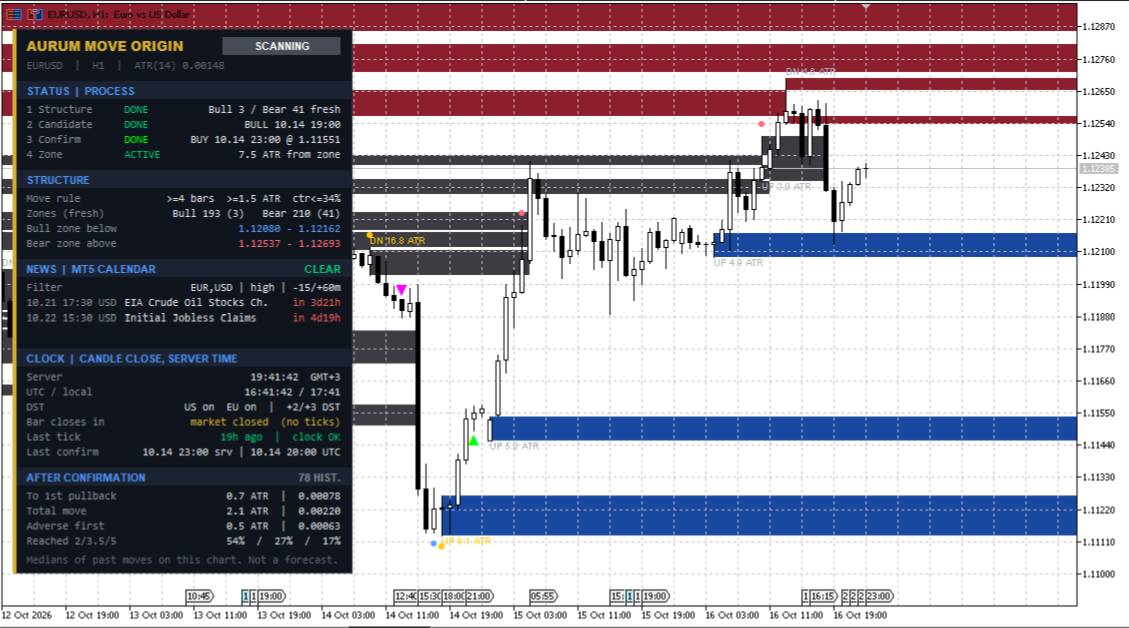
Every major move starts somewhere. AURUM Move Origin finds that candle, marks it on your chart, and keeps the zone in view until the market trades back through it. A staged status panel shows where the market stands right now, from structure through candidate to confirmation, together with upcoming news for your symbol and a broker clock you can trust.

Description

AURUM Move Origin is a market-structure indicator that identifies the origin candle of significant directional moves and turns it into a clear, actionable zone.

It recognises genuine directional moves and filters out ordinary noise. Each qualifying move’s origin candle is boxed across its full range, wicks included, and extended to the right as a live zone. Zones stay active until price trades back through them and then grey out, so your chart always separates fresh structure from used structure.

Three chart layers work together:

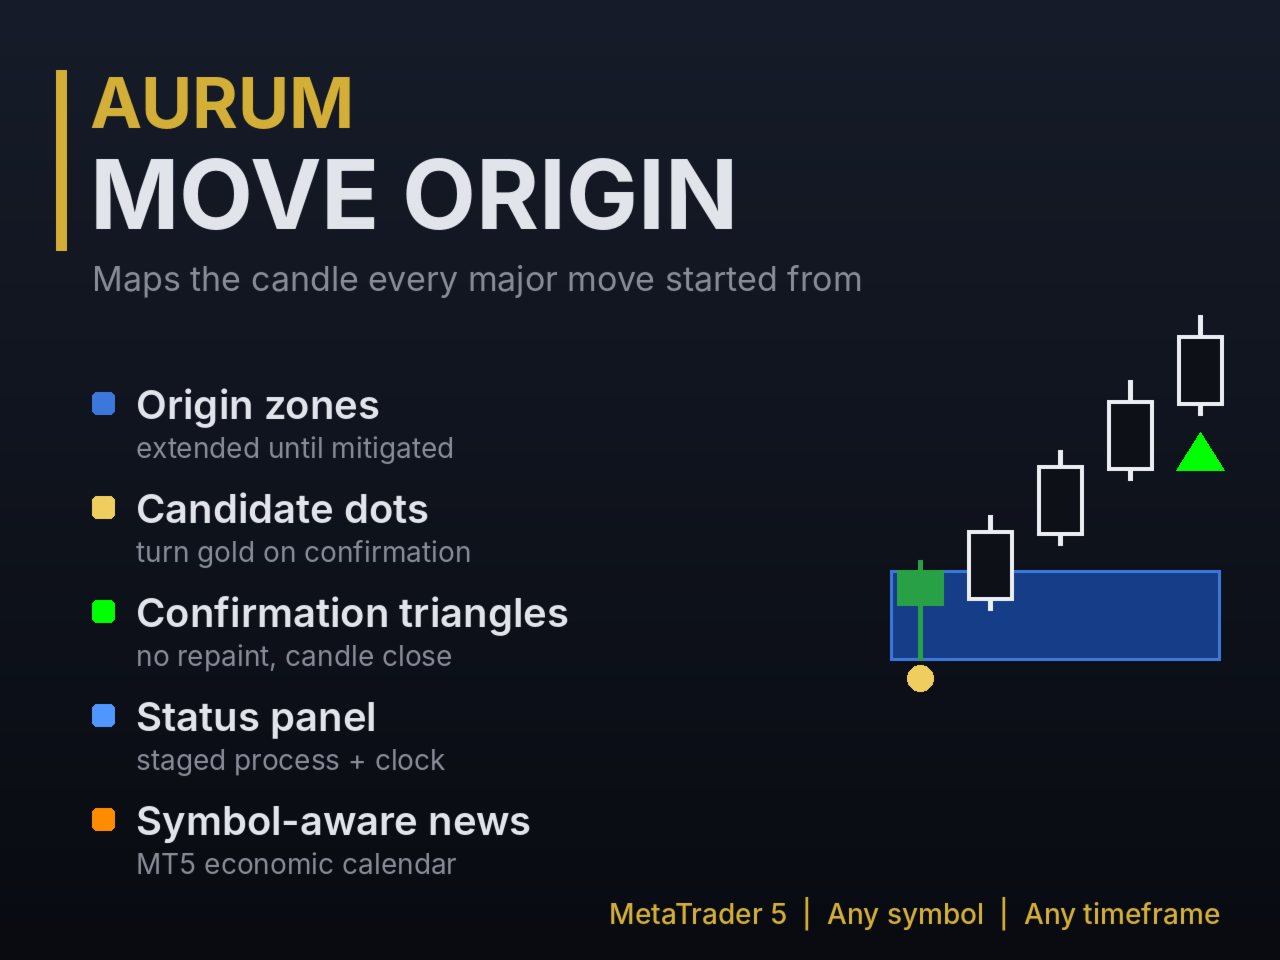
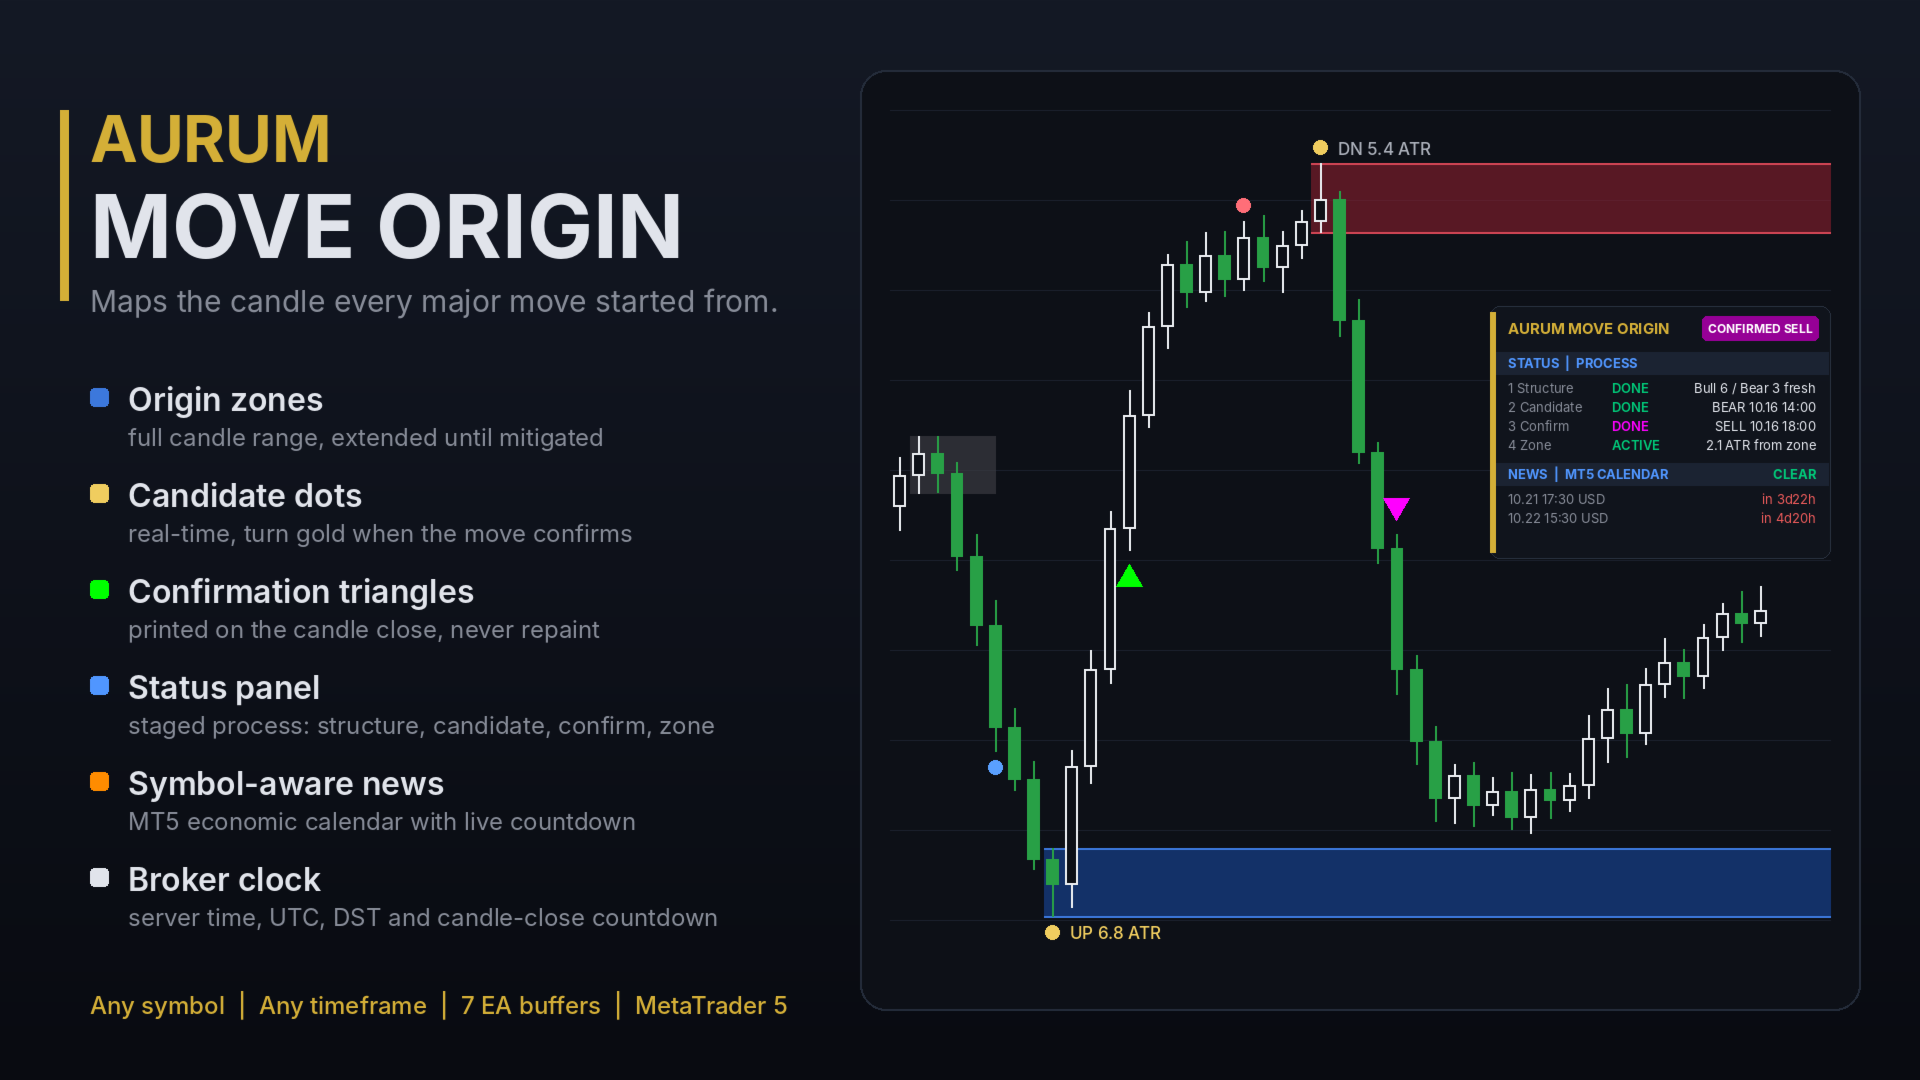
  • Origin zones: where moves began.
  • Candidate dots: candles showing early characteristics of a potential origin, flagged in real time.
  • Confirmation triangles: the moment a move qualifies.

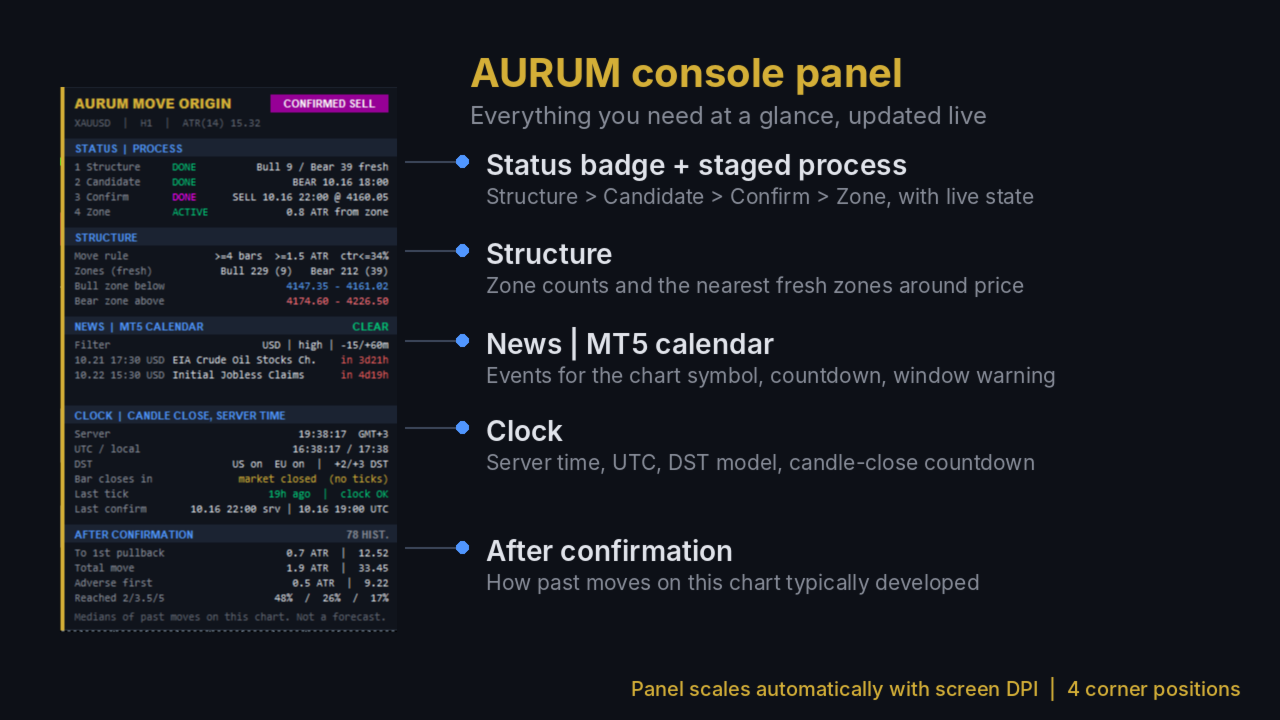
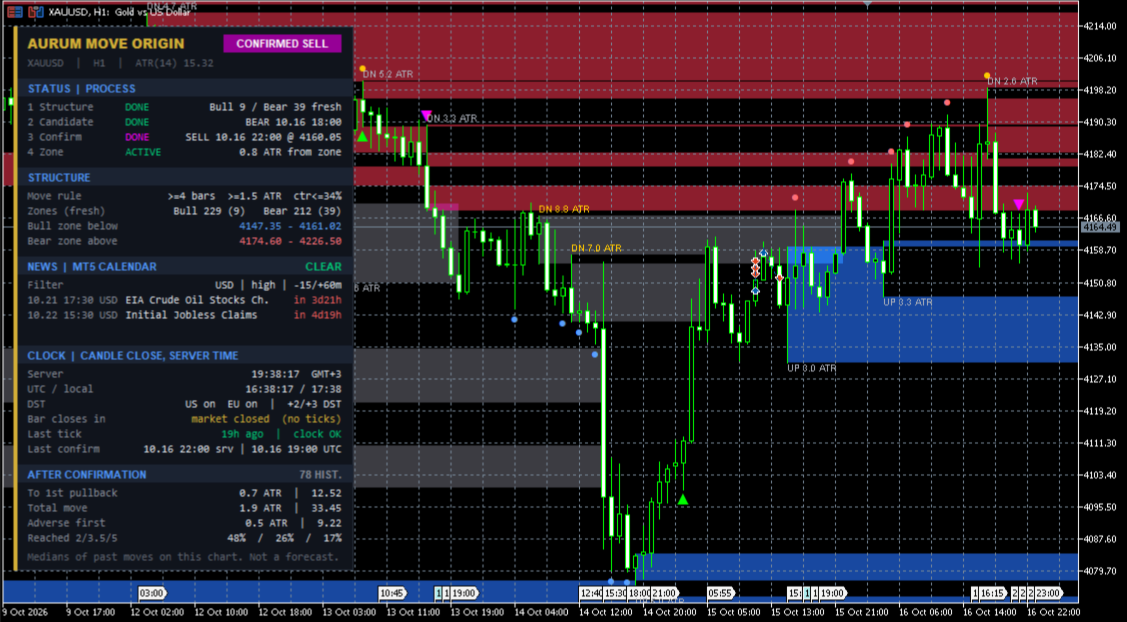
The AURUM console panel brings it together in clearly separated sections:

  • Status badge: the current state at a glance (Confirmed, News Window, Candidate, In Zone or Scanning).
  • Staged process: structure, candidate, confirmation and zone, with the live state of each stage.
  • Structure: fresh zone counts and the nearest bullish and bearish zones around price.
  • News: upcoming events from the MetaTrader 5 economic calendar, automatically matched to the chart symbol, with live countdowns and a news-window warning.
  • Clock: broker server time, UTC, DST status, and a live countdown to the candle close.
  • After confirmation: how moves on your chart have typically behaved after confirmation.

All confirmed elements are fixed once drawn. The indicator does not repaint.

It works on any symbol and timeframe: forex, metals, indices, commodities, crypto and shares. Every parameter is adjustable, and EA developers can read all signals and zone levels through indicator buffers.

AURUM Move Origin is a market-structure analysis tool, not a trading system. Use it alongside your own strategy and risk management.

Features

Feature What you get
Origin zones The full range of the candle each major move started from, wicks included, extended right
Zone status Fresh zones in colour; mitigated zones greyed or hidden
Candidate dots Real-time markers on possible origin candles, turning gold when the move confirms
Confirmation triangles Lime ▲ (bullish) and magenta ▼ (bearish) on the candle where a move qualifies
Zone labels Direction and move size in ATR, or a detailed mode with candle characteristics
Status badge Confirmed / News Window / Candidate / In Zone / Scanning
Staged process 4 stages, each showing DONE, LIVE, WAIT, IN ZONE or ENDED with details
Structure summary Zone counts and the nearest fresh zones above and below price
Symbol-aware news MT5 economic calendar, filtered to the currencies that drive the chart symbol (e.g. XAUUSD shows USD, GER40 shows EUR)
News window Configurable minutes before and after events, shown on the panel and badge
Broker clock Server time and offset, UTC, DST model detection, candle-close countdown, clock check
Excursion profile Typical run to first pullback, total move, adverse move, and how often moves reached 2, 3.5 and 5 ATR
No repainting Confirmed zones and triangles never move or disappear
Alerts Popup, sound, push and email for confirmations, zones, candidates and upcoming news
EA buffers 7 buffers: zone levels, candidate direction, confirmation prices
Panel position Any of the 4 chart corners

If the MQL5 description editor doesn’t render tables, use the rows as a bullet list instead.

How to use

1. Read the structure

  • Blue zones (bullish origins) below price show where buyers launched a move.
  • Red zones (bearish origins) above price show where sellers did.
  • The STRUCTURE section lists the nearest fresh zone on each side.

2. Follow the staged process

Stage What to watch
1 Structure How much fresh structure surrounds price
2 Candidate A LIVE candidate is an early alert, not a signal
3 Confirm DONE means the move qualified; the triangle prints and the dot turns gold
4 Zone ACTIVE, IN ZONE or ENDED tells you whether the new zone still holds

3. Check the badge before acting
CONFIRMED marks a fresh confirmation. NEWS WINDOW means a high-impact event is close; many traders stand aside then.

4. Use zones for risk and targets

  • The far side of a zone is a natural invalidation level.
  • Opposing fresh zones are logical profit-taking areas.
  • The excursion profile shows how far moves on this chart have typically run, to help set realistic targets.

5. Combine timeframes
Higher-timeframe zones give context; lower-timeframe confirmations help with timing.

6. Set alerts
Confirmation alerts are on by default. Enable zone, candidate or pre-news alerts as needed.

Key settings

Setting Default Purpose
Min candles / min move (ATR) 4 / 1.5 How large a move must be to create a zone. Raise for fewer, larger zones
Max share of counter candles 0.34 How much pullback is allowed inside a move
Which candle to box Immediate Alternatives: opposite-colour only, or last opposite candle
Candidate filters Standard Raise the minimum score for fewer, stricter candidates
Zone ends when Candle close Or wick through, or never
News currencies AUTO Detected from the symbol, or enter your own list (e.g. USD,EUR)
News window 15 min before / 60 min after Period flagged as News Window
History depth 5000 bars More history gives a fuller profile; less loads faster

Tips

  • Hover over any zone or triangle for its details.
  • More volatile instruments often benefit from a higher minimum move.
  • The CLOCK section confirms your broker’s time offset and DST, so you can line up news times and candle closes.
  • In the Strategy Tester the news section shows “n/a”, because the MT5 calendar isn’t available there.

Disclaimer: Trading involves substantial risk. This indicator provides market-structure analysis only and does not guarantee future results. The excursion profile reflects historical behaviour on the loaded chart and is not a forecast.
おすすめのプロダクト
How it works –   Base-departure detection — algorithmically finds consolidation bases (overlapping range with compressed volatility) followed by displacement departures. Patterns: Drop-Base-Rally, Rally-Base-Drop, Rally-Base-Rally, Drop-Base-Drop — detected structurally, not by candle names. –   Strength score (0–100) — from departure velocity, time-at-base, freshness (each revisit decays the score), higher-timeframe confluence and origin volume. –   Lifecycle — Fresh, Tested (decaying), Broken
FREE
QuantumAlert Stoch Navigator is a free indicator available for MT4/MT5 platforms, its work is to provide "alerts" when the market is inside "overbought and oversold" regions in the form of "buy or sell" signals. This indicator comes with many customization options mentioned in the parameter section below, user can customise these parameters as needful. Join our   MQL5 group , where we share important news and updates. You are also welcome to join our private channel as well, contact me for the p
FREE
Renko Heatmap Pro – ATR Renko Trend, Reversal and Trade Levels Renko Heatmap Pro is a MetaTrader 5 (MT5) Renko-style trend and volatility analysis indicator that uses Average True Range (ATR)-based calculations to visualise directional price movement, potential trend reversals, and changing market conditions on a conventional price chart. Designed for traders who want Renko-inspired analysis without relying solely on a separate offline Renko chart, the indicator presents calculated directional s
FREE
Apex Point is a trend-following indicator for MetaTrader 5, transforming complex market data into signals for traders. It displays blue dots for uptrends, red dots for downtrends, and yellow crosses at potential reversals, helping users identify momentum shifts quickly. Key features include a confirmation system requiring multiple bars (default: 3) to validate changes, reducing false signals; dynamic ATR-based offsets for adaptive trailing, with instant ratcheting in the trend direction and smo
FREE
概要 このインジケーターは、クラシックな ドンチャンチャネル を強化したバージョンで、実践的なトレード機能を追加しています。 標準の3本線(上限、下限、中央線)に加え、 ブレイクアウト を検出し、チャート上に矢印で視覚的に表示します。また、チャートを見やすくするために、 現在のトレンド方向と逆側のラインのみを表示 します。 インジケーターの機能: 視覚的シグナル :ブレイクアウト時にカラフルな矢印を表示 自動通知 :ポップアップ、プッシュ通知、Eメール RSIフィルター :市場の相対的な強弱に基づいてシグナルを検証 カスタマイズ可能 :色、ラインの太さ、矢印コード、RSI閾値など 動作原理 ドンチャンチャネルは次のように計算します: 上限線 :直近N本のクローズ済みローソク足の最高値 下限線 :直近N本のクローズ済みローソク足の最安値 中央線 :最高値と最安値の平均値 上方ブレイクアウト は終値が上限線を超えたときに発生し、 下方ブレイクアウト は終値が下限線を下回ったときに発生します。 インジケーターは以下を行います: 3本のドンチャンラインを描画 方向転換後の最初のブレイクアウト
FREE
Trade Behavior Mirror は、自分の口座の確定した取引履歴だけを読み、「損失が確定した直後に、自分のふだんの水準より大きいロットで新規ポジションを開いた」というパターンを1つだけ数えるツールです。予測も助言もしません。パネルに出るのは、すでにこの口座で起きたことの実測値だけです。 数字の作り方: 全銘柄・全マジック番号を対象に、最大31日分の確定した約定を読み込みます(チャートの銘柄に限らない、口座全体の集計です)。当日より前の30日間から、1日あたりの新規エントリー件数の中央値と、そのエントリーのロットの中央値を求めます。平均ではなく中央値を使うのは、1件だけ大きな取引があっても基準値全体が引きずられないようにするためです。その30日間のエントリーが5件に満たない場合は、十分な標本が無いということなので、無理に数字を出さず「Collecting history」と表示します。 核となる集計(画面では Entries within 10min of a loss, at above-median lot: の行): 新しいエントリーのたびに、その直前10分以内に損
FREE
QuantumAlert RSI Navigator is a free indicator available for MT4/MT5 platforms, its work is to provide "alerts" when the market is inside "overbought and oversold" regions in the form of "buy or sell" signals. This indicator comes with many customization options mentioned in the parameter section below, user can customise these parameters as needful. Join our MQL5 group , where we share important news and updates. You are also welcome to join our private channel as well, contact me for the priva
FREE
This EA finds Fair Value Liquidity (FVL) on the chart, tracks when they get mitigated , and then looks for an inversion signal (price “fails” through the zone). When that inversion happens, it places a trade in the opposite direction of the original Liquidity gap (an Inverse FVG approach). It also lets you control when it trades using market sessions , and it can auto-close positions at New York open (all positions or profitable-only). Key advantages Clear, rule-based entries (no guessing): trad
FREE
Grid baskets rarely break in a quiet market. They break when a trend starts and nobody notices it in time. LTS Trend Strength is the market-regime filter from LTS - Legacy Trading System. In one look it tells you whether the market is ranging, in transition or in a strong trend, on your chart and on four higher timeframes at the same time. It is built on the same ADX and ATR principles we use to protect our Expert Advisors, and it is free. It is a market filter, not an entry signal: it tells yo
FREE
MOHD-iK Coding HUB presents MOHD-iK GOLD Ballestic Pro , the premium, high-precision trading solution engineered for Gold (XAUUSD).This Pro Version represents the full evolution of my trading logic, meticulously designed for capital preservation, advanced risk management, and professional-grade performance. After purchase, text me for the set file. Also, mention your starting balance. IMPORTANT: READ BEFORE INSTALLATION To ensure the EA operates with maximum efficiency and connects to critical
FREE
High Low Open Close
Alexandre Borela
4.98 (46)
このプロジェクトが好きなら、5つ星レビューを残してください。 このインジケータは、指定されたためのオープン、ハイ、ロー、クローズ価格を描画します 特定のタイムゾーンの期間と調整が可能です。 これらは、多くの機関や専門家によって見られた重要なレベルです トレーダーは、彼らがより多くのかもしれない場所を知るために有用であり、 アクティブ。 利用可能な期間は次のとおりです。 前の日。 前週。 前の月。 前の四半期。 前年。 または: 現在の日。 現在の週。 現在の月。 現在の四半期。 現年。
FREE
Zaxti Trend Levels [SORSAWO]: Where Algorithmic Precision Meets Visual Elegance Step into a new era of technical analysis. Zaxti Trend Levels is not just another charting tool; it is a comprehensive trend-visualization engine crafted for the discerning trader. By seamlessly blending the mathematical rigor of advanced adaptive filtering with intuitive visual mapping, this indicator transforms chaotic price action into a clear, actionable roadmap. Designed to eliminate noise and highlight what tru
FREE
LT Support Resistance - サポート&レジスタンスを100%自動で識別 手動でサポートラインやレジスタンスラインを引く作業に、時間を取られて疲れていませんか?あるいは、重要なレベルをいつも見落としてしまい、悔しい思いをしていませんか?LT Support Resistanceは、そのような煩わしい作業をなくすために開発されました。複数のタイムフレーム(時間足)を同時に分析し、取引しているアセットの最も重要なゾーンを自動的に識別してチャート上に描画します。 == 重要レベルのスマート自動化 == 主観的で時間の Gann(ガン)かかる手動のライン引きとは異なり、このインジケーターは価格の履歴を分析し、重要な反転ポイントを特定して、価格が「実際に」意識しているサポート・レジスタンスラインを描画します。その結果、客観的で素早い、データに基づいた分析が可能になります。 == 主な特徴 == 100% 自動検出: 手動による分析なしでサポート/レジスタンスを識別 マルチタイムフレーム (MTF): M5(5分足)チャート上に、H1、H4、D1、W1のレベルを同時に表示可能 ス
Introduction The "Ultimate Retest" Indicator stands as the pinnacle of technical analysis made specially for support/resistance or supply/demand traders. By utilizing advanced mathematical computations, this indicator can swiftly and accurately identify the most powerful support and resistance levels where the big players are putting their huge orders and give traders a chance to enter the on the level retest with impeccable timing, thereby enhancing their decision-making and trading outcomes.
FREE
Are you tired of drawing trendlines every time you're analyzing charts? Or perhaps you would like more consistency in your technical analysis. Then this is for you. This indicator will draw trend lines automatically when dropped on a chart. How it works Works similar to standard deviation channel found on mt4 and mt5. It has 2 parameters: 1. Starting Bar 2. Number of bars for calculation The   starting bar   is the bar which drawing of the trend lines will begin, while the   number of bars for c
FREE
The Indicator show Daily Pivot Points. It is possible to specify the number of days to display. For forex it doesn't consider the sunday session data. It is possibile to modify the color, style and  width for every level. It is better to use this indicator with timeframe not higher than Н1. 4 Levels of support and resistance with also Intermediate Levels that is possible to hide.
FREE
NHK Local Time Scale NHK Local Time Scale displays your PC/local time directly on the MT5 chart , alongside the broker's native chart time. The trader can easily compare both time zones for any candle. Benefits for Traders: Quickly convert Broker Time ↔ Local/PC Time . Helps accurately set News Stop/News Filter times. Makes London, New York, Asian and other trading sessions easier to identify in your local time. Helps verify that EA session and news time settings are correct. Reduces mistakes ca
FREE
PROMETHEUS TECHNICAN VERSION Free | By THE SONS A gift from The Sons — no strings, no trial, no expiry. Every trader deserves access to professional-grade market intelligence. That belief is why Prometheus Technical Version exists, and why it costs nothing. Consider it our handshake to the trading community. What You're Getting This is not a simplified tool dressed up as a gift. Prometheus Technican Version is a fully built, institutional-quality technical analysis indicator running a dual-model
FREE
Spike Catch Pro 22:03 release updates Advanced engine for searching trade entries in all Boom and Crash pairs (300,500 and 1000) Programmed strategies improvements Mx_Spikes (to combine Mxd,Mxc and Mxe), Tx_Spikes,   RegularSpikes,   Litho_System,   Dx_System,   Md_System,   MaCross,   Omx_Entry(OP),  Atx1_Spikes(OP),   Oxc_Retracement (AT),M_PullBack(AT) we have added an arrow on strategy identification, this will help also in the visual manual backtesting of the included strategies and see ho
FREE
Little useful tool - you manually select range on chart by dragging vertical blue lines and indicator shows support and resistance zones for this range and extends them outside of selected range.  Useful for: * Range trading * Range breakout * Range breakout & retest * Good entry during pullback in trend phase when previous high is retested * Good for scalping on short timeframes * Good for trades on longer timeframes around selected important zones like daily high or low
FREE
ピボットポイントフィボRSJは、フィボナッチレートを使用してその日のサポートラインとレジスタンスラインを追跡するインジケーターです。 この壮大な指標は、フィボナッチレートを使用してピボットポイントを通じて最大7レベルのサポートとレジスタンスを作成します。 価格がこのサポートとレジスタンスの各レベルを尊重する方法は素晴らしいです。そこでは、オペレーションの可能な入口/出口ポイントを認識することができます。 特徴 最大7レベルのサポートと7レベルの抵抗 レベルの色を個別に設定します 入力 ピボットタイプ ピボットフィボRSJ1 =フィボ比1の計算 ピボットフィボRSJ2 =フィボ比2の計算 ピボットフィボRSJ3 =フィボ比3の計算 ピボットフィボクラシック=クラシックピボット計算 最小ピボットレベル ピボット3レベル ピボット4レベル ピボット5レベル ピボット6レベル ピボット7レベル それでも質問がある場合は、ダイレクトメッセージで私に連絡してください: https://www.mql5.com/ja/users/robsjunqueira/
FREE
Nova SuperTrend Follower See the market clearly. Trade with precision. Follow the trend with confidence. The Nova SuperTrend Follower is a powerful, multi-layered indicator combining institutional VWAP with a fully customizable dual EMA system. It cuts through the noise to give you crystal-clear market visibility, perfect entry timing, and early reversal detection. The Core Components VWAP — The Volume Anchor Tracks institutional money flow. Unlike standard averages, VWAP filters out low-volum
Blahtech VWAP - Volume Weighted Average Price (VWAP) is the ratio of price to total volume. It provides an average price over a specified time interval.  Links [  Install  |  Update  |  Documentation   ] Feature Highlights Configurable VWAP Line Sessions, intervals, anchored or continuous Previous day settlement line Standard Deviation bands Alerts at bar close or real time Automatic Broker or Tick volumes Significantly reduced CPU usage Input Parameters Expert Advisor Mode  - Reserved for iCu
FREE
Caicai L&S Yield Histogram Important Notice: This indicator is an integral tool of the automated EA Caicai Long and Short Pair Trading . This indicator visually displays the percentage deviation (Yield %) of a pair's current spread relative to its own historical mean. It is an excellent tool for quickly visualizing the gross financial potential of a market distortion in Long & Short operations. Main Features: Percentage Visualization: Understand the size of the distortion in palpable percentage
Value Chart Candlesticks
Flavio Javier Jarabeck
4.57 (14)
The idea of a Value Chart indicator was presented in the very good book I read back in 2020 , " Dynamic Trading Indicators: Winning with Value Charts and Price Action Profile ", from the authors Mark Helweg and David Stendahl. The idea is simple and the result is pure genius: Present candlestick Price analysis in a detrended way! HOW TO READ THIS INDICATOR Look for Overbought and Oversold levels. Of course, you will need to test the settings a lot to find the "correct" one for your approach. It
FREE
VFI Quantum
Nikita Berdnikov
5 (1)
Introducing VFI (Volume Flow Indicator) – a trading indicator that analyzes the relationship between volume and price movement to identify key trading opportunities. The indicator displays the strength and direction of volume flow, providing clear signals about potential entry and exit points. Signals are formed based on zero line crossovers, crossovers between the VFI line and its exponential moving average (EMA), and when the indicator exits overbought and oversold zones. Attention! This stra
FREE
(Special New Year promotion - free price!) The indicator displays the actual 'Scale in points per bar' (identical to the manual setting in the Terminal, see screenshot) in the upper right corner of the chart. The displayed value changes INSTANTLY whenever the chart scale is changed! (This is very convenient when planning screenshots). In Settings: Change language (Russian/English), font size of the displayed text, text label offset coefficient from the graph corner, equally in X and Y directi
FREE
If you love this indicator, please leave a positive rating and comment, it will be a source of motivation to help me create more products <3 How to use  Slope Direction Line Uptrend: When the SDL line slopes up and turns from red to green, it shows that the price is trending up. This is also considered a buy signal. Downtrend: When the SDL line slopes down and turns from green to red, it shows that the price is trending down. This is also considered a sell signal. Sideways: When the SDL line mo
FREE
Friend of the Trend: Your Trend Tracker Master the market with Friend of the Trend , the indicator that simplifies trend analysis and helps you identify the best moments to buy, sell, or wait. With an intuitive and visually striking design, Friend of the Trend analyzes price movements and delivers signals through a colorful histogram: Green Bars : Signal an uptrend, indicating buying opportunities. Red Bars : Alert to a downtrend, suggesting potential selling points. Orange Bars : Represent cons
FREE
Automated Timeframe cycling with Symbols centered.  Force every timeframe onto one clock window, so the story you see on Daily is the same story you are slicing on H4, H1, and M1.  Traders usually flip timeframes and lose the span. A Daily chart shows a few weeks, then M15 shows a few hours, and the eye treats them as different markets. TASSERACT locks the window to N bars of the highest enabled timeframe — default 10 Daily — and maps every lower timeframe to that same stretch. You stay inside o
FREE
このプロダクトを購入した人は以下も購入しています
Trend Sniper X
Sarvarbek Abduvoxobov
4.9 (42)
Trend Sniper X は、トレードの方向性と潜在的な反転ポイントを明確かつ正確に特定するのに役立つ、MetaTrader 5 用のマルチタイムフレーム・トレンドフォロー指標です。 MT4用: https://www.mql5.com/en/market/product/193245 価格情報: 現在の価格はプロモーション価格であり、今後のアップデートや新機能のリリースに伴い変更される場合があります。 ボーナス特典: このインジケーター用の無料自動売買アシスタントEAを入手するには、購入後に an 著者(開発者)へメッセージをお送りください。 Code2Profit チャンネル マルチタイムフレーム分析で相場をマスターしよう! Trend Sniper X で勝率を最大化する方法:重要なルールとセッションのコツ 技術仕様 プラットフォーム MetaTrader 5 インジケータータイプ マルチタイムフレーム・トレンドインジケーター 操作タイムフレーム あらゆるチャートタイムフレームに対応。個別に選択可能な上位タイムフレーム (M1–MN1) を搭載 主要銘柄 FX、ゴールド (X
Smart Trend Trading System — MetaTrader 5 ご購入後、MQL5で私にメッセージをお送りいただくと、Smart Universal Expert Advisorを無料で受け取れるほか、オンライン講座、PDFマニュアル、非公開グループへのアクセスもご利用いただけます。 STTSは、トレンドの方向、エントリー・決済シグナル、反転ゾーン、重要な価格水準をチャート上にまとめて表示します。システムを参考に手動で取引することも、別の対応EAを接続し、ご自身で選んだ設定に基づいて自動売買することもできます。 ひとつのシステム、4つのトレードアプローチ STTSのトレードアプローチは、大きく4つのカテゴリーに分かれています。 • スキャルピング — 短期的なシグナルや相場の動きを捉えます。 • トレンドトレード — 方向性を評価し、トレンド内の機会を探します。 • 反転トレード — 反転の可能性があるゾーンや方向の変化を見つけます。 • 出来高トレード — 出来高に基づく情報を使い、市場の活発さを評価します。 エントリー・決済の矢印、トレンド情報、サポート・
伝説が帰ってきました:Entry Points Pro 10。 MQL5 Marketのトップ3に3年間入り続けた伝説的インジケーターの再始動です。 2つのバージョンで合計589件の高評価レビュー、毎日数千人のトレーダーが実際のトレードに使用し、デモのダウンロードは31,000件以上   MT4+MT5 。 私はこの5年間に寄せられたレビューをすべて読み、約束を並べる代わりに、その答えをバージョン10に組み込みました。1999年から相場に携わり、 誠実さ、自らの評判、そして顧客を大切にする 作者による製品です。 Entry Points Proのエントリーシグナルは、リペイント(再描画)を一切行いません。 そして今回初めて、これは作者の言葉ではなく検証可能な事実になりました。確定シグナルはローソク足の終値確定後にのみ表示され、自動テストで リペイントはゼロ と確認されています(EURUSD、XAUUSD、BTCUSDで2,486,568回の不変条件チェック、違反0件)。検証方法は公開されており、ストラテジーテスターでご自身で再現できます。 ご購入後は、必ずすぐにダイレクトメッセージでご
Neuro Poseidon is a new indicator by Daria Rezueva. It combines precise trading signals with adaptive TP/SL levels - creating best possible trades as a result! Message me and get  Neuro Poseidon Assistant  as a gift to automize your trading process! What makes it stand out? 1. Proven profitability on all assets and timeframes 2. Only confirmed BUY and SELL signals present on the chart 3. Adaptive TP & SL levels generated by the software for each trade 4. Easy to understand - suitable for al
M1 SNIPER は使いやすいトレーディングインジケーターシステムです。M1時間足向けに設計された矢印インジケーターです。M1時間足でのスキャルピングのためのスタンドアロンシステムとして、また既存のトレーディングシステムの一部としても使用できます。このトレーディングシステムはM1時間足での取引に特化して設計されていますが、他の時間足でも使用できます。元々、この手法はXAUUSDとBTCUSDの取引用に設計しましたが、他の市場においても役立つと考えています。 インジケーターのシグナルは、トレンドの方向と逆方向に取引できます。インジケーターのシグナルを利用して両方向に取引するのに役立つ特別な取引テクニックをご紹介します。この手法は、特別な動的なサポートとレジスタンスの価格帯を利用することに基づいています。 ご購入後、M1 SNIPER矢印インジケーターをすぐにダウンロードできます。さらに、M1 SNIPERツールのすべてのユーザーに、以下のスクリーンショットに表示されているApollo Dynamic SRインジケーターを無料で提供しています。この2つのインジケーターを組み合わせることで
Adaptive Price Action Engine インジケーターを購入すると、EAが無料に マルチタイムフレーム対応・自己最適化トレンド&ローソク足パターン分析 市場環境は常に変化しており、すべてのPrice Actionパターンが、あらゆる市場環境で同じ価値を持つわけではありません。 Adaptive Price Action Engine は、変化する市場環境への適応を目的として、 トレンド構造、マルチタイムフレーム分析、ローソク足パターン、統計的最適化 を1つの分析フレームワークに統合しています。 2つのアダプティブモード Dual Alpha Trend Mode 低い時間足と高い時間足のAlpha Trendパラメータを自動的に探索し、直近の市場動向に合わせてトレンド判定を適応させます。 Candlestick + Alpha Mode Alpha Trendによる市場レジーム判定と、 22種類の強気・弱気ローソク足パターン を組み合わせます。すべてのパターンを同じように扱うのではなく、さまざまなパターンの組み合わせを統計的に評価し、選択された市場環境において過去
ARIPoint
Temirlan Kdyrkhan
1 (4)
ARIPoint is a powerful trading companion designed to generate high-probability entry signals with dynamic TP/SL/DP levels based on volatility. Built-in performance tracking shows win/loss stats, PP1/PP2 hits, and success rates all updated live. Key Features: Buy/Sell signals with adaptive volatility bands Real-time TP/SL/DP levels based on ATR Built-in MA Filter with optional ATR/StdDev volatility Performance stats panel (Success, Profit/Loss, PP1/PP2) Alerts via popup, sound, push, or email Cu
Gann Made Easy   は、ミスター・ギャンの理論を使用した取引の最良の原則に基づいた、プロフェッショナルで使いやすい外国為替取引システムです。 W・D・ガン。このインジケーターは、ストップロスとテイクプロフィットレベルを含む正確な買いと売りのシグナルを提供します。 PUSH通知を利用して外出先でも取引可能です。 ご購入後、取引方法の説明と優れた追加インジケーターを無料で入手するには、私にご連絡ください! おそらく、ギャンの取引手法についてはすでに何度も聞いたことがあるでしょう。通常、ギャンの理論は初心者のトレーダーだけでなく、すでにある程度の取引経験がある人にとっても非常に複雑なものです。なぜなら、ギャンの取引手法は理論的にはそれほど簡単に適用できるものではないからです。私はその知識を磨き、最良の原則を私の外国為替インジケーターに組み込むために数年を費やしました。 このインジケーターは非常に簡単に適用できます。必要なのは、それをチャートに添付し、簡単な取引推奨事項に従うだけです。このインジケーターは常に市場分析の仕事を行い、取引の機会を探します。適切なエントリーポイントを検
「Scalper Vault」は、デイトレードで安定した成果を目指すトレーダーのために設計された、強力かつ充実した機能を備えたトレーディングシステムです。 この高精度なインジケーターは、それ単体で完結するトレーディングシステムとして機能し、FXやバイナリーオプションのトレーダーに、機関投資家レベルの分析を提供します。 ご購入後、ぜひご連絡ください。 トレードのヒントに加え、豪華なボーナスをプレゼントいたします! 「Scalper Vault」を活用すれば、勘に頼った判断や複雑な手動分析は不要です。使いやすいトレード手法に集中し、純粋に「エントリー・決済」という実行フェーズに専念できます。 高精度なトレンドフォロー・シグナル:中核となるアルゴリズムが市場構造を分析し、主要なトレンド方向に沿った高確率なシグナルを提示します。これにより、誤ったエントリーを大幅に削減できます。 精度の高い天井・底の検知:市場の勢いが尽きたポイントをスキャンし、反転の可能性が高いゾーンを特定します。 ギャン(Gann)理論に基づく売買ゾーン:数学的な「ギャン・レベル」を自動的にチャート上に描画します。機関投資
Auto Optimized SpeedAngle は、継続的なウォークフォワード最適化(WFO:Walk-Forward Optimization)によりカーブフィッティング(過剰最適化)を排除した、機関投資家レベルのモメンタムベクトルシステムです。市場レジームの変化時に効果が低下する静的な入力に依存せず、アウトオブサンプル(OOS)検証を用いてパラメーターを動的に再キャリブレーションすることで、表示されるシグナルが単なる過去の偶然ではなく、確実な統計的優位性に基づいていることを保証します。 主な機関投資家向けフレームワーク ウォークフォワード最適化エンジン: ルックバック期間やしきい値の数千に及ぶ組み合わせを継続的にスキャンし、データをインサンプルとアウトオブサンプルに厳格に分離します。未検証のデータ環境において数学的優位性が証明された場合にのみ、新しいパラメーター設定を採用します。 定量的目的関数: 単なる純利益の追求ではなく、機関投資家レベルの安定性指標をターゲットとします。システム品質ナンバー(SQN)、期待値(1トレードあたりの平均Rマルチプル)、またはネットRの最適化を選
トレーダーの皆さん、こんにちは! 多くの個人トレーダーは、動作の遅いウェブスクリプトに頼っています。真の収益性を実現するには、体系化されたフレームワークが必要です。 Astro AIインジケーターは、一般的なチャートオーバーレイではありません。これは、ターミナル上で直接動作する2つのエージェントを含む、コンパイル済みのニューラルネットワークです。 システムの具体的な技術は以下のとおりです。 1. エージェント1:アナリスト(グラフィカルニューラルネットワーク - GNN) 市場は孤立した価格バーではなく、相互に連結されたデータネットワークです。 機能:エージェント1は、グラフィカルニューラルネットワークを使用して、これらの複雑で非線形な関係をマッピングします。 利点:一般的なインジケーターは過去の移動平均しか考慮しませんが、当社のGNNは市場の深い構造的関係をリアルタイムで処理し、個人トレーダーの取引量が大きな影響を与える前に、隠れた相関関係を明らかにします。 2. エージェント2:エグゼキューター(近接戦略最適化 - PPO) パターン認識は、戦いの半分に過ぎません
このインジケーターを購入された方には、以下の特典を 無料 で提供しています: 各トレードを自動で管理し、ストップロスとテイクプロフィットを設定し、戦略ルールに基づいてポジションを決済する補助ツール 「Bomber Utility」 様々な銘柄に合わせたインジケーターの設定ファイル(セットファイル) 「最小リスク」、「バランスリスク」、「待機戦略」 の3つのモードで使用できる Bomber Utility 用の設定ファイル このトレーディング戦略をすぐに導入・設定・開始できる ステップバイステップのビデオマニュアル ご注意: 上記の特典を受け取るには、MQL5のプライベートメッセージシステムを通じて販売者にご連絡ください。 オリジナルのカスタムインジケーター 「Divergence Bomber(ダイバージェンス・ボンバー)」 をご紹介します。これは、MACDのダイバージェンス(乖離)戦略に基づいた 「オールインワン」型のトレーディングシステム です。 このテクニカルインジケーターの主な目的は、価格とMACDインジケーターの間に発生するダイバージェンスを検出 し、将来の価格の動きを示
PainX GainX Blue Spike Fusion AI Advanced Synthetic Index Spike Detection Indicator for MetaTrader 5 Discover potential spike setups with a clear, organized, and professional trading interface. PainX GainX Blue Spike Fusion AI is a specialized indicator designed for traders who monitor synthetic indices and want a structured way to observe potential price spike opportunities. The indicator combines signal monitoring, market-condition analysis, visual alerts, and event tracking in one convenient
Volatility Master for MetaTrader is a real-time dashboard tool that scans up to  50 symbols  to identify high-volatility , trending markets instantly. With bullish/bearish signals, customizable alerts, and a user-friendly interface, it helps you avoid range-bound conditions and focus on high-probability trades. Clarity leads to confidence. Trade confidently and protect your capital effectively with this powerful dashboard. We don't offer free or bonus indicators in exchange of reviews from you.
FiboSniper Pro – Multi-Filter Fibonacci System with Auto SL/TP and Control Panel FiboSniper Proは、動的なFibonacci Envelopesと複数の確認フィルターを組み合わせ、選別されたBuyおよびSellシグナルを生成するテクニカルインジケーターです。FibonacciレベルはMoving AverageとATRを基に計算され、その後ADX、EMA、RSI、ATR、Volume、Time、Candle構造によってフィルタリングされます。インジケーターは、ATRに基づく自動Stop LossおよびTake Profitレベルをチャート上に直接表示し、さらに迅速な調整が可能なインタラクティブControl Panelを提供します。 購入後、推奨設定ファイルと詳細な使用方法については、私にご連絡ください。 Auto Trader Xを使用してFiboSniper Proのシグナルを自動化できます: [Auto Trader X] User GuideとSet Files: [Click her
Quantum TrendPulse を ご紹介します。これは、   SuperTrend   、   RSI   、および Stochastic のパワーを 1 つの包括的なインジケーターに組み合わせて、取引の可能性を最大限に引き出す究極の取引ツールです。精度と効率を求めるトレーダー向けに設計されたこのインジケーターは、市場のトレンド、勢いの変化、最適なエントリー ポイントとエグジット ポイントを自信を持って特定するのに役立ちます。 主な特徴: SuperTrend 統合: 現在の市場動向に簡単に追従し、収益性の波に乗ることができます。 RSI精度: 買われすぎと売られすぎのレベルを検出し、市場の反転のタイミングに最適で、SuperTrendのフィルターとして使用されます。 確率的精度: 確率的振動を活用して、変動の激しい市場で隠れたチャンスを見つけます。SuperTrend のフィルターとして使用されます。 マルチタイムフレーム分析:   M5 から H1 または H4 まで、さまざまなタイムフレームで市場を常に把握します。 カスタマイズ可能なアラート: カスタム取引条件が満たされ
発見が困難で頻度が少ないため、分岐は最も信頼できる取引シナリオの1つです。このインジケーターは、お気に入りのオシレーターを使用して、通常の隠れた分岐点を自動的に見つけてスキャンします。 [ インストールガイド | 更新ガイド | トラブルシューティング | よくある質問 | すべての製品 ] 取引が簡単 通常の隠れた発散を見つけます 多くのよく知られている発振器をサポート ブレイクアウトに基づいて取引シグナルを実装します 適切なストップロスおよび利益レベルを表示します 設定可能なオシレーターパラメーター カスタマイズ可能な色とサイズ バー単位でサイズ別に分岐をフィルタリング パフォーマンス統計を実装します 電子メール/音声/視覚アラートを実装します 幅広い市場の見通しを提供するために、異なるオシレーターを使用して、干渉なしで同じチャートにインジケーターを何度もロードできます。このインジケーターは、次のオシレーターをサポートしています。 RSI CCI MACD オスマ 確率的 勢い 素晴らしい発振器 加速器発振器 ウィリアムズパーセントレンジ 相対活力指数 特に外国為替市場では、
Gartley Hunter Multi - An indicator for searching for harmonic patterns simultaneously on dozens of trading instruments and on all possible timeframes. Manual (Be sure to read before purchasing) | Version for MT4 Advantages 1. Patterns: Gartley, Butterfly, Shark, Crab. Bat, Alternate Bat, Deep Crab, Cypher 2. Simultaneous search for patterns on dozens of trading instruments and on all possible timeframes 3. Search for patterns of all possible sizes. From the smallest to the largest 4. All fou
初心者やエキスパートトレーダーに最適なソリューション! このインジケーターは、独自の機能と新しい計算式を取り入れた、ユニークで高品質、かつ手頃な価格のトレーディングツールです。たった1枚のチャートで28の為替ペアの通貨強度を読み取ることができます。新しいトレンドやスキャルピングチャンスの引き金となるポイントを正確に特定することができるので、あなたのトレードがどのように改善されるか想像してみてください。 ユーザーマニュアルはこちら  https://www.mql5.com/en/blogs/post/697384 これが最初の1本、オリジナルだ! 価値のないクローンを買わないでください。 特別な サブウィンドウの矢印で強い通貨の勢いを表示 GAPがあなたのトレードを導く! 基準通貨や気配値が売られすぎ・買われすぎのゾーン(外相フィボナッチレベル)にあるとき、個別チャートのメインウィンドウに警告表示。 通貨がレンジの外側から反落した場合、プルバック/リバーサルのアラート。 クロスパターンの特別なアラート 複数の時間枠を選択可能で、トレンドを素早く確認できます。通貨強度のライン
初心者やエキスパートトレーダーに最適なソリューション! このインジケータは、独自の機能と秘密の数式を組み込んだ、ユニークで高品質かつ手頃な価格のトレーディングツールです。たった1枚のチャートで28の通貨ペアのアラートを表示します。新しいトレンドやスキャルピングチャンスの引き金となるポイントを正確に把握することができるので、あなたのトレードがどのように改善されるか想像してみてください! 新しい基本的なアルゴリズムに基づいて構築されているため、潜在的な取引の特定と確認がより簡単になります。これは、通貨の強さや弱さが加速しているかどうかをグラフィカルに表示し、その加速のスピードを測定するためです。加速すると物事は明らかに速く進みますが、これはFX市場でも同じです。つまり、反対方向に加速している通貨をペアにすれば、利益を生む可能性のある取引を特定することができるのです。 通貨の勢いを示す縦の線と矢印は、あなたの取引の指針となるでしょう。 ダイナミックマーケットフィボナッチ23レベルはアラートトリガーとして使用され、市場の動きに適応します。もしインパルスが黄色のトリガーラインに当たった場
トレンドラインプロ   市場の真の方向転換点を理解するのに役立ちます。この指標は、真のトレンド反転と主要プレーヤーが再び参入するポイントを示します。 分かりますか     BOSライン   複雑な設定や不要なノイズなしに、より長い時間足でのトレンドの変化と重要なレベルを把握できます。シグナルは再描画されず、バーが閉じた後もチャート上に残ります。 VERSION MT 4     -     RFI LEVELS PRO インジケーター と組み合わせることで、その潜在能力を最大限に発揮します。 インジケーターが示す内容: 本当の変化   トレンド(BOSライン) 一度シグナルが現れたら、それは有効です!これは、リペイント機能を持つインジケーターとの重要な違いです。リペイント機能を持つインジケーターは、シグナルを発した後、それを変更し、資金の損失につながる可能性があります。これにより、より高い確率と精度で市場に参入できます。また、矢印が現れた後、目標値(利益確定)に達するか、反転シグナルが現れるまで、ローソク足の色を変更する機能もあります。 繰り返しエントリ       主要プレーヤーの
M1 Quantum を使用したライブトレードシグナル : シグナル (取引は 自動的に Quantum Trade Assistant によって実行され、この製品に 無料 で含まれています。) 最新ニュース: バージョン1.64がリリースされました。現在、すべての取引で、関連するサポート/レジスタンスゾーンの後ろにStop Lossが設定されます。今回のバージョンでは、EAのパフォーマンスを向上させるためにSmart Close機能も改善されました。 8月9日から、ライブシグナルはバージョン1.64で稼働しています。 価格プラン: 現在価格: $169 (早期購入者向けオファー) 次回予定価格: $189 予定小売価格: $299 開発者からのお知らせ: ご購入後、 最新の推奨設定ファイル(Set File) 、運用アドバイス、および他の M1 Quantum ユーザーと交流できる VIPサポートグループ への招待をご希望の場合は、お気軽にご連絡ください。 よくある質問 - 設定ファイル - インストールガイド M1 Quantum は、M1専用のプロフェッショナルトレーディング
通貨強さウィザードは、取引を成功させるためのオールインワン ソリューションを提供する非常に強力な指標です。このインジケーターは、複数の時間枠のすべての通貨のデータを使用して、このまたはその外国為替ペアのパワーを計算します。このデータは、使いやすい通貨インデックスと通貨パワーラインの形式で表され、特定の通貨のパワーを確認するために使用できます。 必要なのは、取引したいチャートにインジケーターを接続することだけです。インジケーターは、取引する通貨の実際の強さを示します。このインジケーターは、トレンドに合わせて取引するときに有利に利用できる売買高の圧力の極値も示します。このインジケーターには、フィボナッチに基づく可能なターゲットも表示されます。 このインジケーターは、PUSH 通知を含むあらゆるタイプのアラートを提供します。 購入後ご連絡下さい。私の取引のヒントをあなたと共有し、素晴らしいボーナスインジケーターを無料で提供します! 幸せで有益な取引をお祈りします。
ICT PO3 (Power of 3) AMD Protocol Framework Indicator True Time & Structure Integration   |  Non-Repainting | Real-Time  | Multi-Asset  | MT4 Version Available Full Setup Guide & Strategy Playbook: https://www.mql5.com/en/blogs/post/768683 The ICT Power of Three (PO3): The Complete Guide to Accumulation, Manipulation, and Distribution https://www.mql5.com/en/blogs/post/771729 MT4 Version: https://www.mql5.com/en/market/product/171742 Indicator Overview The ICT PO3 AMD Protocol Framework i
もう勘でトレードしなくていい。 エントリーのタイミング、決済の場所、相場がどちらに傾いているか、そのすべてが1つのチャートで分かります。 RelicusRoad Proは、20種類近くのツールを1つのインジケーターにまとめました。自分のトレードスタイルに合うツールだけをオンにできます。 エントリーは明確に。決済も明確に。すべてのチャートに計画を。 心当たりはありませんか? 買った途端、1分もしないうちに価格が逆行する。 早めに決済してしまい、その後も値動きが続くのを眺めている。 チャートにインジケーターを5つ並べても、答えは5通りある。 ストップロスの位置は、なんとなく決めている。 開発した理由 私たちは18年間、FXを取引してきました。RelicusRoadの中核となるアルゴリズムは、最初は非公開で、私たちプロのトレーダー仲間のために作られました。 きっかけは個人的なものでした。毎回同じラインを手で引き、自分たちで決めたルールを破り、チャート上の重要な一点を見落とすことに、私たちは疲れていたのです。 私たちにとって効いたのは一貫性です。毎日同じ方法で相場を読み続け、それが体に染みつく
Power Candles V3 - 自己最適化型強弱インジケーター Power Candles V3は 、通貨や銘柄の強さを、適用されたすべてのチャート上で実行可能なトレードプランに変換します。単にローソク足を色分けするだけでなく、バックグラウンドでリアルタイムの自動最適化を実行し、目の前の銘柄に対して最適なストップロス、テイクプロフィット、およびシグナルの閾値を提示します。ワンクリックで実取引に適用でき、エントリーポイント、ストップロス、テイクプロフィットのラインが正確な価格位置にチャート上に表示され、方向性を示すアラートがリアルタイムで発動します。 このツールは、Stein Investmentsのエコシステムの一部です。  18種類以上のツールをすべて閲覧し、AIを活用したセットアップの推奨事項を入手し、  https://stein.investments でコミュニティに参加しましょう クローズしたバーごとに3,000回以上のトレードシミュレーション。9つの強さの状態。2つの戦略を並行してテスト。勝率の高い設定をワンクリックで適用。 なぜこれが必要なのか ほとんどの強
Bill Williams Advanced is designed for automatic chart analysis using Bill Williams' "Profitunity" system. The indicator analyzes four timeframes at once. Manual (Be sure to read before purchasing) Advantages 1. Analyzes the chart using Bill Williams' "Profitunity" system. Signals are displayed in a table in the corner of the screen and on the price chart. 2. Finds all known AO and AC signals, as well as zone signals. Equipped with a trend filter based on the Alligator. 3. Finds "Divergence Bar
現在33%オフ 初心者にもエキスパートトレーダーにも最適なソリューション このインジケーターは独自の機能と新しい公式を多数内蔵しており、ユニークで高品質かつ手頃な取引ツールです。このアップデートでは、2つの時間枠ゾーンを表示できるようになります。より長いTFだけでなく、チャートTFとより長いTF(ネストゾーンを表示)の両方を表示できます。すべてのSupply Demandトレーダーの皆さんのお気に召すはずです。:) 重要情報の公開 Advanced Supply Demandの可能性を最大化するには、 https://www.mql5.com/ja/blogs/post/720245 にアクセスしてください。   エントリーまたはターゲットの正確なトリガーポイントを正確に特定できれば取引がどのように改善されるか想像してみてください。新しい基盤となるアルゴリズムに基づいて構築されているため、買い手と売り手の間の潜在的な不均衡をさらに簡単に特定できます。これは、最も強い需要と供給のゾーンと、過去のパフォーマンス(古いゾーンを表示)がグラフィカルに表現されるためです。これらの機能は、最適な
Boba Analysis Suite Boba Analysis Suite は、MetaTrader 5 向けの分析インジケーターです。市場構造、重要な価格帯、相場全体の状況を、一つのチャート画面にまとめて表示します。 トレーダーおよびトレーディング指導者としての実務経験をもとに開発され、市場の方向性の評価、重要な価格水準の特定、複数の時間足を組み合わせた分析など、体系的な分析プロセスを支援します。 相場の背景を踏まえた分析 個々のシグナルの意味は、相場の状況によって変わります。Boba Analysis Suite は、現在のチャート状況をより大きな市場構造と関連付け、あらかじめ定めたルールに沿って取引アイデアを検討するための分析を支援します。 主な分析機能: トレンドと市場構造: 市場の方向性と、その背景にある構造を評価します。 重要な価格帯と価格水準: さらに分析すべき重要な領域を視覚的に表示します。 複数の時間足: 異なる時間足の情報を組み合わせ、相場全体の状況を評価します。 視覚的な分析プロセス: 分析情報をチャート上で直接確認できます。 自主的な取引判断を支援 Boba
SUPERHEROインジケーターは、「オールインワン」方式に基づいて設計された多通貨対応の取引システムです。このインジケーターは市場を独自に分析し、取引の開始および終了のタイミングに関するシグナルを提供します。ストップロス注文とテイクプロフィット注文を使用します。R:R比率は1:1です。 このシステムはスマートフォンにプッシュ通知を送信できるため、PCに縛られることなく「外出先」からでも取引を行うことができます。自己勘定取引を行う企業に最適です。 すべてのお客様への特典: このインジケーターをご購入いただいたすべてのお客様に、私から特別なユーティリティをプレゼントいたします。その内容は以下の通りです: 自動的にストップロス注文とテイクプロフィット注文を発注します 価格が目標水準に達すると、自動的に取引を決済します 指値注文による取引に対応しています 平均化取引モードに対応しています この優れた、しかも非常に便利なユーティリティをプレゼントとして受け取りたい場合は、SUPERHEROインジケーターをご購入後、直ちにMQL5プラットフォームのプライベートメッセージを通じて私までご連絡くださ
作者のその他のプロダクト
AURUM Order Flow Footprint Order flow indicator for MetaTrader 5 Confluence buy and sell indicators, derived from institutional order flow. Methodology The indicator is built on the order flow approach used on professional trading desks: read the market from volume actually traded at each price, rather than from lagging averages of the closing price. The underlying concepts, the volume footprint, the Point of Control, the value area, bid and ask imbalance, delta, and the reading of absorption ag
AURUM Volume At Price + Alerts Volume Profile with self-adjusting VAH, POC and VAL alerts. See where the volume is and get notified the moment price gets there. AURUM Volume At Price + Alerts builds a live volume profile over your chosen lookback window and turns the three levels that matter most, Value Area High (VAH), Point of Control (POC) and Value Area Low (VAL), into fully automatic price alerts. There are no hardcoded prices, no manual level drawing and no stale alerts. Levels are recalcu
AURUM ADX DI + Alerts ADX and DI with Wilder or TradingView calculation, and alerts on trend strength levels and DI crossovers. Know the moment a trend starts, not three bars later. AURUM ADX DI + Alerts plots ADX with DI+ and DI- and turns the two events that matter most, trend strength crossing a level and DI+ crossing DI-, into fully configurable alerts. It runs the classic Wilder calculation that MT5 uses, or the Pine v4 calculation that TradingView uses, or both at once on the same chart. E
AURUM SMC Signals XAUUSD Introduction and description AURUM SMC Signals XAUUSD turns Smart Money Concepts into a rules-based signal engine for Gold. It maps market structure, institutional zones and liquidity, scores every setup from 1 to 5 stars, and draws entry, stop loss and three take-profit levels directly on the chart. Every calculation runs on closed bars only. Swing points are confirmed after a fixed number of bars, structure breaks require a candle close, and the higher-timeframe filte
フィルタ:
レビューなし
レビューに返信