AURUM Move Origin XAUUSD
- 지표
-
Pieter Van Aswegen
 I am an investment risk professional with over 15 years of experience in global financial markets, specialising in risk management, portfolio analytics, and systematic trading oversight. My work has focused on developing quantitative models, stress testing, and governance frameworks to strengthen
 - 버전: 2.42
- 활성화: 20
AURUM Move Origin
Every major move starts somewhere. AURUM Move Origin finds that candle, marks it on your chart, and keeps the zone in view until the market trades back through it. A staged status panel shows where the market stands right now, from structure through candidate to confirmation, together with upcoming news for your symbol and a broker clock you can trust.
Description
AURUM Move Origin is a market-structure indicator that identifies the origin candle of significant directional moves and turns it into a clear, actionable zone.
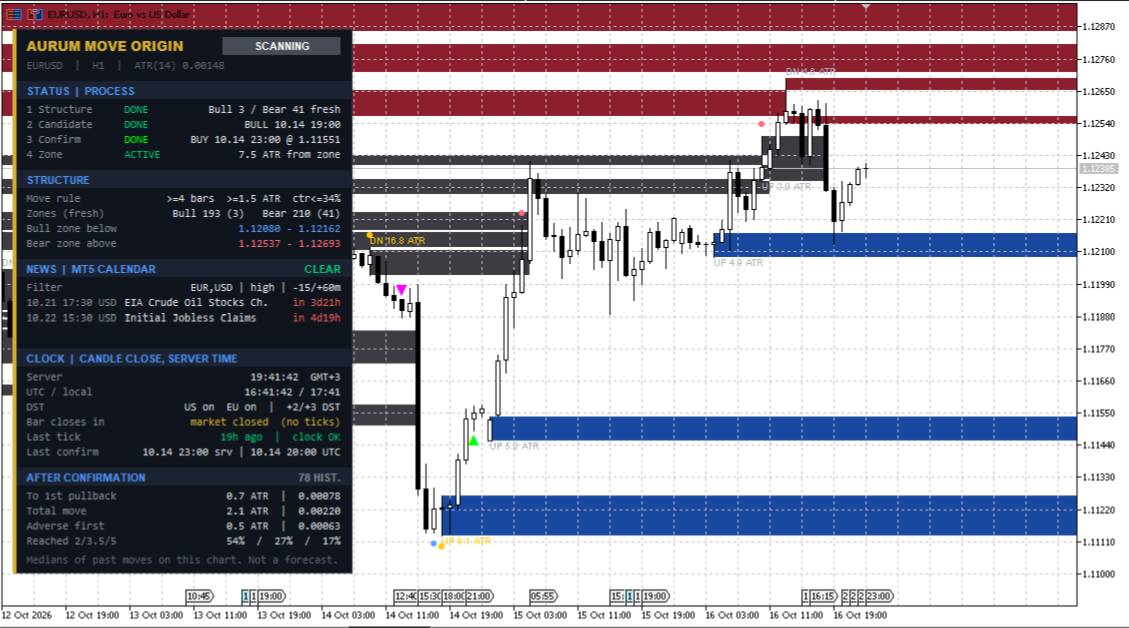
It recognises genuine directional moves and filters out ordinary noise. Each qualifying move’s origin candle is boxed across its full range, wicks included, and extended to the right as a live zone. Zones stay active until price trades back through them and then grey out, so your chart always separates fresh structure from used structure.
Three chart layers work together:
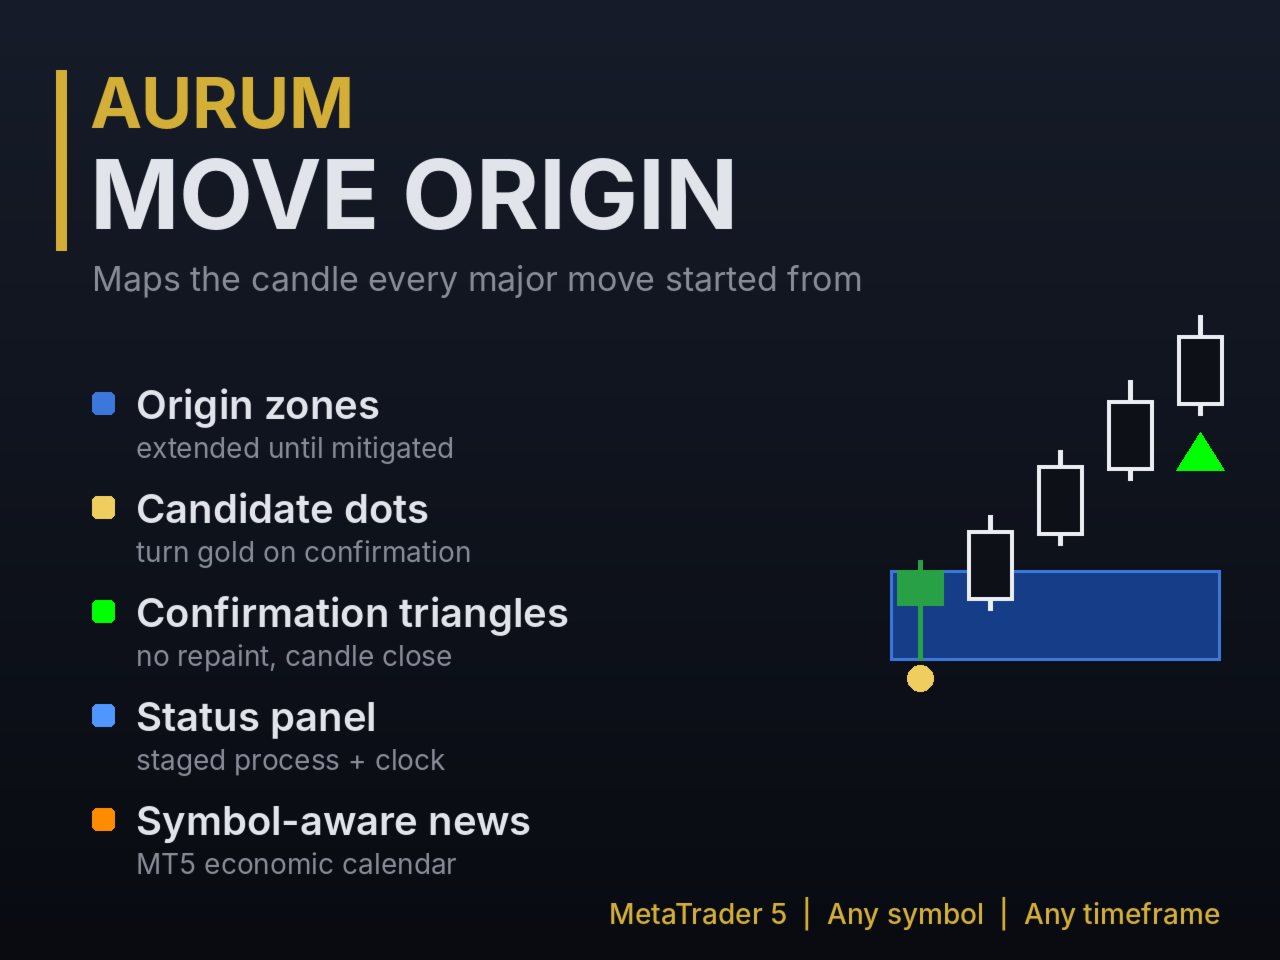
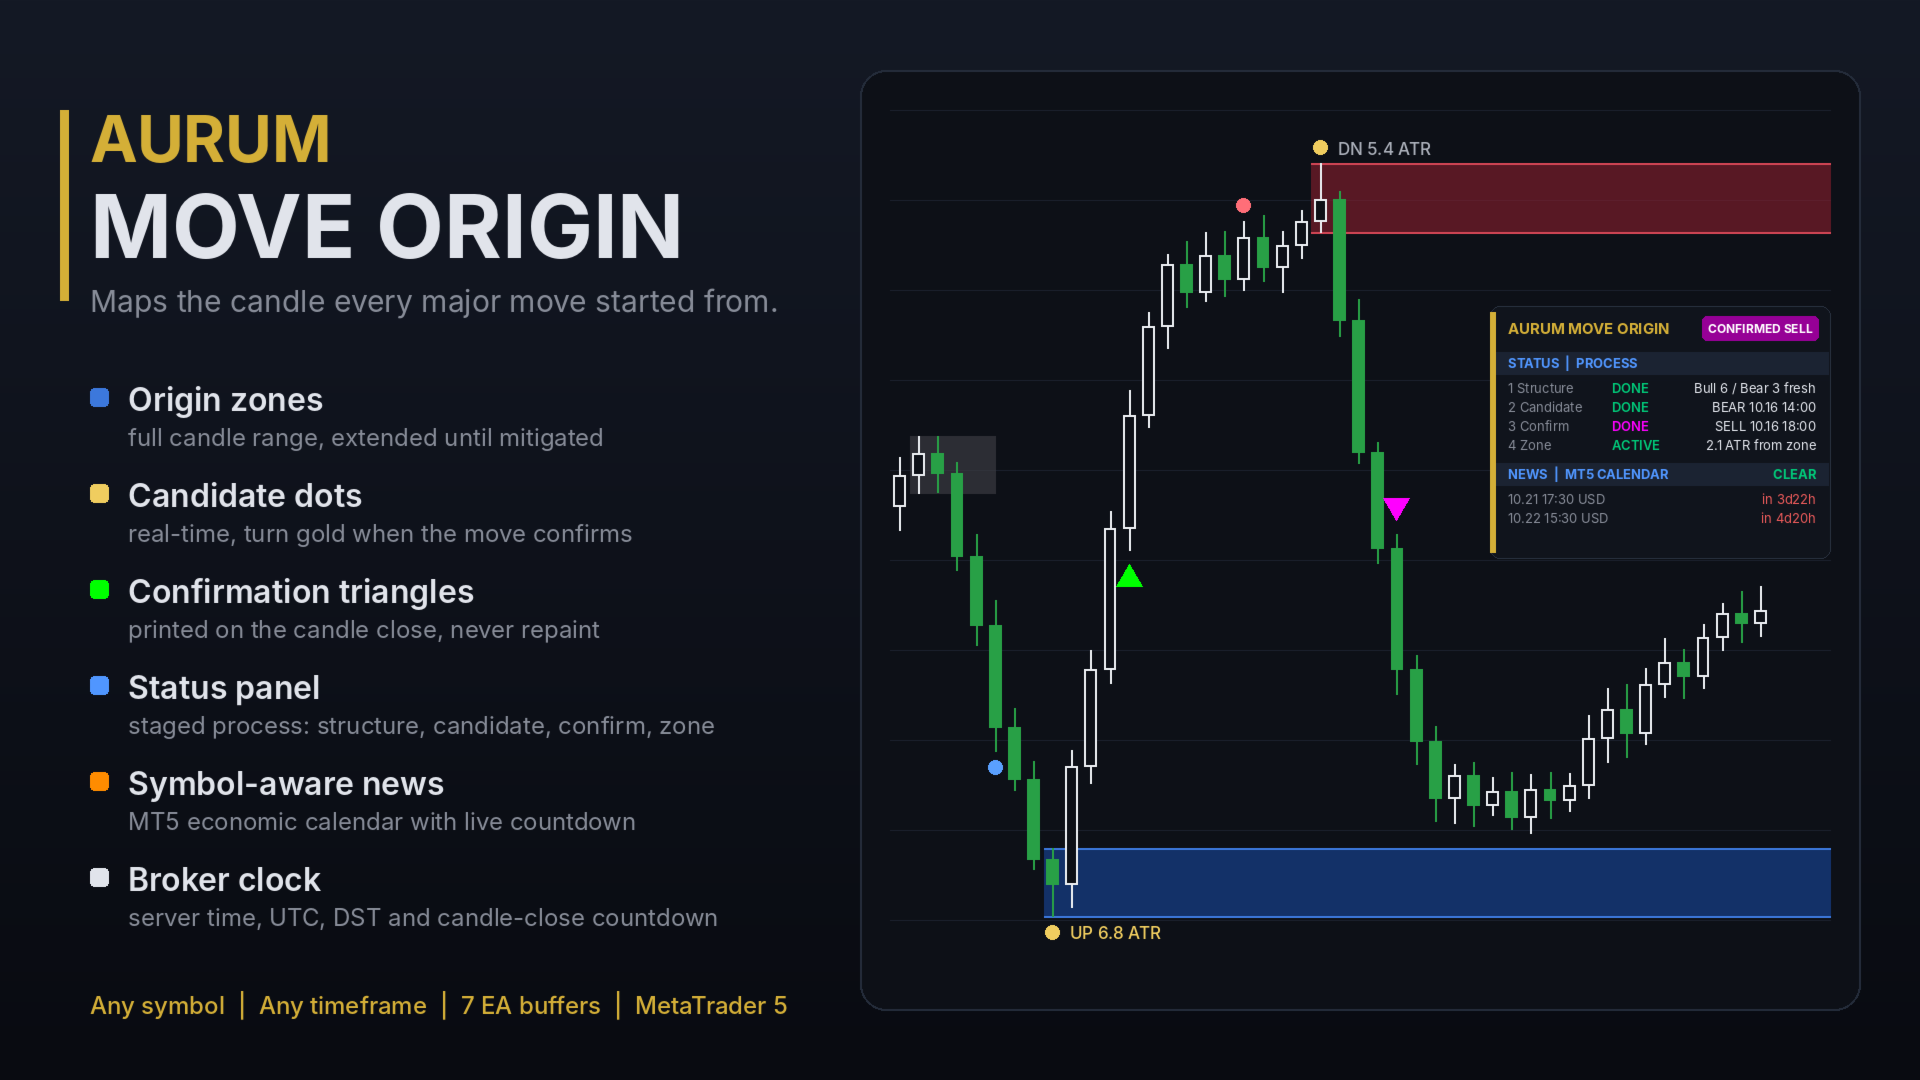
- Origin zones: where moves began.
- Candidate dots: candles showing early characteristics of a potential origin, flagged in real time.
- Confirmation triangles: the moment a move qualifies.
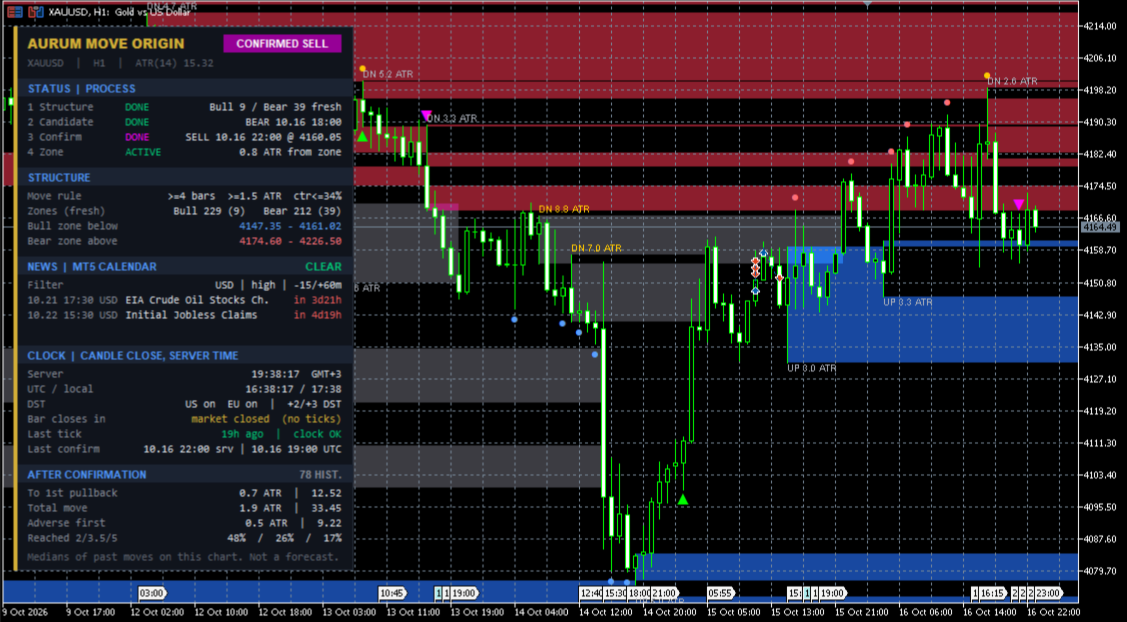
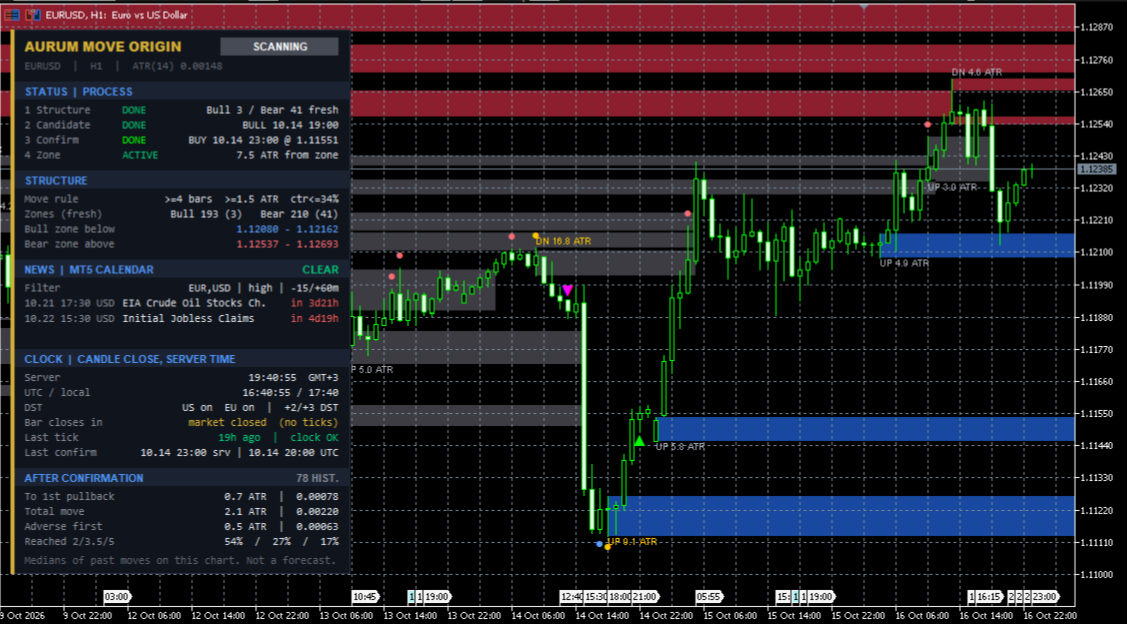
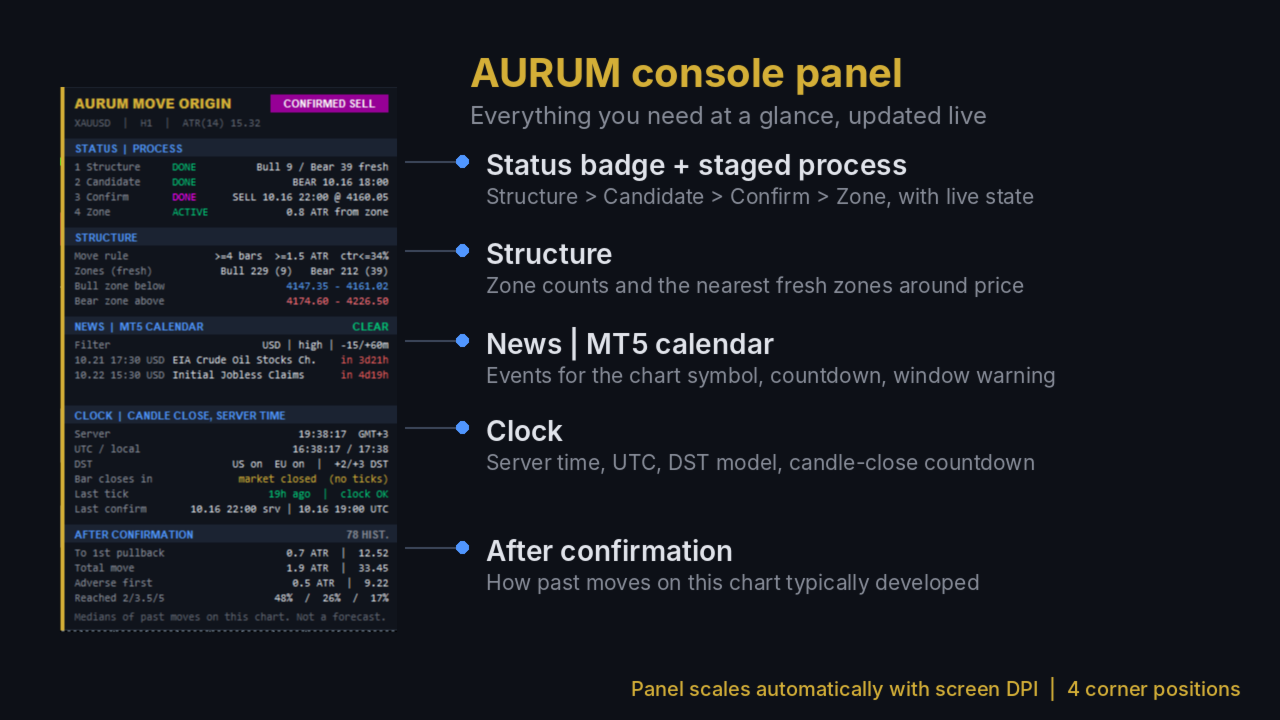
The AURUM console panel brings it together in clearly separated sections:
- Status badge: the current state at a glance (Confirmed, News Window, Candidate, In Zone or Scanning).
- Staged process: structure, candidate, confirmation and zone, with the live state of each stage.
- Structure: fresh zone counts and the nearest bullish and bearish zones around price.
- News: upcoming events from the MetaTrader 5 economic calendar, automatically matched to the chart symbol, with live countdowns and a news-window warning.
- Clock: broker server time, UTC, DST status, and a live countdown to the candle close.
- After confirmation: how moves on your chart have typically behaved after confirmation.
All confirmed elements are fixed once drawn. The indicator does not repaint.
It works on any symbol and timeframe: forex, metals, indices, commodities, crypto and shares. Every parameter is adjustable, and EA developers can read all signals and zone levels through indicator buffers.
AURUM Move Origin is a market-structure analysis tool, not a trading system. Use it alongside your own strategy and risk management.
Features
| Feature | What you get |
|---|---|
| Origin zones | The full range of the candle each major move started from, wicks included, extended right |
| Zone status | Fresh zones in colour; mitigated zones greyed or hidden |
| Candidate dots | Real-time markers on possible origin candles, turning gold when the move confirms |
| Confirmation triangles | Lime ▲ (bullish) and magenta ▼ (bearish) on the candle where a move qualifies |
| Zone labels | Direction and move size in ATR, or a detailed mode with candle characteristics |
| Status badge | Confirmed / News Window / Candidate / In Zone / Scanning |
| Staged process | 4 stages, each showing DONE, LIVE, WAIT, IN ZONE or ENDED with details |
| Structure summary | Zone counts and the nearest fresh zones above and below price |
| Symbol-aware news | MT5 economic calendar, filtered to the currencies that drive the chart symbol (e.g. XAUUSD shows USD, GER40 shows EUR) |
| News window | Configurable minutes before and after events, shown on the panel and badge |
| Broker clock | Server time and offset, UTC, DST model detection, candle-close countdown, clock check |
| Excursion profile | Typical run to first pullback, total move, adverse move, and how often moves reached 2, 3.5 and 5 ATR |
| No repainting | Confirmed zones and triangles never move or disappear |
| Alerts | Popup, sound, push and email for confirmations, zones, candidates and upcoming news |
| EA buffers | 7 buffers: zone levels, candidate direction, confirmation prices |
| Panel position | Any of the 4 chart corners |
If the MQL5 description editor doesn’t render tables, use the rows as a bullet list instead.
How to use
1. Read the structure
- Blue zones (bullish origins) below price show where buyers launched a move.
- Red zones (bearish origins) above price show where sellers did.
- The STRUCTURE section lists the nearest fresh zone on each side.
2. Follow the staged process
| Stage | What to watch |
|---|---|
| 1 Structure | How much fresh structure surrounds price |
| 2 Candidate | A LIVE candidate is an early alert, not a signal |
| 3 Confirm | DONE means the move qualified; the triangle prints and the dot turns gold |
| 4 Zone | ACTIVE, IN ZONE or ENDED tells you whether the new zone still holds |
3. Check the badge before acting
CONFIRMED marks a fresh confirmation. NEWS WINDOW means a high-impact event is close; many traders stand aside then.
4. Use zones for risk and targets
- The far side of a zone is a natural invalidation level.
- Opposing fresh zones are logical profit-taking areas.
- The excursion profile shows how far moves on this chart have typically run, to help set realistic targets.
5. Combine timeframes
Higher-timeframe zones give context; lower-timeframe confirmations help with timing.
6. Set alerts
Confirmation alerts are on by default. Enable zone, candidate or pre-news alerts as needed.
Key settings
| Setting | Default | Purpose |
|---|---|---|
| Min candles / min move (ATR) | 4 / 1.5 | How large a move must be to create a zone. Raise for fewer, larger zones |
| Max share of counter candles | 0.34 | How much pullback is allowed inside a move |
| Which candle to box | Immediate | Alternatives: opposite-colour only, or last opposite candle |
| Candidate filters | Standard | Raise the minimum score for fewer, stricter candidates |
| Zone ends when | Candle close | Or wick through, or never |
| News currencies | AUTO | Detected from the symbol, or enter your own list (e.g. USD,EUR) |
| News window | 15 min before / 60 min after | Period flagged as News Window |
| History depth | 5000 bars | More history gives a fuller profile; less loads faster |
Tips
- Hover over any zone or triangle for its details.
- More volatile instruments often benefit from a higher minimum move.
- The CLOCK section confirms your broker’s time offset and DST, so you can line up news times and candle closes.
- In the Strategy Tester the news section shows “n/a”, because the MT5 calendar isn’t available there.
Disclaimer: Trading involves substantial risk. This indicator provides market-structure analysis only and does not guarantee future results. The excursion profile reflects historical behaviour on the loaded chart and is not a forecast.