Volume Divergence MT4
- インディケータ
-
Ravi Shakya
 I’m Ravi Shakya, an MT5 developer with 5 years of trading experience in NEPSE and Forex. I use Smart Money Concepts (SMC) and price action to create simple and useful trading indicators, tools, and Expert Advisors.
 - バージョン: 2.10
- アクティベーション: 10
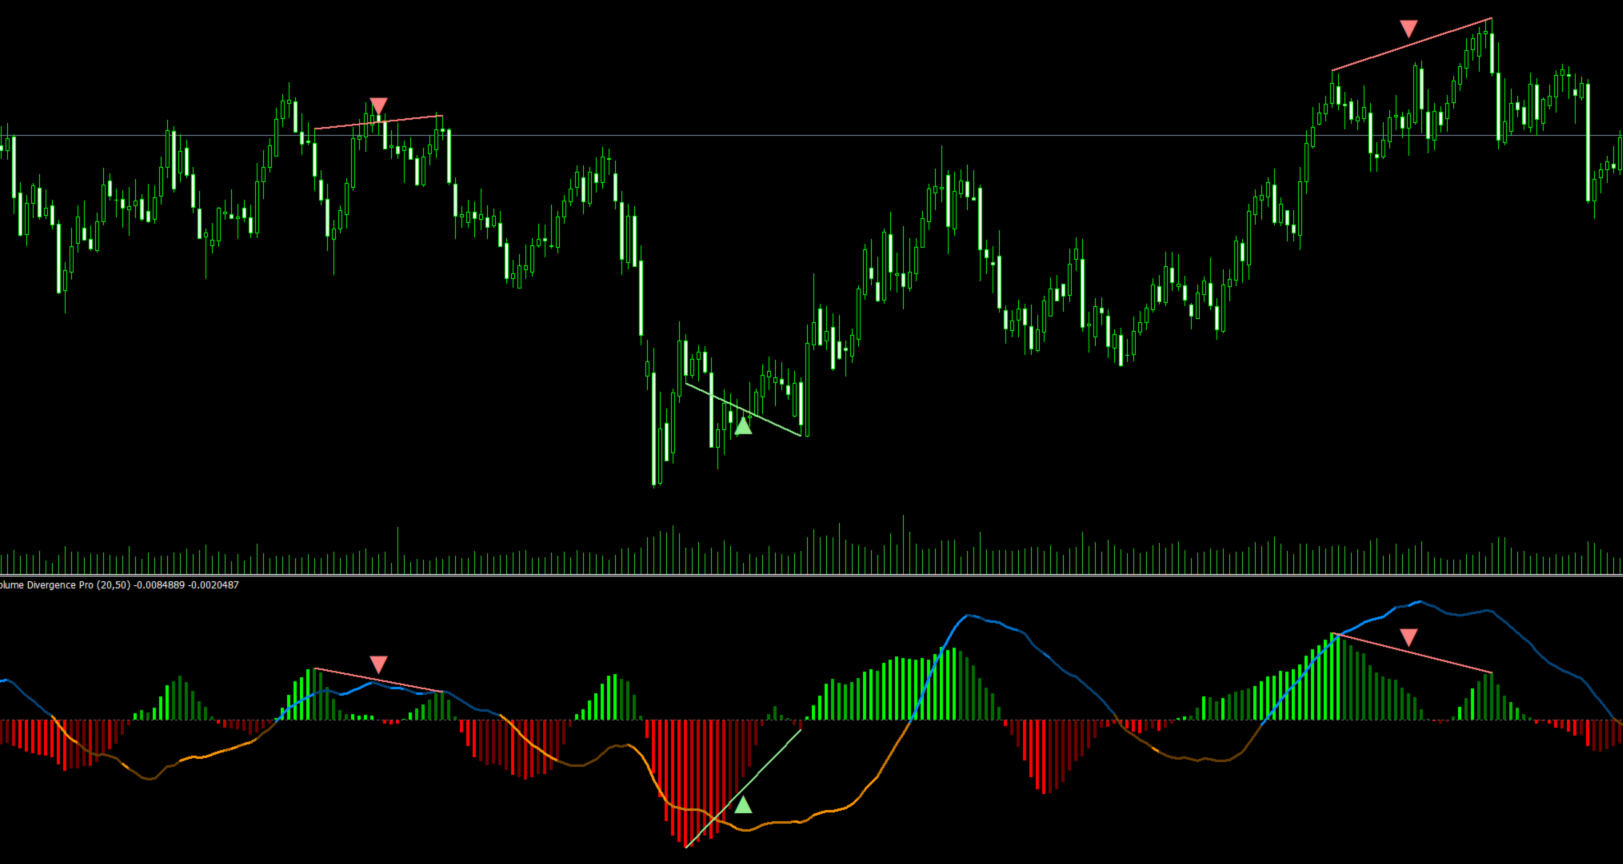
Volume Divergence Pro shows whether volume confirms the trend and marks regular and hidden divergences on price and indicator.
Volume Divergence Pro measures the direction of price with linear regression over a fast and a slow window, and checks whether trading volume is supporting that move or fading away from it. Swings in the indicator are compared with swings in price to find divergences, which are drawn both in the indicator window and directly on the candles.
How it works
The fast regression is shown as a column histogram and the slow regression as a line. Both are coloured by volume: each candle's tick volume is split into buying and selling participation based on its body and wicks, and the colour tells you whether participation in the current direction is building or fading.
When price makes a new swing high or low that the indicator does not confirm, a regular divergence is marked. When the indicator makes a new extreme while price does not, a hidden divergence is marked. Only the most recent divergences are kept on the chart, so it stays readable.
A divergence is confirmed a few bars after the swing forms (set by the swing size). Once drawn, it does not move or disappear.
Optional market structure filter
When enabled, the indicator tracks swing highs and lows on price and the last break of structure. Bullish divergences are shown only when structure is bullish, and bearish divergences only when it is bearish. Break of structure levels are drawn on the chart.
Optional continuation marks
When a divergence is filtered out because it goes against the structure, the indicator can watch it. If a later candle closes beyond that divergence, the warning has failed and the trend is continuing. That candle is marked.
Example of use
On EURUSD H1, the histogram turns weaker green while price makes a higher high, and a bearish divergence line appears. With the structure filter on and structure still bullish, that divergence is held back instead. If a later candle closes above it, a continuation mark appears and confirms the uptrend is intact.
Main settings
- Trend: fast and slow regression window.
- Divergence: regular, hidden, or both; swing size; number of divergences shown; colours.
- Market structure: filter on or off, structure swing size, show structure lines, line colours and style.
- Continuation: on or off, colours, alert.
- Drawings: show in indicator window, on the chart, or both; arrows and arrow size.
- Alerts: popup, sound, push notification, and email, for divergences and continuation marks.
- Colours of the columns and trend line can be changed.