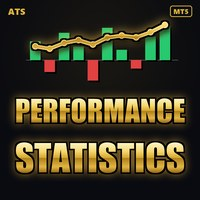
ATS Performance Statistics
- インディケータ
- バージョン: 1.0
- アクティベーション: 5

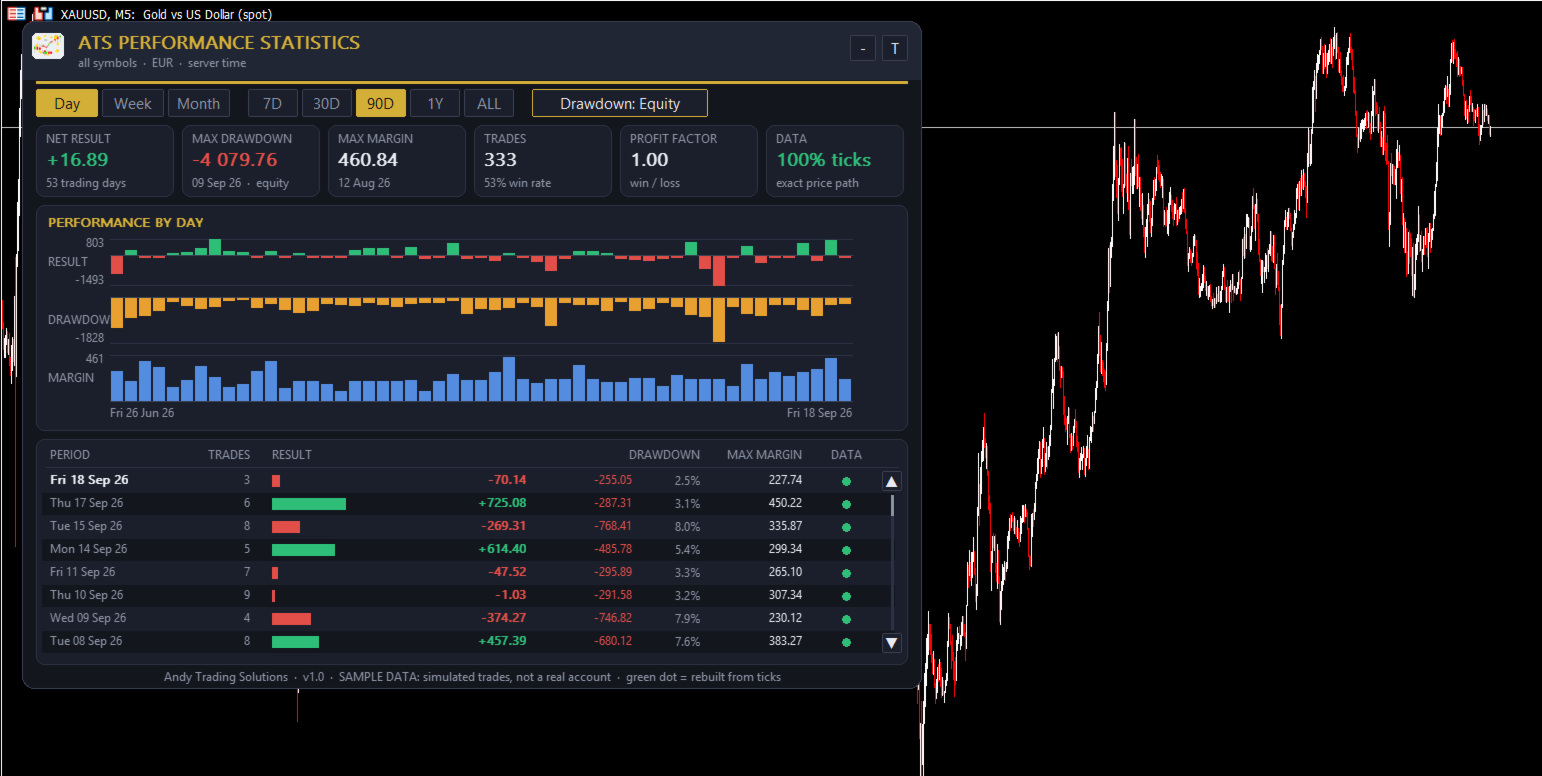
ATS Performance Statistics shows how your account really performed, day by day, week by week and month by month: profit and loss, worst drawdown and highest margin used. Bars and numbers, on a clean dashboard on your chart.
The part most statistics tools cannot do: the drawdown and the margin of days you never watched. The indicator rebuilds the equity path of every past day from your deal history and the broker's own tick history, following each position tick by tick, including trades that were open at the same time and hedged positions.
WHAT YOU SEE
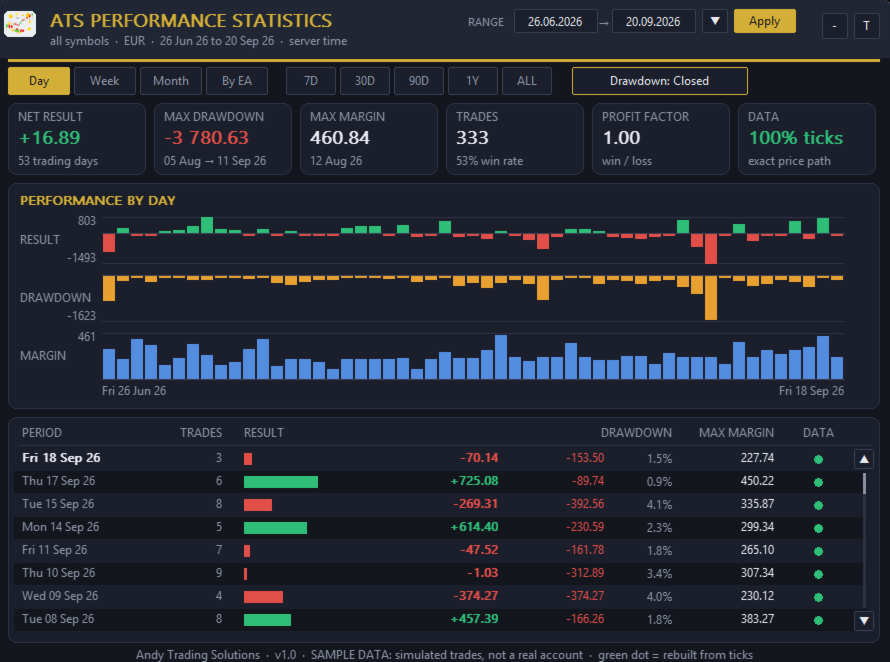
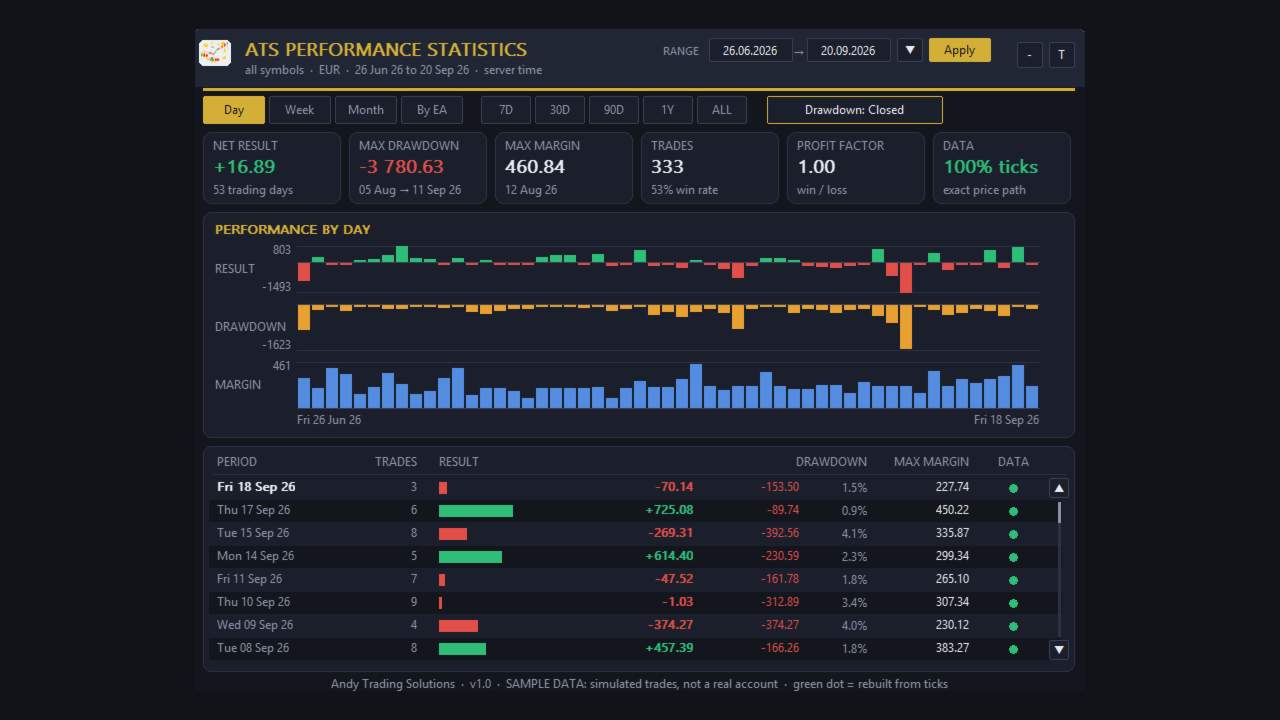
- Net result, max drawdown, max margin, number of trades, win rate and profit factor for the chosen period
- Three bar charts on one time axis: result, drawdown and margin
- Day, Week and Month views, each with a scrollable table
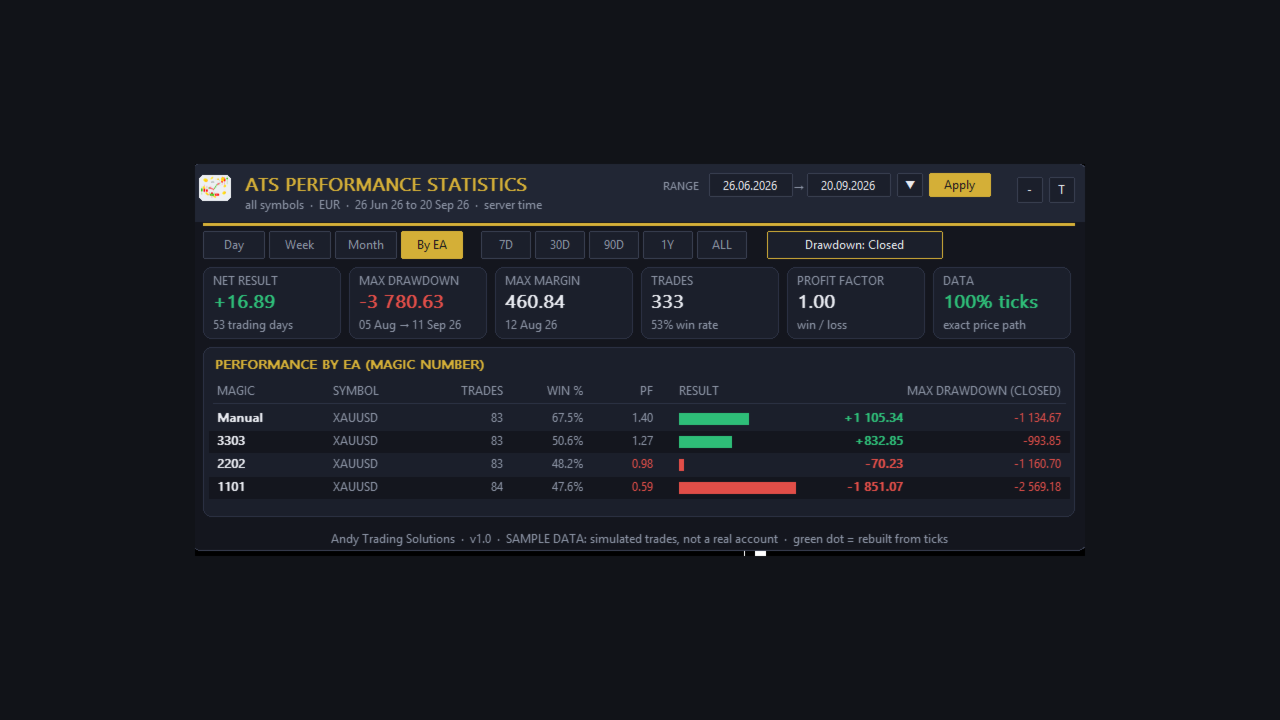
- By EA view: one row per magic number with symbol, trades, win rate, profit factor, result and drawdown, so you see which EA really earns and which one costs you money
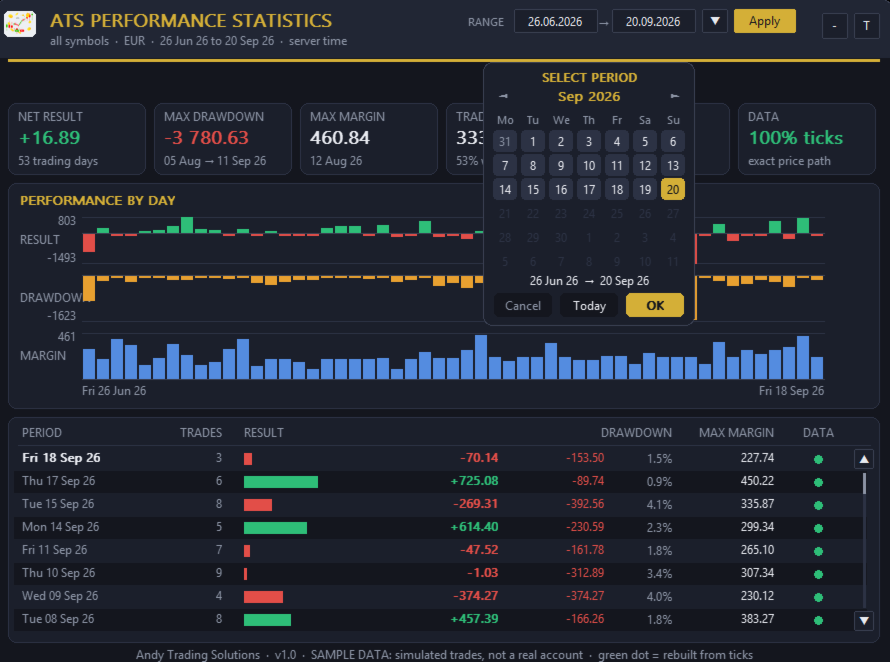
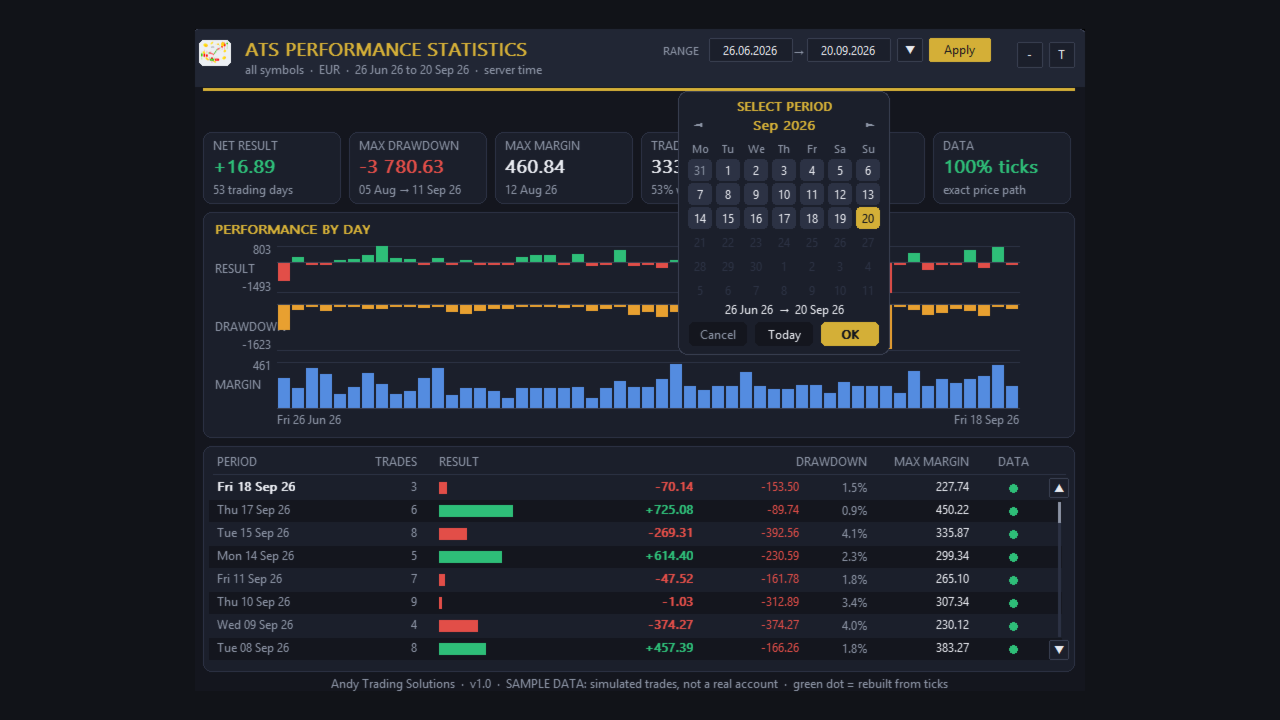
- Ranges: 7 days, 30 days, 90 days, 1 year, all history, or your own dates typed straight into the panel (from / to)
- Drawdown on equity (open trades included) or on closed trades only, switched with one button
- A quality dot on every row: green = rebuilt from real ticks, amber = estimated from M1 candles where the broker has no tick history
- Dark and light themes, draggable and collapsible panel
HOW THE NUMBERS ARE BUILT
- Result = profit + swap + commission (commission and swap can be switched off in the settings)
- Daily drawdown = the deepest fall of the equity from its own peak during that day
- Weekly and monthly drawdown = the deepest peak-to-trough fall across the whole period, not the sum of the daily ones
- Max margin = the highest margin the open positions needed during the day, computed from the symbol's contract size, the account leverage and the hedging rule of the account
- Days follow the broker server time
FILTERS
Choose the symbols (for example XAU*;EURUSD, empty = all symbols) and, if you like, a single magic number, so you can measure one EA or one market on its own.
GOOD TO KNOW (honest limits)
- The result of closed trades is exact: it comes straight from the deal history.
- Drawdown and margin of past days are a reconstruction. They are very close where the broker provides tick history (green dot) and only an estimate where it does not (amber dot). They are not the values the broker's server recorded at the time.
- Swap is booked by the broker when a trade closes, so it is counted on the closing day.
- Margin uses today's leverage and today's currency conversion.
- The first calculation of a long history can take a while; finished days are stored in a small cache file, so the next start is fast.
- The indicator reads the history only. It never opens, modifies or closes an order and needs no trading permission.
- Screenshots show simulated sample trades on real gold prices, not a live or demo account. They illustrate the dashboard, not a result.
SETTINGS
Symbols, magic number, include costs, range, custom from / to, view, drawdown basis, show panel, theme (dark / light / auto), panel position.
Works on any symbol and timeframe, on hedging and netting accounts.
Andy Trading Solutions