ATS Performance Statistics

  • 지표
  • Andrea Michelon
    Andrea Michelon
    • MQL5 Developer / Trading Systems 에  Indicator and EA developer
    • 이탈리아
    • 1311
    5 (2)
    Andrea (Andy), 이탈리아. 1990년대부터 독학한 프로그래머이며, 현재 Andy Trading Solutions (ATS) 이름으로 MetaTrader 5 도구를 개발합니다.
    제 원칙: 로직을 실제 데이터와 브로커의 실제 스프레드로 검증한 후에만 Market에 올립니다. 그리드, 마틴게일, 리페인트, 수익 약속은 없습니다. 통계가 약하면 제품 페이지에 그대로 씁니다.
    무료 도구
  • 버전: 1.0
  • 활성화: 5

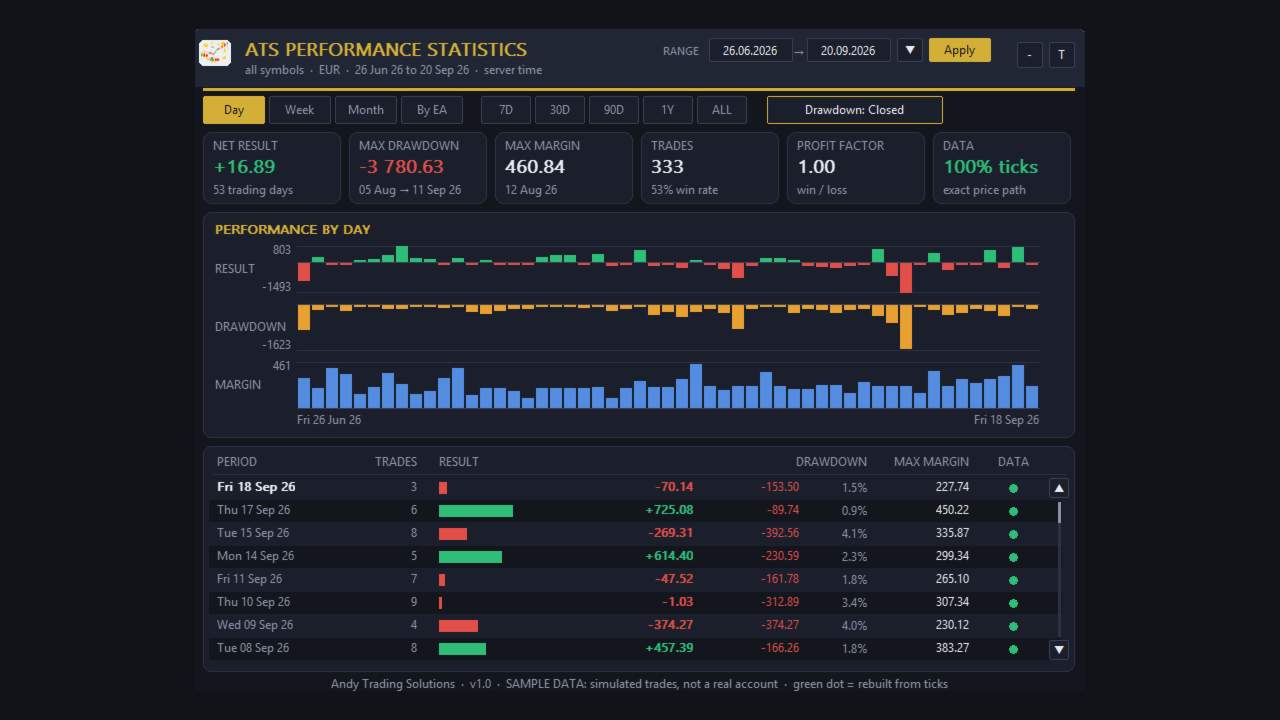
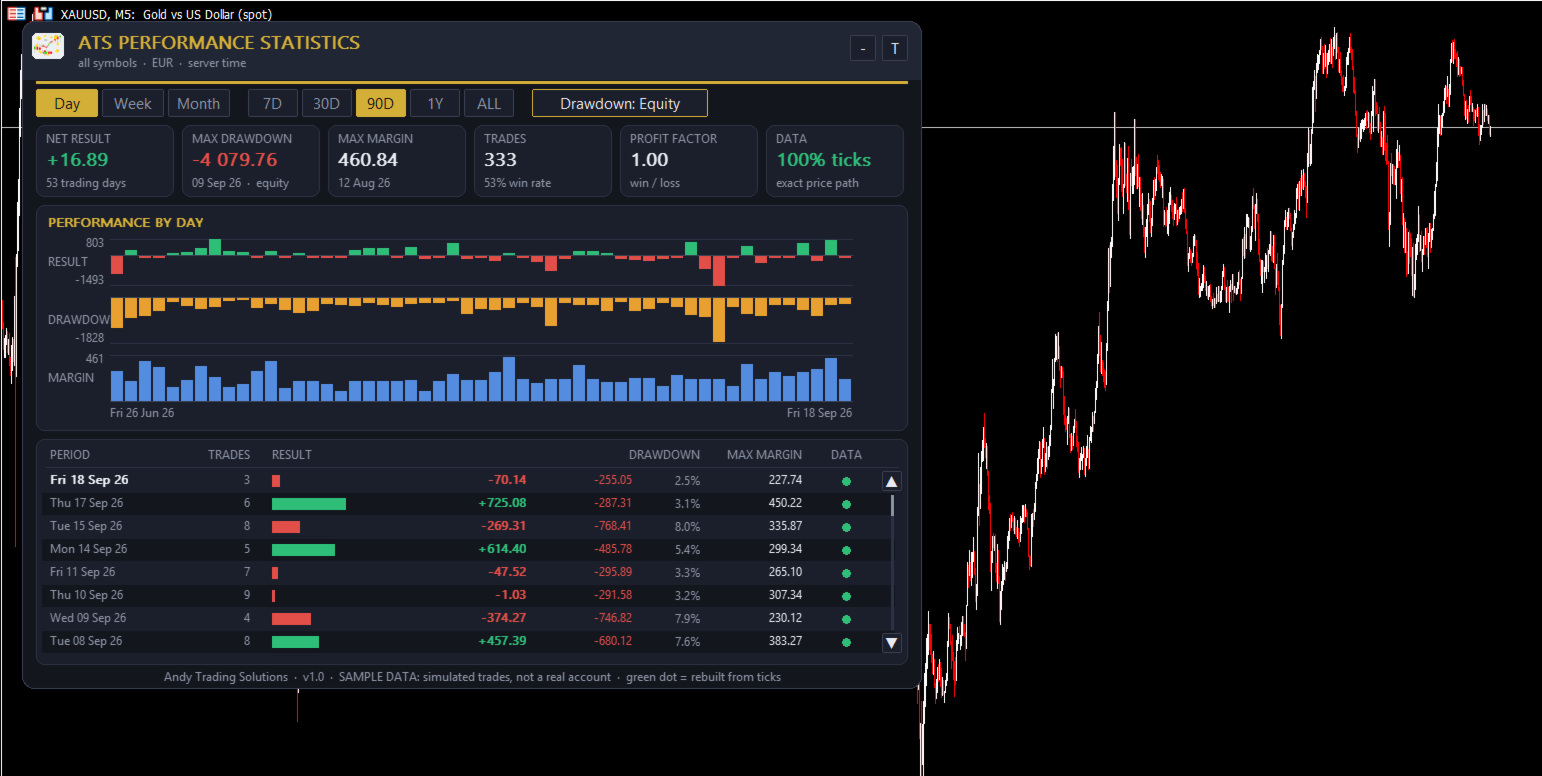
ATS Performance Statistics shows how your account really performed, day by day, week by week and month by month: profit and loss, worst drawdown and highest margin used. Bars and numbers, on a clean dashboard on your chart.

The part most statistics tools cannot do: the drawdown and the margin of days you never watched. The indicator rebuilds the equity path of every past day from your deal history and the broker's own tick history, following each position tick by tick, including trades that were open at the same time and hedged positions.

WHAT YOU SEE

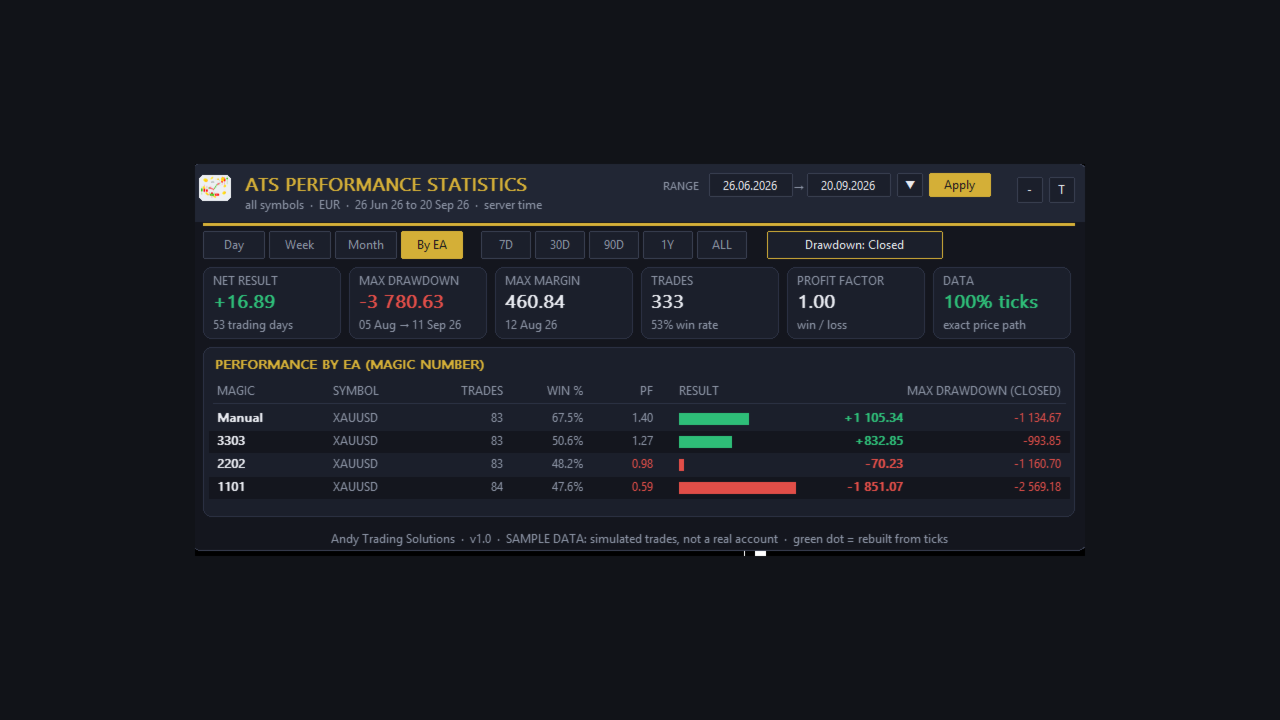
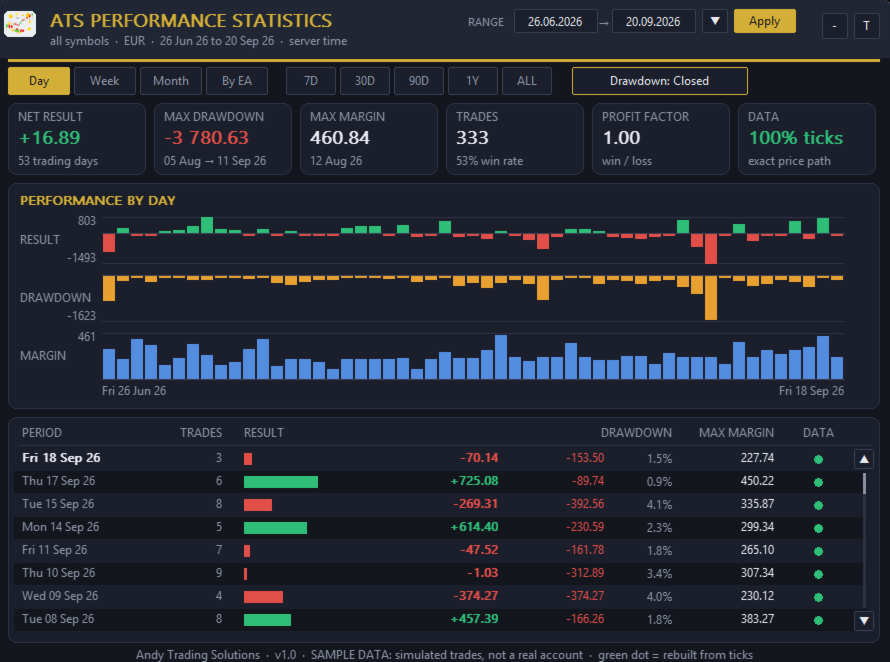
- Net result, max drawdown, max margin, number of trades, win rate and profit factor for the chosen period

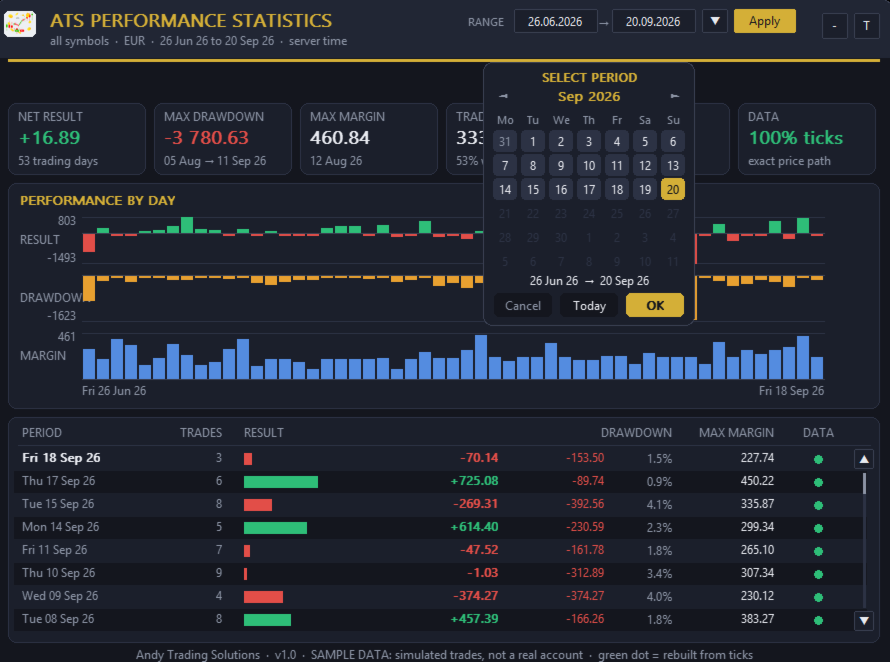
- Three bar charts on one time axis: result, drawdown and margin

- Day, Week and Month views, each with a scrollable table

- By EA view: one row per magic number with symbol, trades, win rate, profit factor, result and drawdown, so you see which EA really earns and which one costs you money

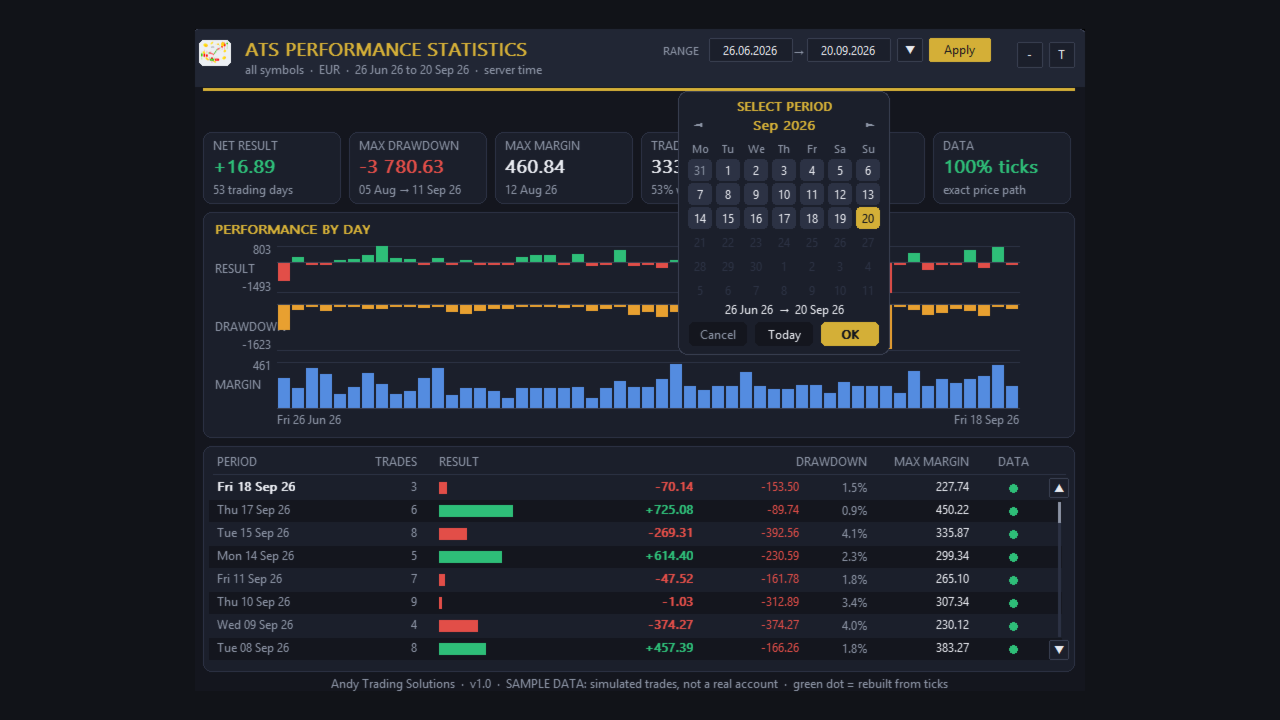
- Ranges: 7 days, 30 days, 90 days, 1 year, all history, or your own dates typed straight into the panel (from / to)

- Drawdown on equity (open trades included) or on closed trades only, switched with one button

- A quality dot on every row: green = rebuilt from real ticks, amber = estimated from M1 candles where the broker has no tick history

- Dark and light themes, draggable and collapsible panel

HOW THE NUMBERS ARE BUILT

- Result = profit + swap + commission (commission and swap can be switched off in the settings)

- Daily drawdown = the deepest fall of the equity from its own peak during that day

- Weekly and monthly drawdown = the deepest peak-to-trough fall across the whole period, not the sum of the daily ones

- Max margin = the highest margin the open positions needed during the day, computed from the symbol's contract size, the account leverage and the hedging rule of the account

- Days follow the broker server time

FILTERS

Choose the symbols (for example XAU*;EURUSD, empty = all symbols) and, if you like, a single magic number, so you can measure one EA or one market on its own.

GOOD TO KNOW (honest limits)

- The result of closed trades is exact: it comes straight from the deal history.

- Drawdown and margin of past days are a reconstruction. They are very close where the broker provides tick history (green dot) and only an estimate where it does not (amber dot). They are not the values the broker's server recorded at the time.

- Swap is booked by the broker when a trade closes, so it is counted on the closing day.

- Margin uses today's leverage and today's currency conversion.

- The first calculation of a long history can take a while; finished days are stored in a small cache file, so the next start is fast.

- The indicator reads the history only. It never opens, modifies or closes an order and needs no trading permission.

- Screenshots show simulated sample trades on real gold prices, not a live or demo account. They illustrate the dashboard, not a result.

SETTINGS

Symbols, magic number, include costs, range, custom from / to, view, drawdown basis, show panel, theme (dark / light / auto), panel position.

Works on any symbol and timeframe, on hedging and netting accounts.

Andy Trading Solutions
제작자의 제품 더 보기
ATS Fibonacci Golden Zones draws Fibonacci retracements the way a discretionary trader would, without the guesswork: it finds the last significant swing on your chart timeframe by itself and marks the levels that matter. No repaint. A swing high or low is accepted only after a fixed number of confirming bars on each side (8 by default). Once a swing is confirmed, the levels stay where they were. What you see on the chart: Automatic swing detection, with the A (impulse start) and B (impulse end)
FREE
ATS Gold Bias
Andrea Michelon
WHICH SIDE IS OPEN? You trade gold on M5 or M15, but the trend that matters is on H1. ATS Gold Bias puts the H1 picture on the chart you trade, so you never have to switch timeframes to know which side is open. THE H1 BIAS LINE The H1 EMA 50 drawn on your chart, bar by bar Green while the last closed H1 bar is above it: longs allowed Red while it is below: shorts allowed A dot where the bias turned, plus an optional popup or push alert THE PANEL The side that is open, and since when (date, hour
FREE
ATS Daily Volume Profile shows where the market actually traded today and yesterday: a horizontal volume histogram for each day, the POC (the most traded price) and the value area. WHAT YOU SEE - Daily volume profile for today and yesterday, drawn behind the candles - Heat colours: cold blue where little was traded, gold and red where most of the volume was - 3D depth shadow on every row (can be switched off) - POC as a thick gold line, value area high and low as dotted lines, rows outside the v
FREE
THE LOT FROM YOUR STOP. FREE. Picking a lot size by feel is how a normal loss becomes a bad day. ATS Lot Sizer puts two lines on your chart, a stop and a target. Drag them, and the panel tells you the lot size that fits your risk and the money that lot really puts on the line. One click sends the trade with the stop and target attached. HOW IT WORKS Pick LONG or SHORT. A stop line and a target line appear on the chart. Drag them. Lots = your risk (percent of balance, percent of equity, or a fixe
FREE
ATS Daily Performance shows your profit and loss day by day for the last 30 days, as bars and numbers on a compact dashboard on your chart. Open it and see at a glance which days made money, which lost, and how your month is going. WHAT YOU SEE - One bar per day: green for a winning day, red for a losing one - Net result of the last 30 days, today's result and the profit or loss of the trades still open - Win rate, winning days, profit factor, best day and worst day - The last 7 days listed wit
FREE
Andy Universal Sniper Pro
Andrea Michelon
5 (1)
STOP GAMBLING. START CALCULATING. Are you tired of messy charts, repainting indicators, and false signals that get you into trades when the market is flat? Andy Universal Sniper Pro is not the usual "magic" indicator. It is a complete Algorithmic Trading System designed for manual scalping on Gold (XAUUSD), Indices, and Forex. The philosophy is simple: Cleanliness and Precision. The indicator hides background noise and shows you only two things: WHERE TO GO (The Map): Automatically draws Sup
Title: Gold Liquidity Matrix - SMC & Z-Score Volume Description: Most SMC (Smart Money Concepts) indicators fail for one simple reason: they draw too many zones, creating market noise and confusion. Gold Liquidity Matrix (GLM) is different. It is a pragmatic, quantitative hybrid trading system built specifically for XAUUSD. It does not just look at price action; it combines Institutional SMC with advanced Z-Score Volumetric Analysis to filter out fake moves and highlight only the zones where tru
ATS Indicator
Andrea Michelon
AndyTrading SMC - Professional Market Structure & Order Blocks Stop chasing price. Start reading institutional footprints. In trading, simplicity is the ultimate sophistication. While other indicators clutter your chart with incomprehensible acronyms, AndyTrading SMC speaks the language of profit: Continuation or Reversal. AndyTrading SMC is an institutional-grade indicator designed to isolate real market moves, automating Price Action analysis and identifying high-probability liquidity zones.
ATS Gold Command
Andrea Michelon
ATS Gold Command is an all-in-one decision-support indicator for XAUUSD. It was built with a simple philosophy: only include tools whose rules survived systematic backtesting and walk-forward validation on two years of Gold data. Everything works on closed bars only - no repainting, no signal that appears and then disappears. WHAT YOU GET - 5 MODULES IN ONE PANEL 1. SESSION EDGE WINDOWS (A/B/C badge) The indicator grades the trading day for Gold. Window A = London hours on M15. Window B = New Yo
ATS Fibonacci Zones Multi Timeframe finds the last significant swing by itself, draws the retracement levels that matter as zones, and tells you how many lots your stop allows. It is the full edition of the free ATS Fibonacci Golden Zones. No repaint. A swing high or low is only accepted after a fixed number of confirming bars on each side (default 8). Once a swing is confirmed it stays where it was: levels never move backwards to fit the chart. MULTI-TIMEFRAME SWING Take the swing from a higher
Every trading session leaves a high and a low, and those two prices become the liquidity targets of the following hours. ATS Killzones Liquidity Statistics draws them for you and, above all, tells you how often they are really taken, so you know whether you are looking at a target or at a wall. WHAT IT DRAWS - Session boxes (killzones) for Asia, London, New York AM and New York PM, with times set in GMT. The broker server offset is detected automatically, or you can set it by hand - The high and
ATS Volume Profile Statistics shows where the market actually traded, day by day, and measures how the key volume levels behaved on YOUR symbol and broker. It is the full edition of the free ATS Daily Volume Profile. WHAT YOU SEE - Daily volume profiles for the last 1 to 30 days, drawn behind the candles - Heat colours: cold blue where little was traded, gold and red where most of the volume was - 3D depth shadow on every row (can be switched off) - POC (most traded price) as a thick gold line,
ATS Gold Grade
Andrea Michelon
SIX CHECKS. ONE GRADE. Most breakout signals on gold lose money. This one is graded. Every XAUUSD breakout on M15 is scored against six objective checks and gets a grade: A, B or C. You see the full trade plan (entry, stop, target, lot size), the six checks one by one, and how every past signal ended, written on your chart. WHY A GRADE We tested the same breakout on XAUUSD M15, May 2024 to September 2026, with the broker's real spread, a 2R target and one position at a time per grade, the same w
SIZE FROM THE STOP. LOCK THE DAY. Most losing days do not start with a bad setup. They start with a lot size picked by feel, then a second trade to win the first one back. ATS Risk Desk sizes every trade from your stop, sends it in one click, manages it, and locks you out when the day's limit is gone. HOW IT WORKS Pick LONG or SHORT. A stop line and a target line appear on the chart. Drag them. Lots = your risk (percent of balance, percent of equity, or a fixed sum) divided by the stop distance,
필터:
리뷰 없음
리뷰 답변