ATS Round Number Cascade Stats

  • インディケータ
  • Andrea Michelon
    Andrea Michelon
    • MQL5 Developer / Trading Systems において  Indicator and EA developer
    • イタリア
    • 2051
    5 (3)
    Andrea(Andy)、イタリア。1990年代から独学のプログラマーで、現在は Andy Trading Solutions (ATS) の名前で MetaTrader 5 用ツールを開発しています。
    私のルール:ロジックを実データとブローカーの実際のスプレッドで検証してから Market に公開します。グリッドなし、マーチンゲールなし、リペイントなし、利益の約束なし。統計が弱い場合は製品ページにそう書きます。
    無料ツール
  • バージョン: 1.0
  • アクティベーション: 5

ATS Round Number Cascade Stats は、お使いのブローカーの価格履歴を使い、ご自身のシンボルで価格がキリ番(ラウンドナンバー)を通過した後にどう動いたかを測定します。結果はチャートの隅のパネルに表示され、レベルはチャート上に線で描かれます。

多くのトレーダーはキリ番を反応しやすい価格帯として注目しています。このインジケーターは、それが意味を持つとは仮定しません。通過のたびに何が起きたかを数え、ランダムに選んだレベルと比較します。

測定内容

  • 直前の 3 時間に価格が反対側で少なくとも 1 ATR 離れていて、その後通過していない状態での、キリ番レベルの最初の通過。このようなレベルを "armed" と呼びます。
  • ATR は Average True Range の略で、15 分足 1 本の典型的な大きさです。すべての距離をこの単位で表すため、異なるシンボルを比較できます。
  • 通過から 15 分、30 分、60 分後の価格の位置(通過方向で測定)。
  • 価格が逆方向に 1 ATR 動く前に、通過方向へ 1 ATR 動いた頻度。
  • ランダムなレベルについての同じ数値:レベルの格子を毎日ステップのランダムな割合だけずらした 5 種類のセット。
  • 60 分時点でのキリ番とランダムレベルの差の t 統計量(通過を日ごとにまとめて計算)。t 統計量は差をその通常のばらつきと比べたものです。ゼロから離れるほど(どちらの方向でもおよそ 2 以上)、差は偶然のばらつきには見えにくくなります。レベルで取引できることを証明するものではありません。

パネル上部の判定

  • LEVELS MATTER:t が 2 以上。通過後、価格はランダムレベルより通過方向へ遠くまで動きました。
  • NO MEASURABLE EFFECT:t が -2 から 2 の間。キリ番はランダムレベルと同じように振る舞いました。
  • LEVELS REJECT:t が -2 以下。通過後、価格は平均してランダムレベルより通過方向への動きが小さくなりました。
  • SAMPLE TOO SMALL:通過が 60 回未満でした。より長い履歴か、より小さいステップを使ってください。

結果はシンボル、ステップ、期間によって変わります。すべての数値は過去を表すもので、予測でも取引結果でもなく、スプレッドやその他のコストは含みません。

表示内容

  • 価格の上下に描かれるキリ番レベル(armed レベルは強調表示)
  • 上方向と下方向の通過を分けた統計
  • 15 分、30 分、60 分時点でのキリ番とランダムレベルの比較バー
  • 通過回数、対象年数、ステップ、基準足(5 分足または 1 分足)、ATR に対する典型的なスプレッドの割合
  • armed レベル通過時のアラートとプッシュ通知(任意)。アラートは 60 回以上の通過が測定されてから始まります。

注意事項

  • このインジケーターは注文を発注・変更・決済することはありません。売買シグナルも出しません。
  • 統計には長い履歴が必要です。ターミナルの "Max bars in chart"(Tools > Options > Charts)を大きな値に設定してください。
  • 数値はお使いのブローカーの過去データによるものです。ブローカーや期間が違えば数値も変わります。
  • 統計には確定した足のみを使います。アラートは現在の足に反応します。
  • 同じ足の中で +1 ATR と -1 ATR の両方に触れた場合は、逆方向として数えます。60 分以内にどちらにも届かなかった通過は、どちらのグループにも数えません。
  • 重い計算は起動時に行い、その後は 7 日ごとに行います。
  • 測定した各通過をカンマ区切りのテキストファイル(CSV、Common\Files フォルダー)に書き出すことができ(任意)、ご自身で数値を確認できます。
  • ご自身の EA(Expert Advisor)用に読み取り専用バッファーが 2 つあります:バッファー 0 = t 統計量(通過 60 回未満では空)、バッファー 1 = 通過回数。

設定

キリ番のステップ(0 = 自動、価格のおよそ 1.2%)、統計用の基準時間足、最大足数、上下に描くレベル数、アラートとプッシュ通知、レベルの色、カンマ区切りテキストファイルへの書き出し、パネルのサイズと位置。

すべてのシンボルと時間足で動作します。パネルサイズ 0.6〜1.2(既定値は約 330 x 575 ピクセル)、位置は入力パラメーターで設定します。

Andy Trading Solutions

おすすめのプロダクト
インディケータは現在のクオートを作成し、これを過去のものと比較して、これに基づいて価格変動予測を行います。インジケータには、目的の日付にすばやく移動するためのテキスト フィールドがあります。 オプション: シンボル - インジケーターが表示するシンボルの選択; SymbolPeriod - 指標がデータを取る期間の選択; IndicatorColor - インジケータの色; HorisontalShift - 指定されたバー数だけインディケータによって描画されたクオートのシフト; Inverse - true は引用符を逆にします。false - 元のビュー。 ChartVerticalShiftStep - チャートを垂直方向にシフトします (キーボードの上下矢印)。 次は日付を入力できるテキストフィールドの設定で、「Enter」を押すとすぐにジャンプできます。
Deriv Synthetic HTF Candle Projection GMT2 Higher Timeframe Candle Projection & Previous Levels Tool for Deriv Synthetic Indices (MT5) Overview Deriv Synthetic HTF Candle Projection GMT2 is a professional MetaTrader 5 indicator built specifically for Deriv Synthetic indices . It projects the current forming Higher Timeframe (HTF) candle onto the chart and automatically draws key reference levels from previous candles. This indicator is designed to help traders maintain higher timeframe context
FREE
Smart Volume Profile
Mattia Impicciatore
4.73 (15)
Smart Volume Profile は、2 本の縦線の間で出来高分布をリアルタイムに計算・表示するプロフェッショナルなインジケーターです。買いと売りを分割表示し、POC・VAH・VAL レベルも描画します。裁量取引にもシステム取引にも対応し、市場がどの価格帯で最も多く取引されたか、そして買い手と売り手の力関係がどのように分布しているかを確認できます。 このインジケーターを選ぶ理由 分析期間を完全にコントロール — 2 本のドラッグ可能な VLINE で範囲を定義。 買いと売りの分割表示 — 専用カラーでどちらが主導しているか一目で把握。 POC・VAH・VAL の機関投資家レベル — 明確に描画され常に更新。 最適化されたパフォーマンス — ティックデータを使用し、利用できない場合はスマートな代替処理。 アダプティブ表示 — プロファイル幅をチャートサイズに比例させて高い可読性を維持。 動作方法 VP begin と VP finish という 2 本の VLINE を描画して時間範囲を設定します。インジケーターは価格レベルごとの出来高を、設定可能な数のバケットに集計します。取引
FREE
MultiSession Volume Profile is a professional volume profile indicator for MetaTrader 5 that builds separate POC, VAH, VAL and volume histograms for multiple custom trading sessions on the same chart. It helps you see where volume truly concentrated in each part of the day (RTH, Globex, Asia, London, etc.), so you can identify key intraday levels, ranges, and magnets that many standard tools miss. ​ Main advantages Multi-session profiles Build up to 5 fully independent sessions with custom times
Smart Currency Strength is a powerful yet simple indicator that measures the strength of individual currencies. It features a graphic panel that lists the main currencies and their strength in each timeframe, ranging from 0 (most oversold) to 100 (most overbought). The strength for all currencies in the current timeframe is also shown in a separate window as a multi-line graph, where each currency is represented with a different color, this allows you to monitor the evolution of strength trend
VR Grid Mt5
Vladimir Pastushak
3 (9)
VR グリッド インジケーターは、ユーザー定義の設定を使用してグラフィカル グリッドを作成するように 設計 されています。 標準グリッド とは異なり、VR グリッドは 円形レベル を構築するために使用されます。ユーザーの選択に応じて、ラウンド レベル間のステップは任意に設定できます。さらに、他のインジケーターやユーティリティとは異なり、VR Grid は期間が変更されたり、端末が再起動されたりした場合でも、 グリッドの位置を維持 します。 設定、設定ファイル、デモ版、説明書、問題解決方法は、以下から入手できます。 [ブログ] レビューを読んだり書いたりすることができます。 [リンク] のバージョン [MetaTrader 4] 垂直レベル は実際の時間間隔に基づいており、 欠落している または存在しない期間は無視します。したがって、レベル間のステップは、ユーザーが選択した値に厳密に対応します。 VR グリッド インジケーターを使用すると、トレーダーは任意のレベルで 垂直線と水平線のスタイル 、色、太さを変更できます。これにより、金融商品の ラウンドレベル を制御できます。 ラウンド
FREE
NeuronQuant is a premium quant analytics indicator for MetaTrader 5 from Neuron Systems. It reads the chart with the kind of statistical tools common in quantitative analysis: a forward expected-move range, realized volatility, a market-regime read and a standardized z-score. It is an indicator for chart analysis only: it does not place, modify or close trades, it does not send orders, and it does not manage positions or accounts. Native MQL5, no DLLs, non-repainting closed-bar logic. Works on a
Moving Spread
Jose Maria Molina Sanchez
Moving Spread – リアルタイム市場コストモニター 平均スプレッドをリアルタイムで監視し、高コスト期間の取引を回避します。 このインジケーターの機能 Moving Spread は、時間の経過とともに市場の 平均スプレッド(ポイント単位) を測定し、その変化を示します。これは、エントリー時のコストが高すぎる場合を把握するのに不可欠なツールです。このような状況では、取引開始前から利益が損なわれる可能性があります。 なぜこれが重要ですか? スプレッドが高いということは、市場への出入りに多くの費用がかかることを意味します。このインジケーターは、こうした瞬間を特定し、コストが高すぎるときに取引を避けるのに役立ちます。 動作方法 現在のスプレッドを別ウィンドウに表示 します。赤いラインが平均値を表しています。 スプレッドが設定されたしきい値(例:> 0)を超えると、 自動アラート を表示します。 スキャルパーおよびデイトレーダーに最適 です。これにより、「ブリーディング」(継続的な損失)による隠れた損失を回避できます。 実際の例 添付画像のように、資産や時間
FREE
Price Magnet — Price Density and Attraction Levels Indicator Price Magnet is a professional analytical tool designed to identify key support and resistance levels based on statistical Price Density. The indicator analyzes a specified historical period and detects price levels where the market spent the most time. These zones act as “magnets,” attracting price action or forming a structural base for potential reversals. Unlike traditional Volume Profile tools, Price Magnet focuses on price-time d
SMART EXIT Currency Strength Meter is a professional Forex currency strength indicator designed to identify the strongest and weakest currencies in real time. The indicator analyzes 27 major Forex pairs and ranks the 8 major currencies according to their relative strength. By combining EMA momentum analysis with volatility-adjusted calculations, traders can quickly identify market leaders and laggards without manually reviewing dozens of charts. Main Features • Real-time ranking of the 8 major c
EUR/USD Trade Plan Assistant Manual EUR/USD entry and risk-planning indicator for MetaTrader 5. It displays confirmed trade plans with entry, stop, target, position volume, time limit and combined account risk in a clear chart interface. Product description EUR/USD Trade Plan Assistant is designed for traders who want structured EUR/USD trade plans without automatic order execution. The indicator continuously evaluates EUR/USD and can display up to three independent trade plans based on differen
Candle Time Phases Et Indicator - Split any candle into three time-based phases and control the sequential development of the candle in real time. Candle Time Phases is a precision timing indicator that divides the current candle into three time-based phases as a percentage of its total duration. The indicator determines and clearly separates the initial uncertainty phase, the main movement, and the completion phase, while also analyzing the structure and sequential development of the candle in
FREE
Metis Hurst Regime — is the market trending, mean-reverting or just random? This indicator estimates the Hurst exponent of the recent price series — a statistical measure of memory. It tells you whether moves have tended to continue (trending), to reverse (mean-reverting) or to show no memory at all (random walk), and how much confidence that reading deserves. Knowing the current regime helps you choose the right kind of strategy: trend-following logic suffers in mean-reverting conditions and vi
FREE
Koryu Delta Koryu DeltaはMetaTrader 5のインジケーターです。ピボットポイント分析とデルタボリュームデータを用いてトレンドの反転ポイントを特定します。マーケットシフトパターンを検出し、市場の動向に基づいたシグナルを表示します。このツールは、スキャルピング、スイングトレード、または長期投資を行うトレーダーにご利用いただけます。最大500本のヒストリカルバーを分​​析し、過去のパターンを見つけ出します。シグナルにはクローズドバーロジックを採用しています。 Koryu Deltaの機能 パターン検出:ピボット分析を用いて、強気と弱気のマーケットシフトパターンを特定します。 デルタボリューム分析:ティックボリュームとローソク足構造を用いて、買い圧力と売り圧力を表示します。デルタ表示は調整可能です。パターン範囲内の各ローソク足のボディサイズ、ウィック比率、ティックボリュームを検証することでデルタを計算します。 サポートレベルプロット:検出されたパターンのサポートレベル(エントリー、ストップロス(SL)、3つのテイクプロフィット(TP)レベル)を描画します。それ
FREE
Introducing the “Symbol Cost Info MT5” indicator – your ultimate tool for staying ahead in the forex market! This innovative indicator is designed to empower traders with real-time cost information, directly on their charts. Here’s why every trader needs the “Symbol Cost Info MT5” in their arsenal: Real-Time Spread Monitoring : Keep a close eye on the spread for any currency pair, ensuring you enter the market at the most cost-effective times. Pip Value at Your Fingertips : Instantly know the v
FREE
Paid release: Cumulative Delta Flow MT5 is a paid MetaCoderStore indicator. Use the product comments for setup questions, feature requests, and feedback for future updates. Cumulative Delta Flow MT5 is a separate-window tick-volume flow oscillator for MetaTrader 5. It estimates signed buying and selling pressure from candle position, candle direction, and tick volume, then plots a cumulative delta line with a signal line and divergence markers. Use it to spot: Positive and negative tick-volume p
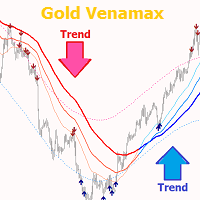
Gold Venamax - これは最高の株式テクニカル指標です。 指標アルゴリズムは資産の価格変動を分析し、ボラティリティと潜在的なエントリーゾーンを反映します。 インジケーターの機能: これは、快適で収益性の高い取引のためのマジックとトレンド矢印の 2 つのブロックを備えたスーパー インジケーターです。 チャート上にブロックを切り替えるための赤いボタンが表示されます。 マジックはインジケーター設定で設定されているため、異なるブロックを表示する 2 つのチャートにインジケーターをインストールできます。 Gold Venamax は、異なる矢印バッファー (GV と SD) を備えた 2 つのチャートに配置できます。 これを行うには、設定で異なる Magic を選択する必要があります。たとえば、あるマジック = 999、別のマジック = 666 を選択します。次に、チャート上の赤いボタンで矢印バッファを選択できます。 インジケーター設定の各矢印バッファー (GV および SD) には、快適で収益性の高い取引のための個別の矢印フィルターがあります (UseFiltrGV = true;
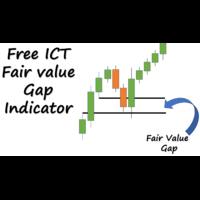
An ICT fair value gap is a trading concept that identifies market imbalances based on a three-candle sequence. The middle candle has a large body while the adjacent candles have upper and lower wicks that do not overlap with the middle candle. This formation suggests that there is an imbalance where buying and selling powers are not equal. Settings Minimum size of FVG (pips) -> FVGs less than the indicated pips will be not be drawn Show touched FVGs Normal FVG color -> color of FVG that hasn't
FREE
This is a multi timeframe version of the  Supply and Demand indicator . It allows you to analyze a chart using the law of supply and demand on three different timeframes at a time. You will see zones of sales and purchases and determine the most profitable points to open positions. The indicator is based on the principle of market fractality. Supply and demand zones show places where a strong buyer or seller has made the price reverse and change its direction. The indicator has several types of
FREE
Professional Overview: AMD MODEL PRO PLUS v4 + Uptrick Flow Expansion Trend (Combined) Executive Summary This is an institutional-grade trading indicator that merges two powerful methodologies into a single, dual-confirmation system: · AMD Model Pro Plus v4 - ICT-style Power of 3 (PO3) session-based market structure analysis · Uptrick Flow Expansion Trend - Adaptive flow midline with trend detection The combination creates a system where macro session structure (AMD) aligns with micro price
The   Pairs Spread indicator   has been developed for the popular strategy known as pairs trading, spread trading, or statistical arbitrage. This indicator measures the distance (spread) between prices of two directly (positively) correlated instruments and shows the result as a curve with standard deviations. So, traders can quickly identify when the instruments are too far apart and use this information for trade opportunities.  How to use the Pairs Spread indicator Best results are attained
Japanese このインジケーターは、チャートパターンでのトレードを好むトレーダーにとって、高度なチャート分析アシスタントとして機能します。目視での分析負担を軽減し、利益を上げるための精度を高めるように設計されています。 実際の使用においての、このインジケーターの主な利点と特徴は以下の通りです: 1. 自動パターン検出 (Automated Pattern Detection) 時間の節約とバイアスの軽減: 手動でトレンドラインを引く必要はありません。価格のスイングポイント(Pivot High/Low)を検索し、価格構造が条件を満たすと、ライジングウェッジ(上昇楔形)とフォーリングウェッジ(下降楔形)を自動的に描画します。 あらゆる状況を網羅: パターン形成中、ブレイクアウト、さらにはパターン失敗(Failed)まで検出でき、市場の全体像を明確に把握できます。 2. ターゲットとフィボナッチTPの内蔵 (Built-in Targets & Fibonacci TP) ターゲットを自動計算: ブレイクアウトが発生すると、システムはウェッジの開き幅に基づいてメインターゲットの距離を即
Introducing PivotWave – your ultimate trading companion that redefines precision and market analysis. Designed with traders in mind, PivotWave is more than just an indicator; it’s a powerful tool that captures the pulse of the market, identifying key turning points and trends with pinpoint accuracy. PivotWave leverages advanced algorithms to provide clear visual signals for optimal entry and exit points, making it easier for traders to navigate volatile market conditions. Whether you are a begin
Bookmap pro
Ahmed Mohammed Bakr Bakr
FREE Bookmap Volume Heatmap Indicator Overview The   Bookmap Volume Heatmap   is a custom MetaTrader 5 (MQL5) indicator that creates a visual heatmap of trading volume distribution across price levels, similar to professional trading platforms like Bookmap. It provides traders with a clear visualization of where significant trading activity has occurred within a specified price range. Key Features 1.   Volume Distribution Visualization Creates color-coded rectangles on the chart representing vol
FREE
Real-Time Spread Display Tool A   real-time spread display tool   is a specialized software or application designed to provide traders and investors with instant, live data on the   spread —the difference between the bid price (the price at which buyers are willing to purchase an asset) and the ask price (the price at which sellers are willing to sell it)—for various financial instruments. This tool is critical in markets such as forex (FX), stocks, futures, and cryptocurrencies, where price f
Symbol: EURUSD Timeframe: 30 minutes (M30) For other symbols or timeframes, adjust the settings to match the market. Volume Profile POC Breakout builds a volume profile from recent candles, finds the Point of Control (POC) and marks clean breakouts of that level. Each breakout is shown as a complete trade plan with entry, stop loss and three take profit levels, filtered by the higher timeframe trend and rated by a quality score. The indicator does not open trades. It is a visual and analysis to
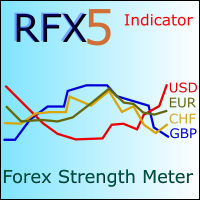
RFX Forex Strength Meter is a powerful tool to trade 8 major currencies in the Forex market, U.S. Dollar ( USD ) European Euro ( EUR ) British Pound ( GBP ) Swiss Franc ( CHF ) Japanese Yen ( JPY ) Australian Dollar ( AUD ) Canadian Dollar ( CAD ) New Zealand Dollar ( NZD ) The indicator calculates the strength of each major currency using a unique and accurate formula starting at the beginning of each trading day of your broker. Any trading strategy in the Forex market can be greatly improved b
Buyer Seller Arrows – 自信を持ってトレード! すべてのタイムフレーム(M1 から MN1 まで)で、買い手と売り手の力を直感的に分析できる革新的なツールです。色分けされたパーセンテージと矢印によって、 市場のダイナミクスを瞬時に把握 できます。 主な機能: 緑の上向き矢印 = 買い手優勢 赤の下向き矢印 = 売り手優勢 各タイムフレーム (M1, M5, M15, M30, H1, H4, D1, W1, MN1) における パーセンテージ強度 カラーコード による素早い識別(鮮やかな緑と赤) 動作原理: 買い圧力と売り圧力のバランス を追跡 EMA と SMA を用いて強度を計算 リアルタイムでトレンドの優勢 を表示 理想的なエントリーとエグジットポイント を特定するサポート トレーダーに選ばれる理由: 非常に分かりやすいビジュアル – 複雑なチャート不要、純粋な市場の強さを表示 迅速な意思決定 – スキャルピングやスイングトレードに最適 完全にカスタマイズ可能 – 自分のトレードスタイルに合わせてパラメータを調整 他のインジケーターとの
The market is unfair if only because 10% of participants manage 90% of funds. An ordinary trader has slim changes to stand against these "vultures". This problem can be solved. You just need to be among these 10%, learn to predict their intentions and move with them. Volume is the only preemptive factor that faultlessly works on any timeframe and symbol. First, the volume appears and is accumulated, and only then the price moves. The price moves from one volume to another. Areas of volume accumu
This indicator is a conventional analytical tool for tick volumes changes. It calculates tick volumes for buys and sells separately, and their delta on every bar, and displays volumes by price clusters (cells) within a specified bar (usually the latest one). The algorithm used internally is the same as in the indicator VolumeDeltaMT5 , but results are shown as cumulative volume delta bars (candlesticks). Analogous indicator for MetaTrader 4 exists - CumulativeDeltaBars . This is a limited substi
このプロダクトを購入した人は以下も購入しています
Trend Sniper X
Sarvarbek Abduvoxobov
4.86 (42)
Trend Sniper X は、トレードの方向性と潜在的な反転ポイントを明確かつ正確に特定するのに役立つ、MetaTrader 5 用のマルチタイムフレーム・トレンドフォロー指標です。 MT4用: https://www.mql5.com/en/market/product/193245 価格情報: 現在の価格はプロモーション価格であり、今後のアップデートや新機能のリリースに伴い変更される場合があります。 ボーナス特典: このインジケーター用の無料自動売買アシスタントEAを入手するには、購入後に an 著者(開発者)へメッセージをお送りください。 Code2Profit チャンネル マルチタイムフレーム分析で相場をマスターしよう! Trend Sniper X で勝率を最大化する方法:重要なルールとセッションのコツ 技術仕様 プラットフォーム MetaTrader 5 インジケータータイプ マルチタイムフレーム・トレンドインジケーター 操作タイムフレーム あらゆるチャートタイムフレームに対応。個別に選択可能な上位タイムフレーム (M1–MN1) を搭載 主要銘柄 FX、ゴールド (X
Smart Trend Trading System — MetaTrader 5 ご購入後、MQL5で私にメッセージをお送りいただくと、Smart Universal Expert Advisorを無料で受け取れるほか、オンライン講座、PDFマニュアル、非公開グループへのアクセスもご利用いただけます。 STTSは、トレンドの方向、エントリー・決済シグナル、反転ゾーン、重要な価格水準をチャート上にまとめて表示します。システムを参考に手動で取引することも、別の対応EAを接続し、ご自身で選んだ設定に基づいて自動売買することもできます。 ひとつのシステム、4つのトレードアプローチ STTSのトレードアプローチは、大きく4つのカテゴリーに分かれています。 • スキャルピング — 短期的なシグナルや相場の動きを捉えます。 • トレンドトレード — 方向性を評価し、トレンド内の機会を探します。 • 反転トレード — 反転の可能性があるゾーンや方向の変化を見つけます。 • 出来高トレード — 出来高に基づく情報を使い、市場の活発さを評価します。 エントリー・決済の矢印、トレンド情報、サポート・
あなたのトレード優位性を視界に入れよう! M5 Sniper は MeanFX による新しいインジケーターです。 正確なトレードシグナル と 適応型TP/SLレベル を組み合わせることで、結果として可能な限り最高の統計的トレードを実現します! 5回購入されるごとに価格が上昇し、次の価格は69$です 購入後に私にメッセージを送っていただければ、ヒント/ガイドとボーナスEAをお受け取りいただけます 何が他と違うのでしょうか? Gold XAUUSDにおける 実証済みの統計的パフォーマンス ( ほぼすべてのアセットで機能します 。一貫した結果が得られないまま何でも扱おうとするのではなく、1つの時間足をマスターすることに重点を置いています) 1日あたり1~8回のトレード を各シンボルで実行し、高い勝率と、すべての統計的優位性をこちら側に持つことができます チャート上には 確認済みの BUYおよびSELLシグナルのみを表示 適応型TPおよびSLレベル を各トレードごとにインジケーターが生成 平均Winrate 75%+ 平均 Signal Ratio 最低1.1+ アラーム と通知を 携帯電話
SuperScalp Pro
Van Minh Nguyen
4.56 (36)
SuperScalp Pro - Professional Multi-Layer Confluence Scalping System SuperScalp Proは、クラシックなSupertrendに複数のインテリジェントな確認フィルターを追加した、高度なスキャルピングインジケーターです。より高い確率が期待できるBuy/Sellの取引機会を特定し、ダマシのシグナルを大幅に減らすことをサポートします。 明確なBuyとSellの矢印がチャート上に直接表示され、ATRに基づくStop LossとTake Profitのレベルがリアルタイムで自動計算されます。 購入後、設定方法や推奨設定についてのサポートが必要な場合は、私にご連絡ください。 SuperScalp Pro Auto Traderを使用して、シグナルを簡単に自動化できます: [Auto Trader] 推奨設定ファイルをダウンロード: [Set File] 完全なドキュメントは製品ブログでご覧いただけます: [User Guide] 最新情報を受け取るには公式チャンネルに参加してください: [Official Channel]
SMC Intraday Formula
VividMind Digital Solutions
5 (26)
まず正直に言いましょう。 どんなインジケーターも、それ単体であなたを利益化させることはできません。もしそう言う人がいるなら、それは夢を売っているだけです。完璧な売買シグナル(矢印)を表示するインジケーターは、いくらでも“完璧に見せる”ことができます。正しい過去の区間を拡大して、勝ちトレードだけを切り取ればいいだけです。私たちはそれをしません。 SMC Intraday Formula はツールです。 市場構造を読み取り、最も高い確率の価格ゾーンを特定し、今この瞬間のスマートマネーの痕跡をシンプルな言葉で正確に示します。最終判断はあなたが行います。トレードを実行するのもあなたです。しかし今は「希望」ではなく「精度」でエントリーできます。 私たちはこのインジケーターを、ゴールド(XAUUSD)および主要FX通貨ペアで約3年間、日々のスキャルピングに使用してきました。M1、M5、M15、M30の主要ツールです。これは未来を予測しようとするのではなく、今まさに形成されている高確率セットアップを示し、その理由を説明します。 他のすべてのインジケーターと何が違うのか? ほとんどのトレーディングイ
Boba Analysis Suite
Trade Ready Solutions LLC
5 (1)
Boba Analysis Suite Boba Analysis Suite は、MetaTrader 5 向けの分析インジケーターです。市場構造、重要な価格帯、相場全体の状況を、一つのチャート画面にまとめて表示します。 トレーダーおよびトレーディング指導者としての実務経験をもとに開発され、市場の方向性の評価、重要な価格水準の特定、複数の時間足を組み合わせた分析など、体系的な分析プロセスを支援します。 相場の背景を踏まえた分析 個々のシグナルの意味は、相場の状況によって変わります。Boba Analysis Suite は、現在のチャート状況をより大きな市場構造と関連付け、あらかじめ定めたルールに沿って取引アイデアを検討するための分析を支援します。 主な分析機能: トレンドと市場構造: 市場の方向性と、その背景にある構造を評価します。 重要な価格帯と価格水準: さらに分析すべき重要な領域を視覚的に表示します。 複数の時間足: 異なる時間足の情報を組み合わせ、相場全体の状況を評価します。 視覚的な分析プロセス: 分析情報をチャート上で直接確認できます。 自主的な取引判断を支援 Boba
新たな王者が登場 - インジケーター + 注文管理表示(TP1 + TP2 + TP3)+ オプションのTelegramシグナル送信機能付き(無料) (完全なトレード&シグナルシステム) ゴールド向け最高のEA: Gold Slayer このインジケーターには、高度な戦略、カスタマイズ可能な注文管理システム、そしてエンベロープ拡張を組み合わせた平均回帰システムが搭載されています。さらに、RSIなど複数のインテリジェントな確認フィルターによって、高確率の反転エントリーをBUY・SELLシグナルとして検出します。 単にトレードを学ぶだけでなく、複数ポジションを効果的に管理し、過去に利益を出しているオープンポジションで損失トレードをカバーする方法も学べます。 M5向けに構築・最適化されており、流動性が高くシグナルの精度が安定しているBTCUSDとXAUUSDで優れたパフォーマンスを発揮します。 このインジケーターは、ATRを基に自動計算されたエントリー、ストップロス、テイクプロフィットレベルを備えた明確なLong・Shortシグナルを提供するため、リスク管理が最初から組み込まれています。 マ
伝説が帰ってきました:Entry Points Pro 10。 MQL5 Marketのトップ3に3年間入り続けた伝説的インジケーターの再始動です。 2つのバージョンで合計589件の高評価レビュー、毎日数千人のトレーダーが実際のトレードに使用し、デモのダウンロードは31,000件以上   MT4+MT5 。 私はこの5年間に寄せられたレビューをすべて読み、約束を並べる代わりに、その答えをバージョン10に組み込みました。1999年から相場に携わり、 誠実さ、自らの評判、そして顧客を大切にする 作者による製品です。 Entry Points Proのエントリーシグナルは、リペイント(再描画)を一切行いません。 そして今回初めて、これは作者の言葉ではなく検証可能な事実になりました。確定シグナルはローソク足の終値確定後にのみ表示され、自動テストで リペイントはゼロ と確認されています(EURUSD、XAUUSD、BTCUSDで2,486,568回の不変条件チェック、違反0件)。検証方法は公開されており、ストラテジーテスターでご自身で再現できます。 ご購入後は、必ずすぐにダイレクトメッセージでご
Auto Optimized SpeedAngle は、継続的なウォークフォワード最適化(WFO:Walk-Forward Optimization)によりカーブフィッティング(過剰最適化)を排除した、機関投資家レベルのモメンタムベクトルシステムです。市場レジームの変化時に効果が低下する静的な入力に依存せず、アウトオブサンプル(OOS)検証を用いてパラメーターを動的に再キャリブレーションすることで、表示されるシグナルが単なる過去の偶然ではなく、確実な統計的優位性に基づいていることを保証します。 主な機関投資家向けフレームワーク ウォークフォワード最適化エンジン: ルックバック期間やしきい値の数千に及ぶ組み合わせを継続的にスキャンし、データをインサンプルとアウトオブサンプルに厳格に分離します。未検証のデータ環境において数学的優位性が証明された場合にのみ、新しいパラメーター設定を採用します。 定量的目的関数: 単なる純利益の追求ではなく、機関投資家レベルの安定性指標をターゲットとします。システム品質ナンバー(SQN)、期待値(1トレードあたりの平均Rマルチプル)、またはネットRの最適化を選
Neuro Poseidon is a new indicator by Daria Rezueva. It combines precise trading signals with adaptive TP/SL levels - creating best possible trades as a result! Message me and get  Neuro Poseidon Assistant  as a gift to automize your trading process! What makes it stand out? 1. Proven profitability on all assets and timeframes 2. Only confirmed BUY and SELL signals present on the chart 3. Adaptive TP & SL levels generated by the software for each trade 4. Easy to understand - suitable for al
M1 SNIPER は使いやすいトレーディングインジケーターシステムです。M1時間足向けに設計された矢印インジケーターです。M1時間足でのスキャルピングのためのスタンドアロンシステムとして、また既存のトレーディングシステムの一部としても使用できます。このトレーディングシステムはM1時間足での取引に特化して設計されていますが、他の時間足でも使用できます。元々、この手法はXAUUSDとBTCUSDの取引用に設計しましたが、他の市場においても役立つと考えています。 インジケーターのシグナルは、トレンドの方向と逆方向に取引できます。インジケーターのシグナルを利用して両方向に取引するのに役立つ特別な取引テクニックをご紹介します。この手法は、特別な動的なサポートとレジスタンスの価格帯を利用することに基づいています。 ご購入後、M1 SNIPER矢印インジケーターをすぐにダウンロードできます。さらに、M1 SNIPERツールのすべてのユーザーに、以下のスクリーンショットに表示されているApollo Dynamic SRインジケーターを無料で提供しています。この2つのインジケーターを組み合わせることで
ARIPoint
Temirlan Kdyrkhan
1 (4)
ARIPoint is a powerful trading companion designed to generate high-probability entry signals with dynamic TP/SL/DP levels based on volatility. Built-in performance tracking shows win/loss stats, PP1/PP2 hits, and success rates all updated live. Key Features: Buy/Sell signals with adaptive volatility bands Real-time TP/SL/DP levels based on ATR Built-in MA Filter with optional ATR/StdDev volatility Performance stats panel (Success, Profit/Loss, PP1/PP2) Alerts via popup, sound, push, or email Cu
Adaptive Price Action Engine インジケーターを購入すると、EAが無料に マルチタイムフレーム対応・自己最適化トレンド&ローソク足パターン分析 市場環境は常に変化しており、すべてのPrice Actionパターンが、あらゆる市場環境で同じ価値を持つわけではありません。 Adaptive Price Action Engine は、変化する市場環境への適応を目的として、 トレンド構造、マルチタイムフレーム分析、ローソク足パターン、統計的最適化 を1つの分析フレームワークに統合しています。 2つのアダプティブモード Dual Alpha Trend Mode 低い時間足と高い時間足のAlpha Trendパラメータを自動的に探索し、直近の市場動向に合わせてトレンド判定を適応させます。 Candlestick + Alpha Mode Alpha Trendによる市場レジーム判定と、 22種類の強気・弱気ローソク足パターン を組み合わせます。すべてのパターンを同じように扱うのではなく、さまざまなパターンの組み合わせを統計的に評価し、選択された市場環境において過去
Gann Made Easy   は、ミスター・ギャンの理論を使用した取引の最良の原則に基づいた、プロフェッショナルで使いやすい外国為替取引システムです。 W・D・ガン。このインジケーターは、ストップロスとテイクプロフィットレベルを含む正確な買いと売りのシグナルを提供します。 PUSH通知を利用して外出先でも取引可能です。 ご購入後、取引方法の説明と優れた追加インジケーターを無料で入手するには、私にご連絡ください! おそらく、ギャンの取引手法についてはすでに何度も聞いたことがあるでしょう。通常、ギャンの理論は初心者のトレーダーだけでなく、すでにある程度の取引経験がある人にとっても非常に複雑なものです。なぜなら、ギャンの取引手法は理論的にはそれほど簡単に適用できるものではないからです。私はその知識を磨き、最良の原則を私の外国為替インジケーターに組み込むために数年を費やしました。 このインジケーターは非常に簡単に適用できます。必要なのは、それをチャートに添付し、簡単な取引推奨事項に従うだけです。このインジケーターは常に市場分析の仕事を行い、取引の機会を探します。適切なエントリーポイントを検
Break and Retest Hunter is a powerful MetaTrader 5 indicator designed to automatically identify support and resistance levels, breakout structures, and potential retest opportunities in real time. Bonus Indicator: After purchasing Break and Retest Hunter , contact me to receive Trade Indicator Assistant EA completely free as a bonus utility. $65 for the next 10 copies . Next price is $120.  Combining adaptive market analysis, clear BUY/SELL signals, Fibonacci-based profit targets, and a premiu
FiboSniper Pro – Multi-Filter Fibonacci System with Auto SL/TP and Control Panel FiboSniper Proは、動的なFibonacci Envelopesと複数の確認フィルターを組み合わせ、選別されたBuyおよびSellシグナルを生成するテクニカルインジケーターです。FibonacciレベルはMoving AverageとATRを基に計算され、その後ADX、EMA、RSI、ATR、Volume、Time、Candle構造によってフィルタリングされます。インジケーターは、ATRに基づく自動Stop LossおよびTake Profitレベルをチャート上に直接表示し、さらに迅速な調整が可能なインタラクティブControl Panelを提供します。 購入後、推奨設定ファイルと詳細な使用方法については、私にご連絡ください。 Auto Trader Xを使用してFiboSniper Proのシグナルを自動化できます: [Auto Trader X] User GuideとSet Files: [Click her
Tokyo Indicatorは、トレンドの方向性、潜在的な取引シグナル、および市場状況を視覚的に分かりやすく表示します。 色分けされた階段状のトレンドラインにより、強気局面(青色)と弱気局面(マゼンタ色)が明確に区別されます。トレンドの変化に合わせて表示される方向矢印は、売買の好機を強調します。 統合されたダッシュボードには、現在のシグナル、市場のバイアス(傾向)、モメンタム、ボラティリティ、シグナルの品質がひと目で分かるようにまとめられています。これにより、トレーダーはパネルを切り替えることなく、価格変動(プライスアクション)とインジケーターの数値を照らし合わせて分析を行うことができます。 すっきりとしたチャート表示と簡潔な市場概要により、Tokyo Indicatorはトレンド分析や取引判断における体系的なアプローチをサポートします。 あらゆる時間足や銘柄に対応しており、特に金(ゴールド)の取引に適しています。 トレンド スキャナーの強力なサポートを利用して、無料のインジケーターを入手し、プライバシーを守ります。あーみー!     設定 ShowHUD - チャート上のパネ
トレンドキャッチャーインジケーター トレンドキャッチャーインジケーターは、開発者独自の適応型トレンド分析指標を組み合わせることで、市場価格の動きを分析します。短期的なノイズを除去し、根底にあるモメンタムの強さ、ボラティリティの拡大、価格構造の挙動に焦点を当てることで、真の市場方向性を特定します。また、移動平均線、RSI、ボラティリティフィルターなどの平滑化およびトレンドフィルタリング機能を備えたカスタマイズ指標も使用します。 実際の運用状況のモニタリングやその他の製品については、こちらをご覧ください: https://www.mql5.com/en/users/mechanic/seller ご注意ください。私はTelegramでEAや設定を販売していません。詐欺です。すべての設定はブログで無料で公開しています。 重要!ご購入後すぐにご連絡ください。手順とボーナスをお送りします!
Unix Scalper — MetaTrader 5 ご購入後、MQL5で私にメッセージをお送りいただくと、Smart Universal Expert Advisorを無料で受け取れるほか、オンライン講座、PDFマニュアル、非公開グループへのアクセスもご利用いただけます。 セットアップを見つけ、取引プランを確認し、取引方法を選ぶ。 UNIX Scalperは、市場分析、BUY/SELL/WAITの判断、Entry、Stop Loss、TP1、TP2の水準を、見やすいパネルにまとめています。 シグナルと取引プランを確認 • 明確な判断:BUY、SELL、WAIT。 • 明示された水準:Entry、Stop Loss、TP1、TP2。 • 複数時間足の一覧:パネル上で各時間足のシグナルを比較。 • 判断を支える分析:トレンド、モメンタム、出来高、ボラティリティ、サポートとレジスタンス、市場の質。 • 選べるレイアウト:Minimized、Compact、Standard、Full。 シグナルと各水準を確認し、そのセットアップがご自身の取引ルールに合うか判断してください。 ゴール
Entry In The Zone and SMC Multi Timeframe is a real-time market analysis tool based on Smart Money Concepts (SMC), designed to analyze market structure, price direction, and key trading zones. It supports both Single-Timeframe and Multi-Timeframe Analysis, providing a clearer view of overall market structure across multiple timeframes, with real-time BUY / SELL signals designed with a strict focus on No-Repaint principles. The signals are designed to help filter unclear setups and evaluate tradi
Apex Patterns PRO インジケーターをご購入いただくと、それに基づいたExpert Advisorを無料でご提供します。 自己最適化するチャートパターンおよびブレイクアウト分析システム 従来のパターンスキャナーは固定のパラメータに依存しているため、市場のボラティリティや構造が変化するとパフォーマンスが低下することがよくあります。 Apex Patterns PROは、構造的なチャートパターン認識、モメンタムフィルタリング、および統計的な自己最適化を単一の分析フレームワークに統合することで、変化する市場環境に適応するように設計されています。 適応型スキャンエンジン 自己最適化パターンモード 最近の履歴データから適切なパターンパラメータを自動的に検索し、静的な設定を使用するのではなく、現在の市場の動きに合わせてインジケーターの構造検出を適応させます。 スマートブレイクアウトフィルタリング 古典的なパターン認識と、モメンタム、ボリューム、プライスアクションの指標を組み合わせます。すべてのブレイクアウトを同じように扱うのではなく、システムが根底にある市場構造を評価し、現在の統計
Market Structure Order Block Dashboard MT5 は、市場構造と主要な価格反応ゾーンをチャート上で直接読み取りたいトレーダー向けに設計された MT5 インジケーターです。BOS、ChoCH、オーダーブロック、Fair Value Gap (FVG)、流動性、Kill Zones、Volume Profile、そして素早い分析のためのコンパクトなダッシュボードを組み合わせています。 本インジケーターは、市場構造、ICT、Smart Money の概念を意思決定の枠組みとして使用するトレーダーを対象としています。トレンド継続、反転の可能性、価格の不均衡、流動性ターゲット、注目ゾーンをより構造的に特定する助けとなります。 購入者向けの付属リソース 購入後、MQL5 のプライベートメッセージにてご依頼いただくと、完全な PDF ユーザーガイドとパラメータ設定のヒントを提供いたします。MQL5 のプライベートメッセージによる直接的な技術サポート。 バージョン 1.20 では 2 つの重要な追加機能があります: Pending BOS / Pending Cho
FX Trend NG:次世代マルチマーケット・トレンドインテリジェンス 概要 FX Trend NG は、複数の時間足に対応したプロフェッショナル向けトレンド分析およびマーケット監視ツールです。 市場全体の構造を数秒で把握することができます。 複数のチャートを切り替える必要はありません。どの銘柄がトレンド中なのか、どこでモメンタムが弱まっているのか、そしてどの時間足で強い整合性があるのかを瞬時に確認できます。 ローンチ特別オファー – FX Trend NG を $30(6ヶ月) または $80 永久ライセンス でご利用いただけます。 すでに Stein Investments のユーザーですか? -> メッセージを送信 して、プライベートグループへアクセスしてください。 セットアップや詳細情報が必要ですか? -> Stein Investments 公式ページ をご覧ください。 1. FX Trend NG が他と異なる理由 3ステート・トレンドロジック ― Buy と Sell だけではない • 多くのインジケーターは Buy または Sell の2状態のみを表示します。
ご紹介     Quantum Breakout PRO は 、ブレイクアウト ゾーンの取引方法を変革する画期的な MQL5 インジケーターです。 13年以上の取引経験を持つ経験豊富なトレーダーのチームによって開発されました。     クォンタム ブレイクアウト プロ   は、革新的でダイナミックなブレイクアウト ゾーン戦略により、あなたのトレーディングの旅を新たな高みに押し上げるように設計されています。 クォンタム ブレイクアウト インジケーターは、5 つの利益ターゲット ゾーンを備えたブレイクアウト ゾーン上のシグナル矢印と、ブレイクアウト ボックスに基づいたストップロスの提案を提供します。 初心者トレーダーにもプロのトレーダーにも適しています。 量子EAチャネル:       ここをクリック 重要!購入後、インストールマニュアルを受け取るためにプライベートメッセージを送ってください。 推奨事項: 時間枠: M15 通貨ペア: GBPJPY、EURJPY、USDJPY、NZDUSD、XAUUSD アカウントの種類: ECN、Raw、またはスプレッドが非常に低い R
Atomic Analyst — MetaTrader 5 ご購入後、MQL5で私にメッセージをお送りいただくと、Smart Universal Expert Advisorを無料で受け取れるほか、オンライン講座、PDFマニュアル、非公開グループへのアクセスもご利用いただけます。 Atomic Analystは、プライスアクション、トレンドの方向、エントリー・決済シグナル、損切り水準、複数の利確水準をチャート上にまとめて表示します。 シグナルを確認し、取引の状況を理解する Atomic Analystは、分析結果をわかりやすい視覚情報として表示します。 • エントリーの候補を見つけるための買い・売りの矢印。 • 取引計画に役立つ損切り水準と複数の利確水準。 • 市場の方向性を評価するトレンド、強さ、モメンタムの指標。 • より広い市場背景を比較する複数時間足の分析。 • 変化する状況を追うための色分けされたローソク足とアラート。 シグナルと補助分析を併せて確認し、その取引機会がご自身のルールに合うかを判断してください。 短期の取引機会から、より大きな値動きまで Atomic A
「Scalper Vault」は、デイトレードで安定した成果を目指すトレーダーのために設計された、強力かつ充実した機能を備えたトレーディングシステムです。 この高精度なインジケーターは、それ単体で完結するトレーディングシステムとして機能し、FXやバイナリーオプションのトレーダーに、機関投資家レベルの分析を提供します。 ご購入後、ぜひご連絡ください。 トレードのヒントに加え、豪華なボーナスをプレゼントいたします! 「Scalper Vault」を活用すれば、勘に頼った判断や複雑な手動分析は不要です。使いやすいトレード手法に集中し、純粋に「エントリー・決済」という実行フェーズに専念できます。 高精度なトレンドフォロー・シグナル:中核となるアルゴリズムが市場構造を分析し、主要なトレンド方向に沿った高確率なシグナルを提示します。これにより、誤ったエントリーを大幅に削減できます。 精度の高い天井・底の検知:市場の勢いが尽きたポイントをスキャンし、反転の可能性が高いゾーンを特定します。 ギャン(Gann)理論に基づく売買ゾーン:数学的な「ギャン・レベル」を自動的にチャート上に描画します。機関投資
PainX GainX Blue Spike Fusion AI Advanced Synthetic Index Spike Detection Indicator for MetaTrader 5 Discover potential spike setups with a clear, organized, and professional trading interface. PainX GainX Blue Spike Fusion AI is a specialized indicator designed for traders who monitor synthetic indices and want a structured way to observe potential price spike opportunities. The indicator combines signal monitoring, market-condition analysis, visual alerts, and event tracking in one convenient
BTMM State Engine Pro by G-Labs — Beat The Market Maker indicator for MetaTrader 5. Asian session range, London and New York kill zones, level progression (L1/L2/L3), peak formation detection (PFH/PFL), entry signals, and a multi-pair scanner from one chart. Stop scanning charts one pair at a time. The State Engine tracks the BTMM daily cycle automatically — Asian box, room boundaries, level blocks, peak formations, and filtered entries — while the scanner dashboard shows level, peak status, d
FX Power: 通貨の強弱を分析して、より賢い取引を実現 概要 FX Power は主要通貨と金の実際の強弱をあらゆる市場状況で理解するための必須ツールです。強い通貨を買い、弱い通貨を売ることで、 FX Power は取引の意思決定を簡素化し、高い確率の取引機会を見出します。トレンドを追従する場合でも、極端なデルタ値を使用して反転を予測する場合でも、このツールはあなたの取引スタイルに完全に適応します。ただ取引するだけではなく、 FX Power で賢く取引をしましょう。 1. なぜ FX Power がトレーダーにとって非常に有益なのか 通貨と金のリアルタイム強弱分析 • FX Power は主要通貨と金の相対的な強弱を計算し、マーケットダイナミクスに関する明確な洞察を提供します。 • どの資産がリードしているか、または後れを取っているかを監視して、取引するペアを賢く選びましょう。 マルチタイムフレームの包括的なビュー • 短期、中期、長期のタイムフレームで通貨と金の強弱を追跡し、マーケットトレンドに基づいて取引戦略を調整できます。 • スキャルピングからスイングトレード
このインジケーターを購入された方には、以下の特典を 無料 で提供しています: 各トレードを自動で管理し、ストップロスとテイクプロフィットを設定し、戦略ルールに基づいてポジションを決済する補助ツール 「Bomber Utility」 様々な銘柄に合わせたインジケーターの設定ファイル(セットファイル) 「最小リスク」、「バランスリスク」、「待機戦略」 の3つのモードで使用できる Bomber Utility 用の設定ファイル このトレーディング戦略をすぐに導入・設定・開始できる ステップバイステップのビデオマニュアル ご注意: 上記の特典を受け取るには、MQL5のプライベートメッセージシステムを通じて販売者にご連絡ください。 オリジナルのカスタムインジケーター 「Divergence Bomber(ダイバージェンス・ボンバー)」 をご紹介します。これは、MACDのダイバージェンス(乖離)戦略に基づいた 「オールインワン」型のトレーディングシステム です。 このテクニカルインジケーターの主な目的は、価格とMACDインジケーターの間に発生するダイバージェンスを検出 し、将来の価格の動きを示
作者のその他のプロダクト
ATS Performance Statistics shows how your account really performed, day by day, week by week and month by month: profit and loss, worst drawdown and highest margin used. Bars and numbers, on a clean dashboard on your chart. The part most statistics tools cannot do: the drawdown and the margin of days you never watched. The indicator rebuilds the equity path of every past day from your deal history and the broker's own tick history, following each position tick by tick, including trades that were
ATS Fibonacci Golden Zones draws Fibonacci retracements the way a discretionary trader would, without the guesswork: it finds the last significant swing on your chart timeframe by itself and marks the levels that matter. No repaint. A swing high or low is accepted only after a fixed number of confirming bars on each side (8 by default). Once a swing is confirmed, the levels stay where they were. What you see on the chart: Automatic swing detection, with the A (impulse start) and B (impulse end)
FREE
ATS Scalping Cost Map は、お使いのシンボルで1回の往復取引(1つのトレードを開いて閉じること)にかかるコストを、その時間帯に価格が15分間で通常どれだけ動くかと比較して、1時間ごとに表示します。ブローカー自身の1分足履歴を使い、結果を24時間の文字盤に表示します。 短期売買では、トレードのたびに spread と手数料を支払います。同じコストでも、ある時間帯では小さく、別の時間帯では大きくなります。セッションによって相場の動きが大きく異なるためです。このインジケーターはそれを測定します。 測定する内容 サーバー時間の各時間(0〜23)について:その時間の1分足にブローカーが記録した spread の中央値(spread が0の足は除外)に、入力した手数料を加えたもの。 その時間の典型的な値動き:完全な15分ブロックの高値-安値レンジの中央値(同じ15分区間にある15本の1分足。オープン直後や休場などの不完全なブロックは除外)。 時間ごとのコスト =(spread の中央値 + 手数料)÷ 15分レンジの中央値、パーセント表示。 データが足りない場合、または spr
FREE
ATS Daily Volume Profile shows where the market actually traded today and yesterday: a horizontal volume histogram for each day, the POC (the most traded price) and the value area. WHAT YOU SEE - Daily volume profile for today and yesterday, drawn behind the candles - Heat colours: cold blue where little was traded, gold and red where most of the volume was - 3D depth shadow on every row (can be switched off) - POC as a thick gold line, value area high and low as dotted lines, rows outside the v
FREE
WHICH SIDE IS OPEN? You trade gold on M5 or M15, but the trend that matters is on H1. ATS Gold Bias puts the H1 picture on the chart you trade, so you never have to switch timeframes to know which side is open. THE H1 BIAS LINE The H1 EMA 50 drawn on your chart, bar by bar Green while the last closed H1 bar is above it: longs allowed Red while it is below: shorts allowed A dot where the bias turned, plus an optional popup or push alert THE PANEL The side that is open, and since when (date, hour
FREE
ATS Indicator - Market Structure (BOS / CHoCH) and Order Blocks A clean reading of market structure for MetaTrader 5. The indicator marks every swing high and low, labels each break as a continuation (BOS) or a change of character (CHoCH), and draws the order block the move started from, until price mitigates it. What makes it different History equals live. A swing is confirmed only when the candles on both sides of it are closed, and the same rule is used on the history and in real time. What y
FREE
ATS Trade Manager is the site foreman of your trades. Plan a trade on the chart with draggable lines and coloured zones, send it with the lot size worked out from your risk, and let the foreman look after it: break-even, trailing stop, up to three take-profit levels with a partial close at each, a daily loss lock and one panel to close groups of trades. It trades only when you press SEND. PLAN A TRADE ON THE CHART Press PLAN and the chart shows the trade before you take it: a blue line and zone
FREE
ATS Daily Performance shows your profit and loss day by day for the last 30 days, as bars and numbers on a compact dashboard on your chart. Open it and see at a glance which days made money, which lost, and how your month is going. WHAT YOU SEE - One bar per day: green for a winning day, red for a losing one - Net result of the last 30 days, today's result and the profit or loss of the trades still open - Win rate, winning days, profit factor, best day and worst day - The last 7 days listed wit
FREE
THE LOT FROM YOUR STOP. FREE. Picking a lot size by feel is how a normal loss becomes a bad day. ATS Lot Sizer puts two lines on your chart, a stop and a target. Drag them, and the panel tells you the lot size that fits your risk and the money that lot really puts on the line. One click sends the trade with the stop and target attached. HOW IT WORKS Pick LONG or SHORT. A stop line and a target line appear on the chart. Drag them. Lots = your risk (percent of balance, percent of equity, or a fixe
FREE
Andy Universal Sniper Pro is a decision-support indicator for manual trading on MT4. It puts three things on one chart: a filtered entry arrow , targets from the previous day pivots and a lot size calculated from your risk % . It is not an automated system and it does not trade for you. How an arrow is produced An arrow appears only when all of these checks pass on the same candle: Cross: EMA 5 crosses EMA 34 (up for BUY, down for SELL). Momentum: RSI 14 above 55 for BUY, below 45 for SELL. Betw
Gold Liquidity Matrix - Order Blocks with Displacement, Gap and Break of Structure Most order block indicators draw a zone on every small swing and fill the chart. Gold Liquidity Matrix draws a zone only when four conditions agree , and then tells you what kind of zone it is. The four conditions An origin candle against the move. A displacement candle whose body is larger than 0.8 x ATR. A three-candle fair value gap larger than 0.15 x ATR. A break of structure : the displacement takes out the r

ATS Gold Command is an all-in-one decision-support indicator for XAUUSD. It was built with a simple philosophy: only include tools whose rules survived systematic backtesting and walk-forward validation on two years of Gold data. Everything works on closed bars only - no repainting, no signal that appears and then disappears. WHAT YOU GET - 5 MODULES IN ONE PANEL 1. SESSION EDGE WINDOWS (A/B/C badge) The indicator grades the trading day for Gold. Window A = London hours on M15. Window B = New Yo
ATS Fibonacci Zones Multi Timeframe finds the last significant swing by itself, draws the retracement levels that matter as zones, and tells you how many lots your stop allows. It is the full edition of the free ATS Fibonacci Golden Zones. No repaint. A swing high or low is only accepted after a fixed number of confirming bars on each side (default 8). Once a swing is confirmed it stays where it was: levels never move backwards to fit the chart. MULTI-TIMEFRAME SWING Take the swing from a higher
Every trading session leaves a high and a low, and those two prices become the liquidity targets of the following hours. ATS Killzones Liquidity Statistics draws them for you and, above all, tells you how often they are really taken, so you know whether you are looking at a target or at a wall. WHAT IT DRAWS - Session boxes (killzones) for Asia, London, New York AM and New York PM, with times set in GMT. The broker server offset is detected automatically, or you can set it by hand - The high and
ATS Volume Profile Statistics shows where the market actually traded, day by day, and measures how the key volume levels behaved on YOUR symbol and broker. It is the full edition of the free ATS Daily Volume Profile. WHAT YOU SEE - Daily volume profiles for the last 1 to 30 days, drawn behind the candles - Heat colours: cold blue where little was traded, gold and red where most of the volume was - 3D depth shadow on every row (can be switched off) - POC (most traded price) as a thick gold line,
SIX CHECKS. ONE GRADE. Most breakout signals on gold lose money. This one is graded. Every XAUUSD breakout on M15 is scored against six objective checks and gets a grade: A, B or C. You see the full trade plan (entry, stop, target, lot size), the six checks one by one, and how every past signal ended, written on your chart. WHY A GRADE We tested the same breakout on XAUUSD M15, May 2024 to September 2026, with the broker's real spread, a 2R target and one position at a time per grade, the same w
SIZE FROM THE STOP. LOCK THE DAY. Most losing days do not start with a bad setup. They start with a lot size picked by feel, then a second trade to win the first one back. ATS Risk Desk sizes every trade from your stop, sends it in one click, manages it, and locks you out when the day's limit is gone. HOW IT WORKS Pick LONG or SHORT. A stop line and a target line appear on the chart. Drag them. Lots = your risk (percent of balance, percent of equity, or a fixed sum) divided by the stop distance,
フィルタ:
レビューなし
レビューに返信