Tread Performance Dashboard
- インディケータ
- バージョン: 2.11
- アクティベーション: 10

Tread Performance Dashboard MT5 [Save 20% from $49 Available until the end of September 2026]
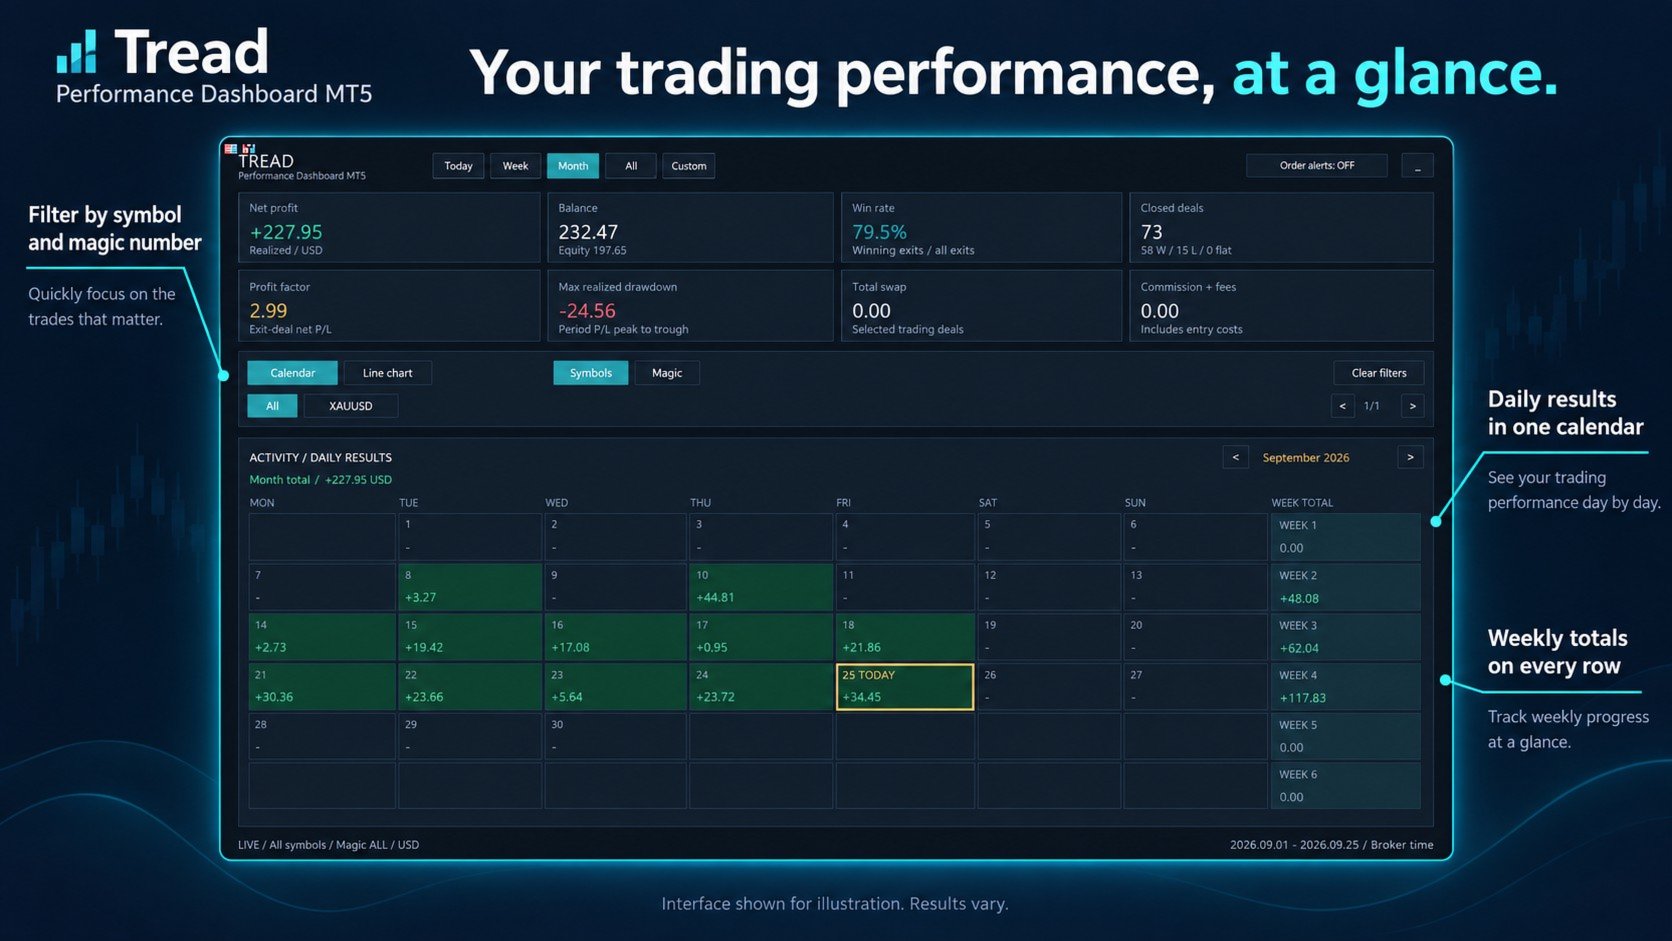
Review your trading performance directly on your MetaTrader 5 chart. Tread Performance Dashboard combines account statistics, a monthly profit calendar, performance charts, and optional pending order notifications in one interface.
Designed for manual traders and Expert Advisor users, the dashboard lets you review results by period, symbol, and magic number. It reads the currently connected account and does not open, modify, or close trades.
Key Features
- Account overview: View net realized profit, balance, equity, win rate, closed deal count, profit factor, realized drawdown, swap, and commissions.
- Monthly performance calendar: View daily results with color-coded cells, a highlighted current day, and weekly totals at the end of each week’s row.
- Period selection: Choose Today, Week, Month, All, or Custom using the buttons at the top.
- Symbol and magic number filters: Review individual instruments or trading strategies, or combine both filters.
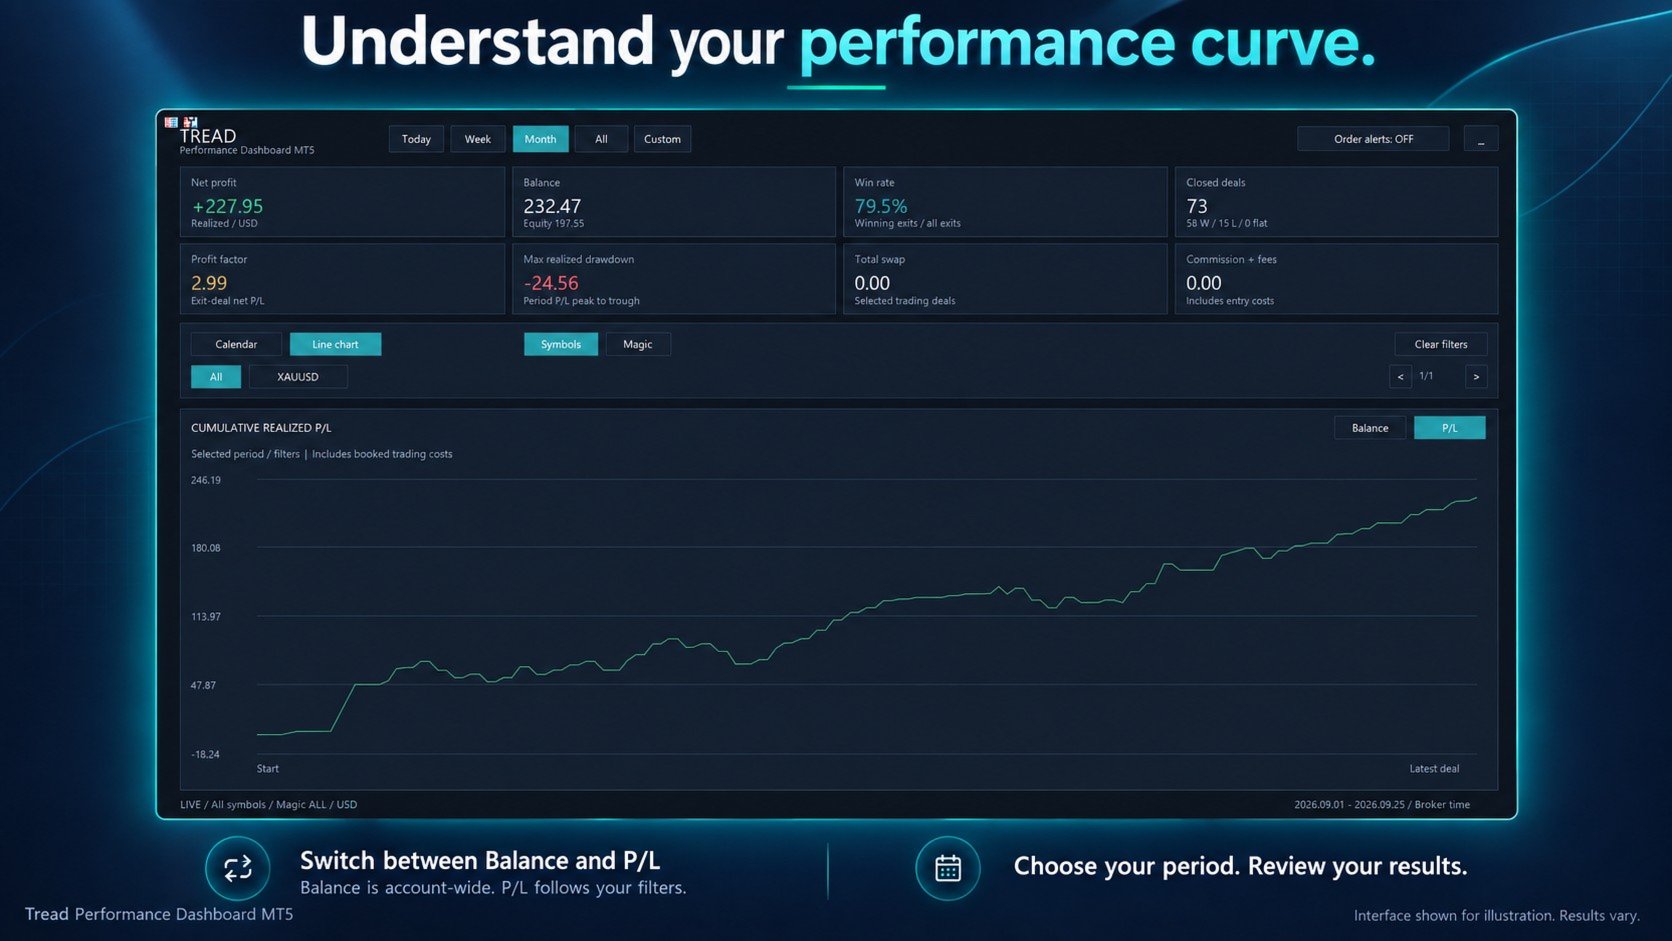
- Line charts: Switch between account balance and cumulative realized profit and loss.
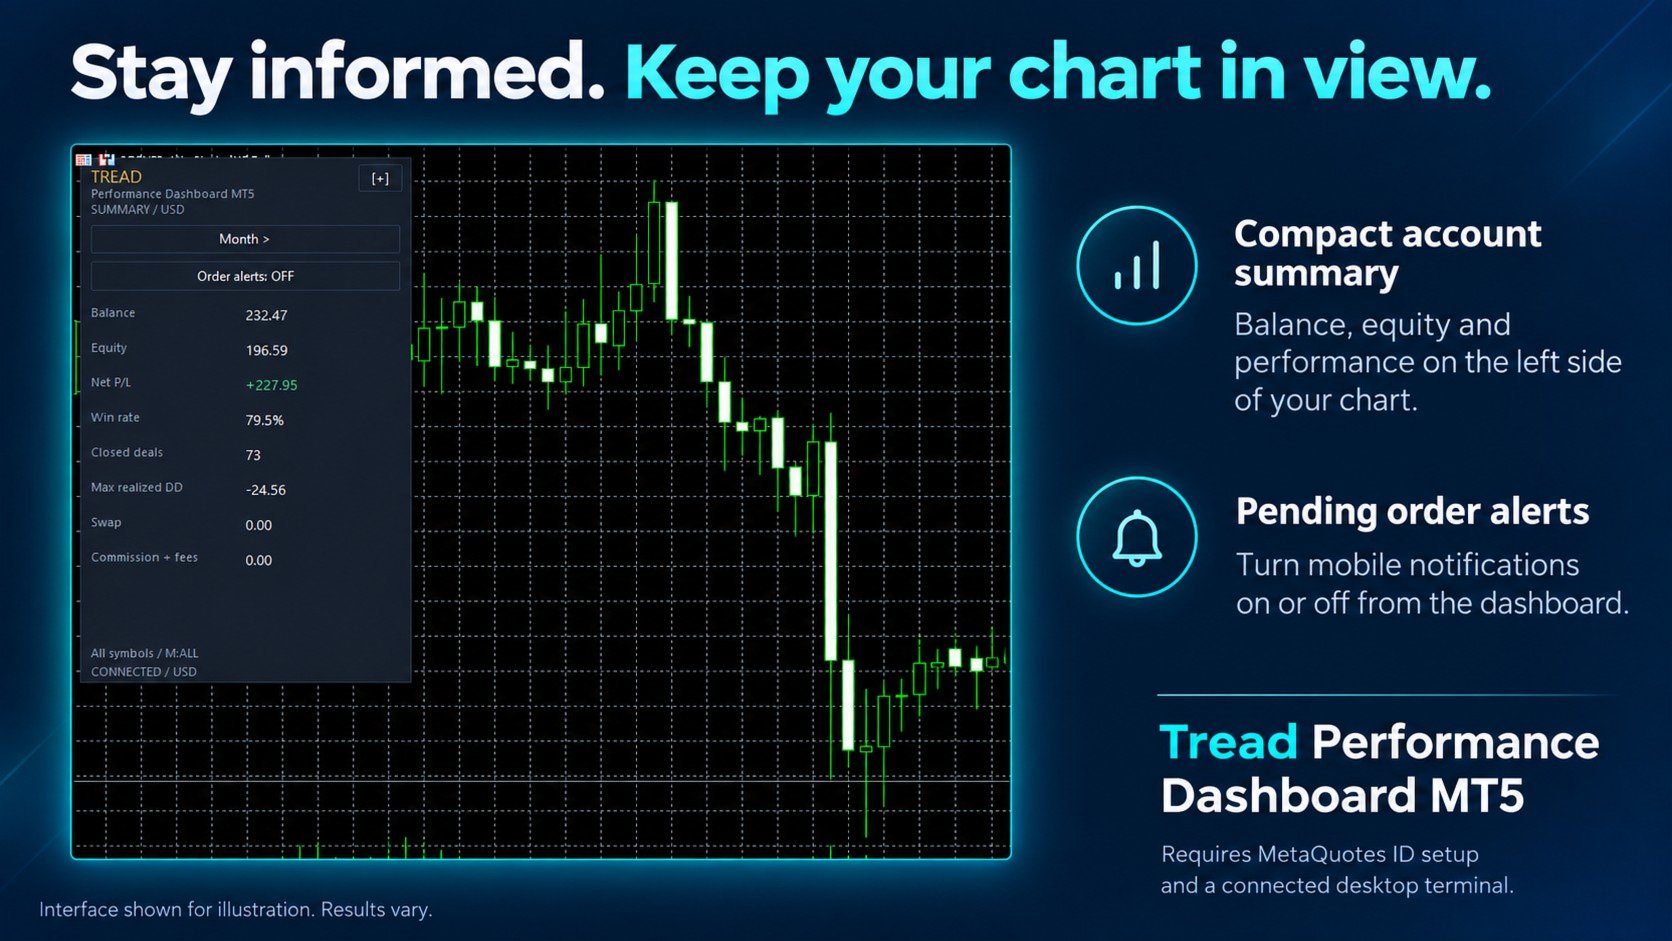
- Compact view: Minimize the dashboard into a summary panel on the left. Compact mode activates automatically when the chart area is too small.
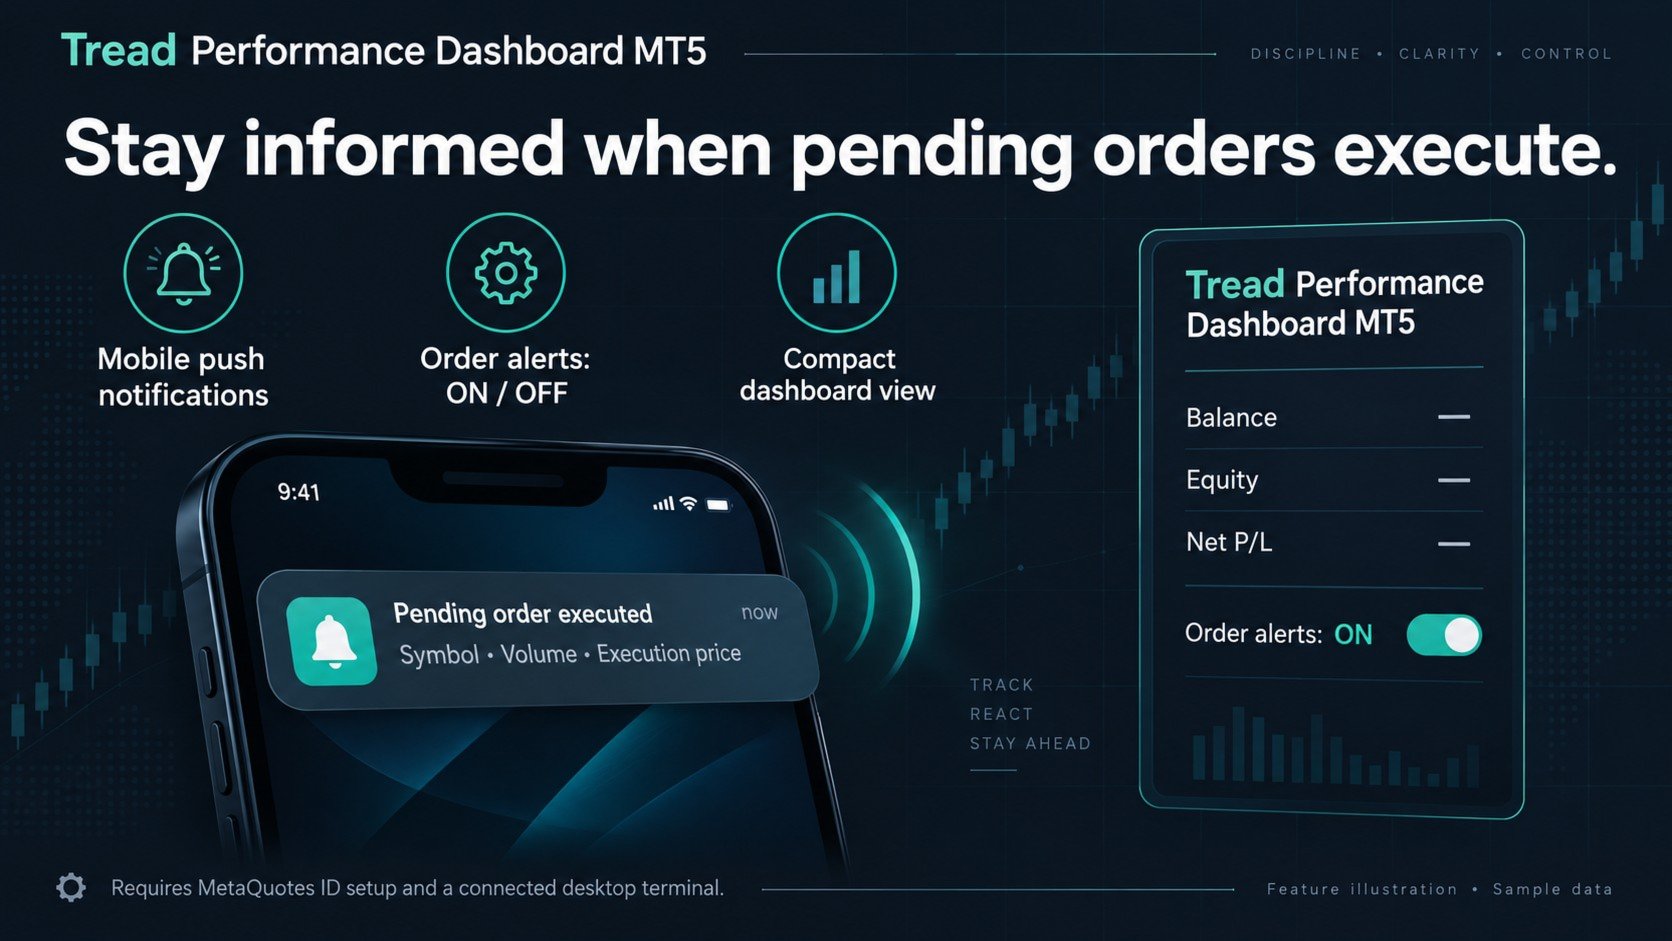
- Order alerts: Enable mobile push notifications when a pending order is executed.
Getting Started
- Install the indicator and attach it to an MT5 chart.
- Use a dedicated chart for a clearer dashboard view.
- For the full layout, provide a chart area of at least 1000 × 740 pixels. Smaller chart areas use compact mode.
- Select a reporting period using the buttons at the top.
- Choose Calendar or Line chart to switch views.
The dashboard refreshes automatically. The default refresh interval is five seconds. DLL imports and Algo Trading permission are not required.
Selecting a Reporting Period
- Today: Results from the beginning of the current broker day.
- Week: Results from Monday of the current broker week.
- Month: Results for the month displayed in the calendar.
- All: All available account history.
- Custom: The date range defined by CustomFrom and CustomTo in the indicator’s Inputs.
Use the arrows beside the calendar’s month name to browse months. When Month is selected, browsing also changes the reporting period for the statistics. Click Month again to return to the current month.
The calendar always displays the full selected month. The summary statistics and line chart follow the reporting period selected at the top.
Filtering Results
Click Symbols or Magic to display the available filter options, then select an item. Both filters can be active at the same time.
Use the filter arrows to browse additional items. Click All to clear the currently displayed filter type, or Clear filters to reset both symbol and magic number filters.
Current balance and equity always represent the entire account.
Using the Line Charts
Open Line chart, then select:
- Balance: Historical account balance, including deposits, withdrawals, and recorded balance adjustments. This chart covers the entire account and ignores symbol and magic number filters.
- P/L: Cumulative realized trading profit and loss for the selected period and filters, including recorded trading costs.
The horizontal axis follows the sequence of deals or balance changes. It does not represent evenly spaced time intervals.
Setting Up Mobile Order Alerts
- Open the MT5 mobile application and locate your MetaQuotes ID in its Settings or Messages section.
- In the desktop terminal, open Tools → Options → Notifications.
- Enable Push Notifications, enter your MetaQuotes ID, and click Test to verify delivery.
- On the dashboard, click Order alerts: OFF to switch alerts on.
If the button displays Order alerts: SETUP, enable notifications in the desktop terminal first. Hover over the button to view its status.
Alerts are generated when a pending order produces an actual execution deal. Supported types include Buy Limit, Sell Limit, Buy Stop, Sell Stop, Buy Stop Limit, and Sell Stop Limit. A Stop Limit trigger alone does not generate an alert until execution occurs.
Messages include the order ticket, symbol, pending order type, executed volume, execution price, broker time, and account number.
Alerts cover all symbols and magic numbers, independently of the dashboard filters. Each order is tracked once during an active monitoring session, including orders with partial fills. The reported volume is the volume of the detected execution, which may be smaller than the total order volume.
Keep the desktop terminal running and connected. Detection follows the refresh interval, and notifications may be queued to respect MT5 sending limits. Mobile delivery depends on terminal settings and network availability. Push notifications are not available in the Strategy Tester.
Turning Alerts Off
Click Order alerts: ON to disable alerts and clear messages waiting to be sent. Enabling alerts again starts a new monitoring session without replaying existing executions.
Enable alerts on only one dashboard instance per account to avoid duplicate messages. When the indicator is reloaded, its alert state follows the PendingPushOnStart input.
Input Settings
| Input | Description |
|---|---|
| RefreshSeconds | Automatic refresh interval in seconds. Default: 5. |
| CustomFrom | Start date and time for the Custom reporting period. |
| CustomTo | End date and time for the Custom reporting period. |
| InitialSymbol | Initial symbol filter. Leave empty to include all symbols. Use the exact broker symbol name. |
| InitialMagic | Initial magic number filter. Set to -1 for all magic numbers. |
| PendingPushOnStart | Enables order alerts when the indicator loads. Default: false. |
How Statistics Are Calculated
Net realized profit includes profit, swap, commissions, and fees recorded on buy and sell deals within the selected period. Deposits, withdrawals, credits, and charges booked as separate non-trading operations are excluded from this metric.
Closed deal statistics count exit executions rather than unique positions or orders. Partial closes may therefore count as multiple closed deals. Win rate and profit factor use amounts recorded on exit deals; entry costs recorded separately are not allocated back to those exits.
Realized drawdown measures the largest decline from a peak in cumulative realized results within the selected period, starting from zero. It does not include floating losses or measure equity drawdown.
Calendar dates use broker server time. Weekly totals include only the dates belonging to the displayed month. Historical calculations depend on the account history available from the broker.
Tread Performance Dashboard is an account monitoring and analysis tool. It does not provide trading signals or execute trades.