Cycle Phase Oscillator
- インディケータ
- バージョン: 1.0
- アクティベーション: 5

# Cycle Phase Oscillator - Cycle position in degrees
*Category: Oscillators | Difficulty: advanced | Window: separate window below the chart | Markets: Universal (Forex, indices, commodities, crypto, stocks) | Suggested timeframes: M30, H1, H4, D1*
## Short description
> Expresses the market position in its own cycle as a phase angle from minus one hundred eighty to plus one hundred eighty degrees, with an amplitude measure indicating how reliable the phase is.
## Full description
### Overview
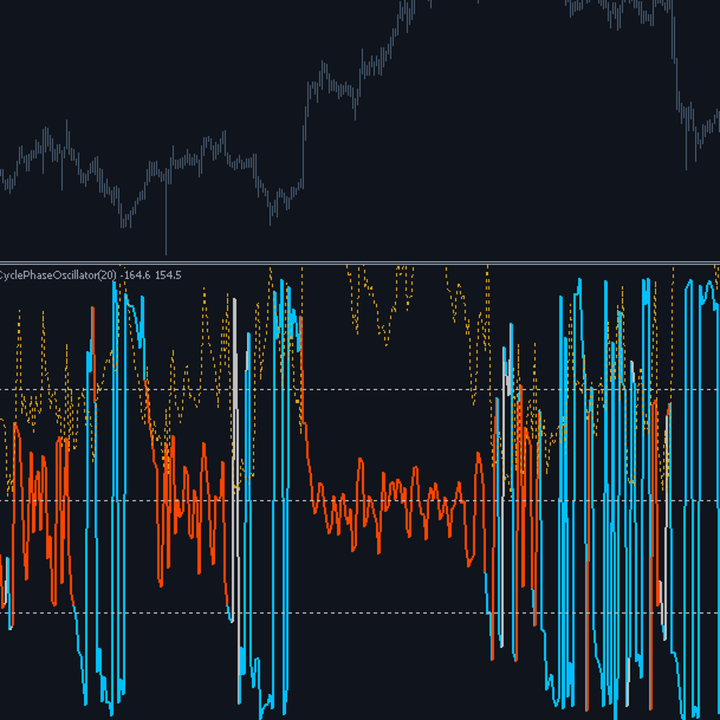
An oscillator says how far the market has risen or fallen. This one says where it sits in its cycle, expressing it as a phase angle. The construction is the classic analytic signal one: the cyclical component of price is isolated by subtracting a moving average, then a second series shifted by a quarter cycle is built using the derivative of the first, which for a sinusoid is shifted by exactly that amount. The angle formed by the two series in the plane is the current phase: zero degrees corresponds to the cycle peak, plus or minus one hundred eighty to the trough, intermediate values to the rising and falling phases. Phase advances continuously and predictably as long as a cycle exists; when it jumps erratically it means the market has no recognisable cyclicality at that moment, and the amplitude line confirms this by staying low.
### How the calculation works
1. The cyclical component is obtained by subtracting from price its own moving average over InpDetrendMa bars, removing the underlying trend.
2. The quadrature component is the derivative of the cyclical component, computed on three points for stability.
3. The derivative is rescaled by a factor equal to the period divided by two pi, restoring its amplitude to that of the original series.
4. The phase is the two argument arctangent of the two components, correctly handling all four quadrants.
5. The amplitude is the modulus of the vector formed by the two components, normalised in ATR units.
6. With amplitude below the threshold the phase is drawn grey: it is noise dominated and carries no meaning.
### How to use it
- Read the amplitude line first: if it is low, the phase is unreliable and must be ignored entirely.
- With sufficient amplitude, a phase around minus one hundred eighty indicates the cycle trough and around zero the peak.
- Regular phase advance is the proof a cycle genuinely exists: erratic jumps mean no cyclicality.
- The speed at which the phase advances indicates the actual cycle period, which may differ from the configured one.
- Set InpCyclePeriod to the cycle you want to observe: the rescaling factor depends on that value.
### Who it is for and on which timeframes
It targets technically minded traders familiar at least in outline with the analytic signal and phase concepts. It works from M30 to D1. Anyone applying it without watching the amplitude line risks reading a meaningless phase, the most common error with this kind of indicator. In markets without cyclicality, which is most of them most of the time, the indicator says so honestly by staying grey instead of producing made up numbers.
### Practical example of reading a signal
On USDCAD H4 the amplitude line rises above the threshold and stays there for three weeks: a recognisable cyclicality exists. The phase advances regularly, completing a full turn roughly every twenty two bars, close to the configured period. When the phase crosses minus one hundred eighty price does form a low, and when it passes through zero a high, with a discrepancy of one or two bars. Then the amplitude collapses and the phase starts jumping erratically: the cycle is over. From that point reading the phase makes no sense, and the grey colour says so explicitly.
## Input parameters
| Parameter | Default | Description |
|---|---|---|
| `InpCyclePeriod` | 20 | Period of the cycle to observe. It determines the rescaling factor of the quadrature component. |
| `InpDetrendMa` | 40 | Period of the trend removing average. It must stay above the cycle period so as not to erase the cycle itself. |
| `InpAtrPeriod` | 50 | ATR period used to normalise the amplitude and make it comparable across instruments. |
| `InpMinAmplitude` | 0.35 | Minimum amplitude, in ATR, for the phase to be deemed reliable and coloured. |
| `InpAppliedPrice` | PRICE_CLOSE | Price the cyclical component is isolated from. |
## Advantages / strengths
- It expresses cycle position in a way no ordinary oscillator can, because phase is a different quantity from level.
- The amplitude line explicitly declares when the phase is unreliable, instead of producing meaningless numbers.
- The three point derivative is more stable than the difference between consecutive bars, a detail noticeably improving phase quality.
- No repaint, despite the complexity of the construction.
## Limitations and warnings
- Financial markets rarely have stable cycles: most of the time the amplitude stays low and the indicator says nothing.
- The construction implicitly assumes a cycle near the configured period: very different cycles are poorly described.
- Removing the trend with a moving average introduces lag and slightly distorts the measured phase.
- It requires a minimal grasp of the phase concept, without which the indicator is incomprehensible.
**No repaint:** values printed on a closed bar are never modified afterwards.
**Disclaimer.** This product is a technical analysis tool, not an automated trading system, and it offers no profit guarantee whatsoever. Financial markets carry the risk of total loss of the invested capital. Past performance is not indicative of future results. Every signal must be confirmed with your own analysis, a money management plan and prior testing on a demo account. The author is not responsible for trading decisions taken on the basis of this indicator.
## Suggested tags / keywords for MQL5
`cycle`, `phase`, `analytic signal`, `oscillator`, `hilbert`, `quadrature`, `no repaint`, `advanced`