Regression Confidence Baseline
- インディケータ
- バージョン: 1.0
- アクティベーション: 5

# Regression Confidence Baseline - Bands on residual error
*Category: Trend | Difficulty: intermediate | Window: chart window (overlaid on price) | Markets: Universal (Forex, indices, commodities, crypto, stocks) | Suggested timeframes: M15, M30, H1, H4, D1*
## Short description
> Linear regression baseline with bands built on the residual standard error instead of the price standard deviation. Bands widen when the move loses order, not when price runs.
### Overview
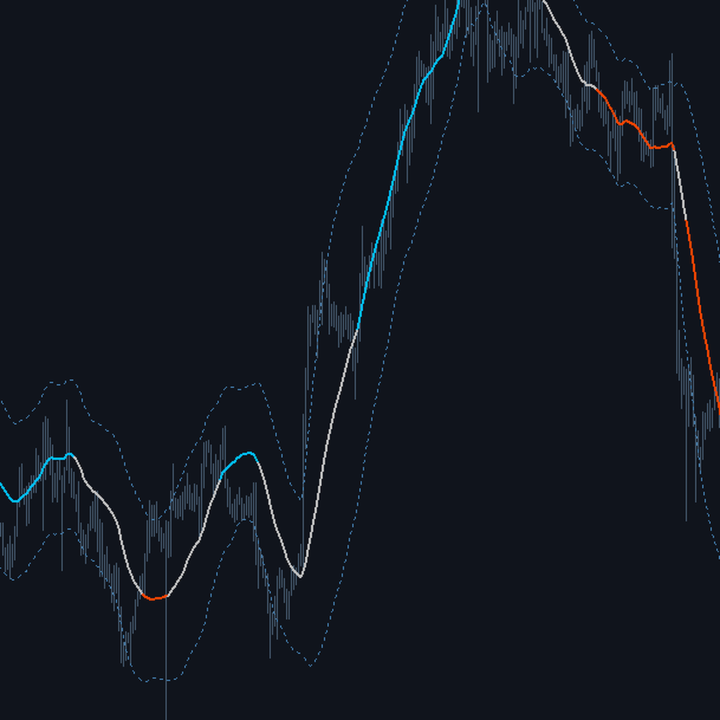
Classic volatility bands measure how far price departs from its own average. The problem is that in a regular trend price departs from the average by definition, so the bands widen exactly when the move is most orderly, sending precisely the wrong message. Regression Confidence Baseline fixes this by changing the reference: it measures how far price departs from its own trend, not from its own average. It fits a linear regression line over the last N bars and builds the bands on the residual standard error, that is the dispersion around that line. In a straight trend the bands stay narrow even while price covers a lot of ground; they widen only when the move becomes irregular and the line stops describing it well.
### How the calculation works
1. Over the last InpPeriod bars the least squares line best fitting the applied price is estimated.
2. The sums depending only on the time index are computed once at initialisation: this is why the indicator stays fast despite the double pass.
3. The baseline value is the line evaluated at the current bar, that is the right edge of the window.
4. Residuals are the differences between price and line on every bar of the window; their sum of squares is divided by the residual degrees of freedom, two fewer than the number of bars.
5. The bands are the baseline plus and minus InpBandMult times the square root of that value, the residual standard error.
6. The baseline colour depends on the slope expressed in standard errors per bar, making the flatness threshold instrument independent.
### How to use it
- Read the baseline as the equilibrium value of the trend and the bands as the limits of normal deviation from it.
- A touch of the lower band while the baseline is blue is a pullback inside an intact trend: the most typical entry context.
- A sudden widening of the bands with unchanged slope signals the move is losing order, even while price continues in the same direction.
- A break of the band opposite to the baseline colour is the first concrete hint of a trend change.
- The bands are a natural stop reference: a stop placed inside the band is hit by the ordinary dispersion around the trend.
### Who it is for and on which timeframes
It suits traders already using volatility bands who have experienced their limitation in extended trends. No formal statistical background is required to use it, but understanding the difference between dispersion around the mean and dispersion around the trend helps a great deal in reading it. It works on all timeframes from M15 up, with longer windows on slower charts. It is particularly effective on markets alternating clean trends and chaotic phases, such as indices and commodities.
### Practical example of reading a signal
On NASDAQ100 H1 the market has been rising very regularly for three days: the baseline is blue and the bands are narrow, barely two candles apart. Price drops to touch the lower band and resumes: the classic pullback, with a natural stop just below the band. The next day price keeps rising but with long overlapping candles: the bands widen to double while the slope stays unchanged. The message is that the same direction now costs twice as much in risk terms, and anyone in position must reduce exposure or widen the stop rather than carrying on as before.
## Input parameters
| Parameter | Default | Description |
|---|---|---|
| `InpPeriod` | 60 | Bars used for the regression. Short windows hug price closely but with unstable bands; long windows give a more reliable underlying trend. |
| `InpBandMult` | 2.00 | Band width in standard errors. With 2.00 roughly 95 per cent of residuals stay inside the bands when dispersion is regular. |
| `InpFlatSlope` | 0.05 | Minimum slope, measured in standard errors per bar, below which the baseline is drawn grey. |
| `InpAppliedPrice` | PRICE_CLOSE | Price the regression is computed on. |
## Advantages / strengths
- It fixes a structural flaw of classic volatility bands, which widen precisely in the most orderly trends.
- Band width becomes a direct measure of the quality of the move, not merely of its size.
- The colouring threshold is expressed in statistical units, so it stays valid moving from EURUSD to an equity index.
- No repaint, and levels directly usable for stop placement.
## Limitations and warnings
- Linear regression describes curved moves poorly: in a parabolic acceleration residuals grow and the bands widen even though the trend is solid.
- It requires two passes over the window per bar, making it heavier than a standard deviation based band.
- With short windows the standard error estimate is noisy and the bands breathe in a way that reads poorly.
- Like every regression based tool it lags turning points: the baseline turns after price, never before.
**No repaint:** values printed on a closed bar are never modified afterwards.
**Disclaimer.** This product is a technical analysis tool, not an automated trading system, and it offers no profit guarantee whatsoever. Financial markets carry the risk of total loss of the invested capital. Past performance is not indicative of future results. Every signal must be confirmed with your own analysis, a money management plan and prior testing on a demo account. The author is not responsible for trading decisions taken on the basis of this indicator.
## Suggested tags / keywords for MQL5
`regression`, `bands`, `volatility`, `standard error`, `trend`, `channel`, `no repaint`, `statistics`