Multi Scale Trend Agreement
- インディケータ
- バージョン: 1.0
- アクティベーション: 5

# Multi Scale Trend Agreement - Consensus across eight horizons
*Category: Trend | Difficulty: beginner | Window: separate window below the chart | Markets: Universal (Forex, indices, commodities, crypto, stocks) | Suggested timeframes: M5, M15, M30, H1, H4, D1*
## Short description
> Checks price position against its own average on eight geometrically spaced scales and condenses the result into a single score from -100 to +100.
### Overview
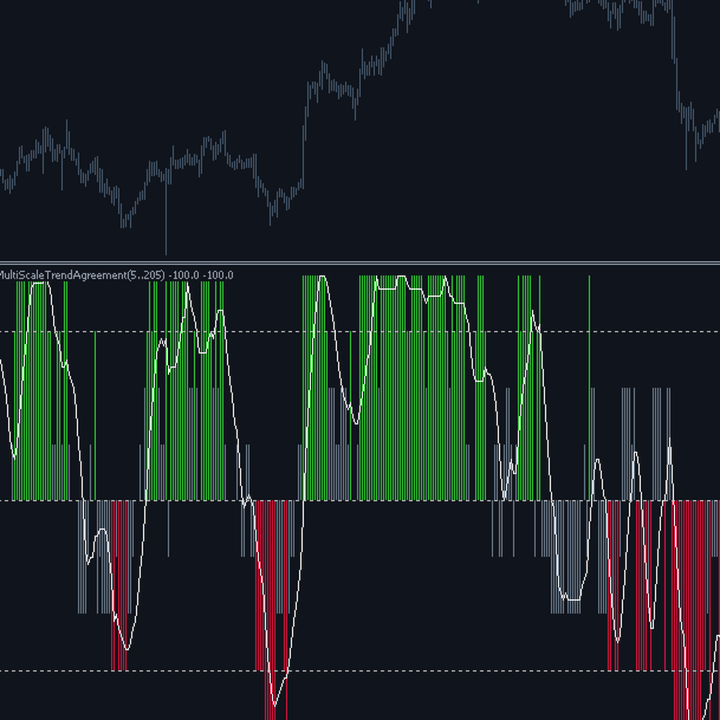
A trend worth the name is recognised from whatever horizon you look at it. Multi Scale Trend Agreement turns that idea into a number: it builds eight moving averages with geometrically spaced periods, from shortest to longest, and simply counts how many have price above and how many below. The resulting score is +100 when price is above all eight, -100 when below all of them, and intermediate values when horizons conflict. The interesting figure is not the position of any single average, which any ribbon already shows, but the degree of consensus: a score of +100 is qualitatively different from a score of +25, even though price is rising in both cases.
### How the calculation works
1. The eight periods start from InpBasePeriod and grow by multiplying by InpGrowth, with a guard preventing duplicate periods for low growth factors.
2. For each period a simple moving average of the applied price is computed over the corresponding window.
3. Each average casts a vote: plus one if price is above it, minus one if below, zero when they coincide.
4. Scales longer than the available history are simply skipped, avoiding out of range access on the first bars of the chart.
5. The sum of votes is rescaled to the -100 to +100 range and coloured when it exceeds the InpStrongLevel threshold.
6. A signal average smooths the step jumps typical of a discrete score with nine possible values.
### How to use it
- Treat only full consensus contexts as tradable: above the positive threshold look for longs, below the negative one look for shorts.
- The central zone is to be avoided: horizons disagree and most trend following systems lose money precisely there.
- A shift from full positive to full negative consensus, or vice versa, is a meaningful regime change and should be handled by closing existing positions.
- On slow charts lower InpGrowth to pack more short scales; on fast charts raise it to reach longer horizons.
- Used on two adjacent timeframes it offers an immediate consistency check before opening a position.
### Who it is for and on which timeframes
It is the easiest to grasp of the whole category and therefore suits beginners too: the idea of counting how many averages have been crossed requires no statistical background. It works on all timeframes, with the caveat that on the lowest ones the short scale oscillates a lot and the signal average should be preferred over the raw score. It is particularly suited as a filter placed in front of an existing strategy, to rule out phases where horizons disagree.
### Practical example of reading a signal
On BTCUSD H4 the score has been at +100 for two weeks: price is above all eight averages, from the shortest to the one spanning over three hundred bars. A correction arrives: the score drops to +50, because the three shortest scales have been lost while the five long ones hold. The histogram turns grey. This is a pullback inside an intact trend, not a reversal, and a continuation trader can look for an entry right here. If instead over the following sessions the score fell below zero, with at least five scales lost, that would be a regime change rather than a pause.
## Input parameters
| Parameter | Default | Description |
|---|---|---|
| `InpBasePeriod` | 5 | Period of the shortest scale. With 5 the first average reacts almost immediately to price; raising it makes the score steadier but slower. |
| `InpGrowth` | 1.70 | Multiplication factor between one scale and the next. With 1.70 starting from 5 you reach about 210 bars; with 2.00 you would exceed 600. |
| `InpSignalPeriod` | 8 | Period of the average smoothing the score. Useful because the raw score can take only nine values and moves in steps. |
| `InpStrongLevel` | 75.0 | Consensus threshold beyond which the trend is deemed strong and the histogram coloured. With 75 at least seven of eight scales must agree. |
| `InpAppliedPrice` | PRICE_CLOSE | Price compared with the averages and used to compute them. |
## Advantages / strengths
- Immediate concept, no formula to grasp: it is a vote count.
- A single number summarises eight time horizons, ideal for quickly scanning many instruments.
- It clearly separates a pullback inside the trend, which lowers the score without reversing it, from a regime change.
- No repaint and entirely independent of price scale.
## Limitations and warnings
- The raw score can only take nine values: it moves in steps and without the signal average it reads poorly.
- It treats a one point cross the same as a hundred point one: it does not weight how far price sits from the average.
- Simple averages over eight windows require more computation than a recursive ribbon: the first pass on long histories is not instantaneous.
- Like every average based filter it lags turning points: it is a confirmation tool, not an anticipation one.
**No repaint:** values printed on a closed bar are never modified afterwards.
**Disclaimer.** This product is a technical analysis tool, not an automated trading system, and it offers no profit guarantee whatsoever. Financial markets carry the risk of total loss of the invested capital. Past performance is not indicative of future results. Every signal must be confirmed with your own analysis, a money management plan and prior testing on a demo account. The author is not responsible for trading decisions taken on the basis of this indicator.
## Suggested tags / keywords for MQL5
`trend`, `moving average`, `consensus`, `multi scale`, `trend filter`, `oscillator`, `no repaint`, `regime`