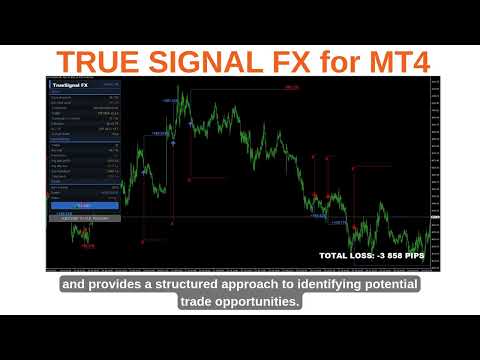
True Signal FX

True Signal FX は、MetaTrader 4 向けに開発されたマルチタイムフレーム対応のトレードインジケーターです。チャート上で、1つの取引シナリオを構成するために必要な情報をまとめて表示します。

このインジケーターは単一の方向シグナルだけを表示するのではなく、市場分析、シグナル確認、取引レベルの計算を1つの画面に統合します。取引シナリオが検出されると、売買方向、エントリー(Entry)、ストップロス(Stop Loss)、テイクプロフィット(Take Profit)、現在のシグナルスコア、市場状態に関する情報を確認できます。

True Signal FX は、複数のテクニカル指標を毎回手動で比較し、それぞれの取引機会について取引レベルを個別に計算するのではなく、明確に定義された取引シナリオを基準として判断したいトレーダー向けに設計されています。

True Signal FX は自動で注文を発注しません。インジケーターは分析結果と取引シナリオを提供し、最終的な取引判断および注文の執行はトレーダー自身が行います。

動作原理

True Signal FX は、選択された複数の時間足で市場を分析し、BUY と SELL のスコアを個別に計算します。

デフォルト設定では M5、M15、M30、H1、H4 を使用します。最大5つの分析時間足を個別に設定できます。

また、新しい取引シナリオを有効化する条件を判定するため、独立した Trigger Timeframe を使用します。デフォルトの Trigger Timeframe は M1 です。

シグナルエンジンでは、Moving Average、RSI、MACD、Stochastic、CCI、ADX、Bollinger Bands、Momentum、Parabolic SAR、Williams %R など、複数のテクニカル分析コンポーネントを使用します。

これらのコンポーネントは選択された時間足ごとに計算され、内部的な市場評価に使用されます。True Signal FX の具体的な計算式、各パラメータのウェイト、および最終的な判定ロジックは独自アルゴリズムに含まれるため公開していません。

最終的な結果は BUY または SELL の取引シナリオとして表示され、それぞれに対応する取引レベルが提示されます。

取引シナリオ

BUY シナリオが検出されると、チャート上に Entry、計算された Stop Loss、Take Profit が表示されます。

SELL シナリオが検出された場合も、対応する Entry、Stop Loss、Take Profit の各レベルが表示されます。

これらのレベルは、選択された SL/TP モードに基づいて自動的に計算されます。

そのため、トレーダーはシグナルごとに Entry、Stop Loss、Take Profit の距離を個別に計算する必要がありません。

取引シナリオは、次のように整理できます。

売買方向 → Entry → Stop Loss → Take Profit

InpShowLevels を有効にすると、該当する取引レベルがチャート上に表示されます。

マルチタイムフレーム分析

True Signal FX は、最大5つの独立した分析時間足に対応しています。

デフォルト設定は M5/M15/M30/H1/H4 です。

InpTF1、InpTF2、InpTF3、InpTF4、InpTF5 は、シグナルエンジンで使用する分析時間足を指定します。それぞれ個別に変更できます。

選択した時間足によって、シグナル計算で使用される市場コンテキストが決まります。そのため、これらのパラメータを変更すると、BUY/SELL スコアや取引シナリオの発生頻度が変化する場合があります。

InpTriggerTF は独立した Trigger Timeframe を指定します。デフォルト値は M1 です。

複数の時間足による分析と独立した Trigger Timeframe を組み合わせることで、より広い市場コンテキストと、取引シナリオを有効化するための短期的な市場条件を同時に考慮できます。

シグナルスコア

インジケーターの情報パネルには、BUY スコアと SELL スコアが個別に表示されます。

InpMinScore は、シグナルを有効化するために必要な最低スコアを指定します。デフォルト値は 30 です。

InpMinScore を高くすると、シグナルが有効になるための条件が厳しくなります。値を低くすると、より低いスコアの取引シナリオも有効になる可能性があります。

スコアは、選択した時間足や Trigger の設定と合わせて確認してください。これらのパラメータを変更すると、検出される取引シナリオの数や発生タイミングが変化する場合があります。

Trigger 設定

Trigger は Stochastic をベースとした計算メカニズムを使用し、選択された Trigger Timeframe 上で動作します。

InpTrigK — Trigger Stochastic の K 期間。デフォルト値:5。

InpTrigD — D 期間。デフォルト値:3。

InpTrigSlow — 平滑化パラメータ。デフォルト値:3。

InpOverbought — 上側の Trigger レベル。デフォルト値:80。

InpOversold — 下側の Trigger レベル。デフォルト値:20。

これらのパラメータは Trigger コンポーネントの感度および有効化される領域に影響します。シグナル頻度や Trigger の感度を変更したい場合に調整できます。

初めて使用する場合は、デフォルト値のまま使用することを推奨します。

Stop Loss と Take Profit

True Signal FX では、Stop Loss と Take Profit の計算方法として、ATR モードと固定距離モードの2種類を使用できます。

InpSLTPMode で計算方式を選択します。

ATR モード

ATR モードでは、計算される取引レベルの距離を現在の市場ボラティリティに基づいて決定します。

InpATRPeriod — ATR の計算期間。デフォルト値:14。

InpATRSLx — Stop Loss に使用する ATR 倍率。デフォルト値:6.0。

InpATRTPx — Take Profit に使用する ATR 倍率。デフォルト値:4.0。

InpATRSLx を大きくすると、計算される Stop Loss は Entry からより遠くなります。InpATRTPx を大きくすると、計算される Take Profit は Entry からより遠くなります。

ATR モードでは、現在の市場ボラティリティに応じて取引レベルの距離を変化させることができます。

固定距離モード

固定距離モードでは、あらかじめ設定した距離を使用します。

InpSLPips — Stop Loss の距離。デフォルト値:300。

InpTPPips — Take Profit の距離。デフォルト値:250。

固定された SL/TP 構成を使用したい場合に、このモードを選択できます。

InpCostPips — 過去の結果を計算する際に使用する推定取引コスト。デフォルト値:1.5。

このパラメータは表示される過去の統計値にのみ影響し、ブローカーが実際に適用するスプレッドや手数料を変更するものではありません。

自動パラメータ調整(Auto-Tune)

True Signal FX には Auto-Tune 機能が搭載されており、過去の市場データを使用して異なるインジケーター設定を自動的にテストできます。

Auto-Tune の目的は、異なるパラメータ構成を手動で一つずつ試すための作業量を減らすことです。

有効にしたオプションに応じて、Auto-Tune はシグナル閾値、Trigger パラメータ、テクニカル指標のパラメータ、分析時間足、および SL/TP パラメータを変更できます。

InpTuneTimeframes — Auto-Tune に分析時間足を自動的に変更させます。

InpTuneSLTP — Auto-Tune に Stop Loss と Take Profit のパラメータを自動的に変更させます。

InpTuneAttempts — Auto-Tune でテストする最大設定数。デフォルト値:10。

InpTuneMinTrades — Auto-Tune に必要な最低過去取引シナリオ数。デフォルト値:3。

InpShowButton — チャート上の AUTO-TUNE ボタンの表示を制御します。

InpLogPreset — 生成された Preset 情報を MetaTrader のログに書き込むかどうかを制御します。

Auto-Tune が完了すると、生成された設定がインジケーターで使用され、現在の Preset が情報パネルに表示されます。

Auto-Tune は過去のデータに基づいて動作します。過去の市場環境で得られた設定が、将来の市場環境でも同じ結果になることを保証するものではありません。

過去データの計算

True Signal FX は、現在選択されている設定に基づいて過去の取引シナリオを計算します。

過去のシナリオについて Entry、Stop Loss、Take Profit を計算し、その後の価格変動を設定された条件に基づいて評価します。

この過去データの計算結果は、PERFORMANCE セクションの統計情報を作成するために使用されます。

InpMaxBars — インジケーターが処理する過去の最大バー数。デフォルト値:3000。

InpMaxTradeBars — 過去の取引シナリオが有効な状態を維持できる最大バー数。0 に設定すると、この制限は無効になります。

処理する過去データの量によって、計算される取引シナリオの数および最終的な統計結果が変化します。

過去のパフォーマンス統計

PERFORMANCE セクションでは、現在の設定に基づく過去の取引シナリオの統計情報を確認できます。

Trades — 計算された取引シナリオの数。

Win Rate — 計算結果がマイナスにならなかった取引シナリオの割合。

Profit Factor — 累積利益と累積損失の比率。

Avg Take Profit — プラスの結果となった取引シナリオの平均結果。

Avg Stop Loss — マイナスの結果となった取引シナリオの平均結果。

Avg Drawdown — 計算された取引シナリオにおける平均的な逆行幅。

Total Result — Pips 単位での累積結果。

これらの数値は、過去データに基づいて異なる設定を分析・比較するためのものです。将来の取引結果を予測するものとして解釈しないでください。

情報パネル

情報パネルは主に SETUP、PERFORMANCE、ENGINE の3つのセクションで構成されています。

SETUP には、現在のスコア閾値、BUY/SELL スコア、選択された時間足、Trigger パラメータ、Overbought/Oversold レベル、分析コンポーネント数、および選択中の SL/TP モードが表示されます。

PERFORMANCE には過去データの計算結果が表示されます。

ENGINE には処理されたバー数、現在の Preset、およびインジケーターの現在の計算状態が表示されます。

このパネルを使用することで、複数の追加インジケーターウィンドウを開かなくても、主要な情報をチャート上で確認できます。

テクニカル指標パラメータ

以下のパラメータは、シグナルエンジンで使用される各テクニカル分析コンポーネントの計算方法を制御します。

InpMAFast — 高速 Moving Average の期間。デフォルト値:14。

InpMASlow — 低速 Moving Average の期間。デフォルト値:50。

InpMAMethod — Moving Average の計算方式。デフォルト値:EMA。

InpRSIPeriod — RSI の期間。デフォルト値:14。

InpMACDFast、InpMACDSlow、InpMACDSignal — MACD の高速期間、低速期間、シグナル期間。デフォルト値:12、26、9。

InpStochK、InpStochD、InpStochSlow — Stochastic の K、D、Slow パラメータ。デフォルト値:14、3、3。

InpCCIPeriod — CCI の期間。デフォルト値:14。

InpADXPeriod — ADX の期間。デフォルト値:14。

InpBBPeriod — Bollinger Bands の期間。デフォルト値:20。

InpBBDeviation — Bollinger Bands の偏差値。デフォルト値:2.0。

InpMomPeriod — Momentum の期間。デフォルト値:14。

InpSARStep — Parabolic SAR の Step。デフォルト値:0.02。

InpSARMaximum — Parabolic SAR の最大加速係数。デフォルト値:0.20。

InpWPRPeriod — Williams %R の期間。デフォルト値:14。

これらのパラメータは、シグナルエンジン内の各テクニカル分析コンポーネントの計算結果に影響します。変更すると、BUY/SELL スコアや取引シナリオの発生頻度が変化する場合があります。

シグナルの内部ウェイトおよび最終的な判定式は独自アルゴリズムに含まれるため公開していません。

表示・チャート設定

InpShowPanel — 情報パネルを表示または非表示にします。

InpShowTotal — 累積計算結果の表示を制御します。

InpUIScale — インターフェースのスケールを制御します。0 に設定すると、DPI に基づく自動スケーリングが使用されます。

InpPanelX、InpPanelY — 情報パネルの水平位置と垂直位置を設定します。

InpPanelW — パネルの幅を設定します。

InpFontSize、InpFontName、InpFontBold — パネルのフォントサイズ、フォント名、太字表示を設定します。

InpShowLevels — チャート上で Entry、Stop Loss、Take Profit を表示するかどうかを制御します。デフォルト値:true。

InpShowProfit — 過去の取引シナリオの結果を表示するかどうかを制御します。

InpLots — 計算された Pips 結果を金額に換算するためだけに使用されます。デフォルト値:0.1。このパラメータによって注文が発注・管理されることはありません。

InpArrowATRx — ATR 倍率を使用して、シグナル矢印と価格との距離を設定します。デフォルト値:0.6。

InpBuyColor、InpSellColor — BUY および SELL シグナルの色を設定します。

その他のパネルカラー関連パラメータは、情報パネルの表示デザインを制御するためのものであり、シグナル計算には影響しません。

アラートと診断

InpAlerts — 新しいシグナルが生成された際のアラートを有効または無効にします。デフォルト値:false。

InpDebug — MetaTrader のログに追加の診断情報を表示するかどうかを制御します。デフォルト値:false。

通常の使用では InpDebug を無効にしておくことを推奨します。

推奨する初期設定

True Signal FX を初めて使用する場合は、まずデフォルト設定を使用することを推奨します。

インジケーターを MetaTrader 4 の目的のチャートに追加した後、インジケーターの読み込みと過去データの計算が完了するまで待ちます。その後、SETUP、PERFORMANCE、ENGINE の各セクションを確認してください。

特定の銘柄やトレード方法に合わせて別の設定をテストしたい場合は、AUTO-TUNE を使用できます。

手動で設定を変更する場合は、一度に1つの論理的なパラメータグループだけを変更することを推奨します。これにより、特定の変更が取引シナリオや過去の統計結果にどのような影響を与えたかを確認しやすくなります。

手動設定では、まず分析時間足、Trigger 設定、シグナルスコアの閾値、および SL/TP モードを確認することを推奨します。

True Signal FX の使用方法

  1. True Signal FX を MetaTrader 4 の目的のチャートに追加します。
  2. インジケーターが読み込まれ、過去データの計算が完了するまで待ちます。
  3. 現在の分析時間足、BUY/SELL スコア、およびインジケーターの状態を確認します。
  4. 必要に応じて AUTO-TUNE を使用して別の設定をテストし、調整処理が完了するまで待ちます。
  5. BUY または SELL の取引シナリオが表示されたら、チャート上の Entry、Stop Loss、Take Profit を確認します。
  6. 自分のトレードプラン、リスク管理、現在の市場環境に基づいて、その取引シナリオを評価します。
  7. 取引を実行すると判断した場合は、ブローカーが提供する通常の取引画面から手動で注文を発注します。

True Signal FX が注文を自動的に発注、変更、決済することはありません。

対象となるトレーダー

True Signal FX は、市場における潜在的な取引シナリオを体系的に分析したいトレーダー向けに設計されています。

初心者にとっては、売買方向、Entry、Stop Loss、Take Profit など、潜在的な取引シナリオを構成する主要な要素を1つの画面にまとめて確認できるため、手動での計算や複数の情報を整理する作業を減らせます。

経験豊富なトレーダーにとっては、マルチタイムフレームによる市場分析や取引シナリオのフィルタリングを行うための追加分析ツールとして使用できます。

複数の銘柄を定期的に分析するトレーダーにとっては、Auto-Tune を使用することで、多数のパラメータを一つずつ手動で変更することなく、異なる設定をテストできます。

取引フロー

一般的なチャート分析では、複数のインジケーターを開き、それぞれの結果を比較し、それらが一致する市場条件を示しているかを判断したうえで Entry を決定し、Stop Loss と Take Profit を別途計算する必要があります。

True Signal FX は、これらの作業を1つの分析フローにまとめます。

トレーダーは同じチャート上で、市場スコア、売買方向、計算された取引レベルを確認できます。また、PERFORMANCE セクションから現在の設定に基づく過去の統計情報も確認できます。

そのため、このインジケーターは単なる方向シグナルの生成だけではなく、明確に定義された1つの取引シナリオとして情報を整理して表示することを目的としています。
おすすめのプロダクト
Phase Analytics Pro: Advanced Cyclic Market Analyzer Phase Analytics Pro is a sophisticated technical tool designed for traders who prioritize mathematical precision over lag-heavy traditional indicators. Based on the principles of digital signal processing, this indicator decomposes price action into phase and quadrature components to identify the dominant market cycle. How it works: The algorithm calculates the instantaneous phase of the market, allowing it to distinguish between trending and
Matrix is a Forex arrow indicator. Displays signals simply and clearly! The arrows show the direction of the transaction, and are colored accordingly, which can be seen in the screenshots. As you can see, trading with such an indicator is easy. I waited for an arrow to appear in the desired direction - I opened a deal. An arrow formed in the opposite direction - closed the deal. The indicator also displays the lines with the help of which the arrow signals are formed, taking into account the int
This is a trend indicator without redrawing Developed instead of the binary options strategy (by the color of the Martingale candlestick) Also works well in forex trading When to open trades (binary options) A signal will appear in the place with a candle signaling the current candle It is recommended to open a deal for one candle of the current timeframe M1 and M5 When a blue dot appears, open a deal up When a red dot appears, open a trade down. How to open trades on Forex. When a signal is rec
EZZ Elite Zig Zag is an indicator for the MetaTrader 4 terminal. This indicator traces the peak of the trend based on the market reversal, thus showing various opportunities in the financial market. EZZ Elite Zig Zag is a visual tool, intuitive, and easy to understand and use.  Test it Yourself by Downloading it for Free. Author Paulo Rocha all rights reserved
Noize Absorption Index - is the manual trading system that measures the difference of pressure between bears forces and bulls forces. Green line - is a noize free index that showing curent situation. Zero value of index shows totally choppy/flat market.Values above zero level shows how powerfull bullish wave is and values below zero measures bearish forces.Up arrow appears on bearish market when it's ready to reverse, dn arrow appears on weak bullish market, as a result of reverse expectation. S
Trade with Gann on your side!! MASTER CIRCLE 360 CIRCLE CHART, originally created by Gann admitted that this is “The Mother of all charts”. It is one of the last studies that this great trader left for us. The numeric tab le is apparently quite simple like all the tables and is based on square numbers, the SQUARE OF 12 and is by evolution, one of the most important square numbers. Here we can find CYCLE, PRICE AND TIME thanks to angles and grades, to show past and future support and resistance.
The Point61 indicator is the result of many years of monitoring of price behavior of currency pairs and metals. It is not a secret, that in times of uncertainty, traders are looking for possible levels of support and resistance - the point, where price should stop its movement. There are 2 possible scenarios at these points: 1. Reverse (correction) to the opposite direction; 2. Breakthrough to continue movement. Very often these points are used to set stop orders - TakeProfit or StopLoss
## Smart Reversal Oscillator Pro Smart Reversal Oscillator Pro is an advanced hybrid trading utility designed for MetaTrader 4 that reinvents volatility and momentum analysis. Instead of analyzing raw price action, this indicator applies mathematical Bollinger Bands directly onto the Relative Strength Index (RSI) array data within a separate sub-window. Standard fixed oversold and overbought levels (like 30 and 70) often fail during strong market expansions. This professional oscillator solve
これは、キャンドルの終値を予測する指標です。 このインジケータは、主にD1チャートでの使用を目的としていますが. この指標は、従来の外国為替取引とバイナリオプション取引の両方に適しています。 インジケーターは、スタンドアロンのトレーディングシステムとして使用することも、既存のトレーディングシステムへの追加として機能させることもできます。 このインジケーターは、現在のキャンドルを分析し、キャンドル自体の内部の特定の強度係数と、前のキャンドルのパラメーターを計算します。 したがって、この指標は、市場の動きのさらなる方向性と現在のキャンドルの終値を予測します。 この方法のおかげで、この指標は、短期の日中取引だけでなく、中期および長期の取引にも適しています。 インジケーターを使用すると、市場の状況の分析中にインジケーターが生成する潜在的な信号の数を設定できます。 インジケーターの設定には、このための特別なパラメーターがあります。 また、インジケーターは、チャート上のメッセージの形式で、電子メールで、およびPUSH通知の形式で、新しい信号について通知することができます。 購入後は必ず私に書いて


Money Flow Profile MT5 HERE   Here   our more valuable tools SMC Trend Trading   ,  Easy SMC Trading  ,  Institutional SMC Architect Volume Analysis Tools  ,  Volume flow Profile  ,  Market volume profile  , FVG with Volume  , Liquidity Heatmap Profile  ,  Volume Spread Analysis This Master Edition is engineered for clarity and speed, featuring a unique Auto-Theme Sync system that instantly beautifies your chart layout upon loading. Key Features: True Money Flow Calculation: Goes beyond stand
We present you the indicator "Candle closing counter", which will become your indispensable assistant in the world of trading. That’s why knowing when the candle will close can help: If you like to trade using candle patterns, you will know when the candle will be closed. This indicator will allow you to check if a known pattern has formed and if there is a possibility of trading. The indicator will help you to prepare for market opening and market closure. You can set a timer to create a pre
"The trend is your friend" is one of the best known sayings in investing, because capturing large trendy price movements can be extremely profitable. However, trading with the trend is often easier said than done, because many indicators are based on price reversals not trends. These aren't very effective at identifying trendy periods, or predicting whether trends will continue. We developed the Trendiness Index to help address this problem by indicating the strength and direction of price trend
The Gann Box (or Gann Square) is a market analysis method based on the "Mathematical formula for market predictions" article by W.D. Gann. This indicator can plot three models of Squares: 90, 52(104), 144. There are six variants of grids and two variants of arcs. You can plot multiple squares on one chart simultaneously Parameters Square — selection of a Gann square model: 90 — square of 90 (or square of nine); 52 (104) — square of 52 (or 104); 144 — universal square of 144; 144 (full) — "full
Heiken Ashi candle chart is an improved version of The Japanese candle chart, which can effectively filter the market "noise" of the Japanese candle chart. It is favored by many traders for its simplicity and intuition. For trend traders, the HA candle chart is a magic tool. Unlike the traditional Japanese candle chart, Heikenashi does not reflect the opening price, high price, low price and closing price of the market. Instead, Heikenashi calculates the value of a single K line in the dominant
概要 Candle Timer Countdown Pro for MT4 は、MetaTrader 4 向けのローソク足クローズ・カウントダウンインジケーターです。現在のローソク足が閉じるまでの残り時間をチャート上に表示し、円形の進捗アークと組み合わせることで、ローソク足が今どの段階にあるかを一目で把握できます。 新しい tick が届いたときだけ更新される一般的なカウントダウンインジケーターとは異なり、このインジケーターはサーバー時間のアンカーとローカル時計による補間を使用します。tick が少ない場面でも安定したカウントダウン表示を維持し、停止、急なジャンプ、時間のずれを抑えます。 M1 チャートで短期売買を行う場合でも、H1、H4、D1 チャートでトレンドやローソク足パターンを確認する場合でも、現在のローソク足がいつ閉じるかを正確に把握することは、エントリータイミングの改善、終値ベースの形状確認、早すぎる判断の回避に役立ちます。 このタイマーが異なる理由 多くの MT4 カウントダウンインジケーターは主に TimeCurrent() に依存しています。MetaTrader 4
フィボナッチリトレースと拡張ラインツール DiNapoliポイント取引方法とゴールデンセクション取引を使用するトレーダーにとって理想的なMT4プラットフォームのフィボナッチリトレースと拡張ラインツール 主な特長: あなたはフィボナッチリトレースメントの複数のセットを直接描くことができ、重要なリターンポイント間の関係は一目瞭然です。 2.フィボナッチ拡張を描画することができます。 3.フィボナッチフォールドバックとラインの延長は、簡単な観察と数値表示のために左右に動かすことができます。 4.チャートは非常に爽やかな 5.数字キーでサイクルを切り替えることができます。 ファンクションキー: 1。 [戻るを押す、要求に応じて描画する、最大8つのグループにする 2。拡張]を描くには[押す] 3。 \を押すと、現在のサイクルの下にあるすべての拡張機能と折り畳みが削除されます 4。フォールドバックを移動して削除して展開する (1)最初のフォールドバックセットのF5行をクリックします。 一度クリックすると(黄色に変わります)、キーボードのDeleteキーを押すと、フォーカ
VR Cub
Vladimir Pastushak
VR Cub は、質の高いエントリーポイントを獲得するためのインジケーターです。このインジケーターは、数学的計算を容易にし、ポジションへのエントリーポイントの検索を簡素化するために開発されました。このインジケーターが作成されたトレーディング戦略は、長年にわたってその有効性が証明されてきました。取引戦略のシンプルさはその大きな利点であり、初心者のトレーダーでもうまく取引することができます。 VR Cub はポジション開始ポイントとテイクプロフィットとストップロスのターゲットレベルを計算し、効率と使いやすさを大幅に向上させます。取引の簡単なルールを理解するには、以下の戦略を使用した取引のスクリーンショットを見てください。 設定、設定ファイル、デモ版、説明書、問題解決方法は、以下から入手できます。 [ブログ] レビューを読んだり書いたりすることができます。 [リンク] のバージョン [MetaTrader 5] エントリーポイントの計算ルール ポジションをオープンする エントリーポイントを計算するには、VR Cub ツールを最後の高値から最後の安値までストレッチする必要があります。 最初
Title : Market Bias Indicator - Oscillator-Based Trading Tool Introduction : Discover the potential of the "Market Bias Indicator," a revolutionary oscillator-based trading tool designed for precise market analysis. If you're in search of a robust alternative to traditional bias indicators, your quest ends here. Market Bias Indicator offers unparalleled accuracy in identifying market sentiment and is your gateway to confident trading decisions. Recommended Trading Pairs : Market Bias Indicator i
Professional Opening Range Breakout (ORB) indicator designed for precision session trading with automatic time handling, breakout alerts, and advanced target levels. This indicator automatically identifies the Opening Range for any configurable session, plots the High, Low, and Midpoint levels, and extends them across the trading day. Built-in breakout detection and alerts, range measurements, and extension targets provide traders with clear structure and actionable levels. Ideal for traders usi
This unique multi-currency strategy simultaneously determines the strength of trends and market entry points, visualizing this using histograms on the chart. The indicator is optimally adapted for trading on the timeframes М5, М15, М30, Н1. For the convenience of users, the indicator renders the entry point (in the form of an arrow), recommended take profit levels (TP1, TP2 with text labels) and the recommended Stop Loss level. The take profit levels (TP1, TP2) are automatically calculated for
The Stepping Trend Indicator     The Steppi ng Trend indicator uses the  average true range  (ATR indicator) in its calculation. This gives you control to set your own average true range period, I set the Default as 10.   Indicator Details. Green Arrow Up: This means you are at the starting point of a new bullish trend, it’s time to buy.   Red  Arrow  Down : This means you are at the starting point of a new  bearish  trend, it’ s time to sell .   What if you miss the Arrow Signal?   No prob
Super Reversal Pattern Indicator Unlock the power of advanced pattern recognition with our Super Reversal Pattern Indicator. Designed for traders seeking precision and reliability, this indicator identifies one of the most effective reversal patterns in technical analysis, offering a significant edge in your trading strategy. Key Features: Non-Repainting Accuracy: Enjoy the confidence of non-repainting technology. Once a Super Reversal Pattern is detected, it remains static, providing consiste
Color Stochastic Enhanced Stochastic Oscillator with Cross Detection and Visual Signal Support Overview Color Stochastic is a customized version of the classic Stochastic Oscillator designed for momentum analysis and crossover visualization. The indicator provides color-based signal marking and configurable crossover detection at user-defined overbought and oversold levels. It can be used as part of: Momentum analysis Mean reversion workflows DCA-based strategies Multi-indicator confirmation sys
TWO PAIRS SQUARE HEDGE METER INDICATOR Try this brilliant 2 pairs square indicator It draws a square wave of the relation between your two inputs symbols when square wave indicates -1 then it is very great opportunity to SELL pair1 and BUY Pair2 when square wave indicates +1 then it is very great opportunity to BUY pair1 and SELL Pair2 the inputs are : 2 pairs of symbols         then index value : i use 20 for M30 charts ( you can try other values : 40/50 for M15 , : 30 for M30 , : 10 for H1 ,
Improved version of the free HMA Trend indicator (for MetaTrader 4) with statistical analysis. HMA Trend is a trend indicator based on the Hull Moving Average (HMA) with two periods. HMA with a slow period identifies the trend, while HMA with a fast period determines the short-term movements and signals in the trend direction. The main differences from the free version: Ability to predict the probability of a trend reversal using analysis of history data. Plotting statistical charts for analyzi
数列の一つに「森林火災数列」があります。これは、最も美しい新しいシーケンスの 1 つとして認識されています。その主な特徴は、このシーケンスが線形トレンドを回避することです。最短のものであってもです。この指標の基礎を形成したのはこのプロパティです。 財務時系列を分析する場合、この指標は可能なすべての傾向オプションを拒否しようとします。そして失敗した場合にのみ、トレンドの存在を認識し、適切なシグナルを発します。このアプローチにより、新しいトレンドの始まりの瞬間を正しく判断できます。ただし、偽陽性の可能性もあります。それらの数を減らすために、このインジケーターに追加のフィルターが追加されました。新しいバーが開くとシグナルが生成されます。いずれの場合も再描画は発生しません。 指標パラメータ: Applied Price - 適用価格定数; Period Main - インディケータのメイン期間、その有効な値は 5 ~ 60 です。 Period Additional - 追加の期間。このパラメーターの有効な値は 5 ~ 40 です。 Signal Filter - 追加の信号フィルター、有効
All-in-One Trade Indicator (AOTI) は、14種類の通貨ペアの日次目標レベルを自動的に算出し、あらゆる取引銘柄に対応するテクニカル分析ツールを1つのウィンドウに統合します。トレンド判定のための Double Channel、Price Channel、MA Bands、Climax Bars 検出機能、フィボナッチレベル、サポート・レジスタンスのマイクロレベル、矢印による反転シグナルを搭載しています。MetaTrader 4 プラットフォームで動作します。 日次レベルは、EURUSD、EURJPY、GBPUSD、USDCHF、EURGBP、EURCAD、EURAUD、AUDJPY、GBPAUD、GBPCAD、GBPCHF、GBPJPY、AUDUSD、および USDJPY に対して算出されます。その他のすべてのモジュールは、あらゆる取引銘柄で使用できます。 購入後、無料の AOTI-EA-Assistant を受け取るには、私に直接ご連絡ください。これは補助型の Expert Advisor(EA)であり、AOTI の日次レベルに基づく Simplest L
Heiken Ashi Pro
Nguyen Hang Hai Ha
5 (1)
Heiken Ashi Pro is a more advanced version than the default Heiken Ashi version of Metatrader 4. Features: Automatic change width when zooming ON / OFF button to display candles or not Options for changing colors The Heikin-Ashi technique is used by technical traders to identify a given trend more easily. Because the Heikin-Ashi technique smooths price information over two periods, it makes trends, price patterns, and reversal points easier to spot. Candles on a traditional candlestick chart fre
Was: $249  Now: $99   Market Profile defines a number of day types that can help the trader to determine market behaviour. A key feature is the Value Area, representing the range of price action where 70% of trading took place. Understanding the Value Area can give traders valuable insight into market direction and establish the higher odds trade. It is an excellent addition to any system you may be using. Blahtech Limited presents their Market Profile indicator for the MetaTrader community. Ins
トレンドオシレーターは、高度なカスタム Crypto_Forex インジケーター、効率的な取引ツールです! - 高度な新しい計算方法を使用 - パラメーター「計算価格」のオプションは 20 種類。 - これまで開発された中で最もスムーズなオシレーター。 - 上昇トレンドの場合は緑色、下降トレンドの場合は赤色。 - 売られすぎの値: 5 未満、買われすぎの値: 95 以上。 - このインジケーターを使用すると、標準戦略をアップグレードする機会が十分にあります。 - PC およびモバイルアラート付き。 高品質のトレーディングロボットとインジケーターをご覧になるにはここをクリックしてください! これは、この MQL5 Web サイトでのみ提供されるオリジナル製品です。
このプロダクトを購入した人は以下も購入しています
Trend SniperX MT4
Sarvarbek Abduvoxobov
5 (3)
Trend Sniper X は、トレーダーがトレンドの方向性と潜在的な反転ポイントを明確かつ正確に特定できるように設計された、MetaTrader 5 用のマルチタイムフレーム・トレンドフォロー指標です。 MT5版はこちら: https://www.mql5.com/en/market/product/181101 価格情報: 現在の価格はプロモーション価格であり、今後のアップデートや新機能の追加に伴い変更される場合があります。 Code2Profit チャンネル マルチタイムフレーム分析で市場をマスターしよう! Trend Sniper Xで勝率を最大化する方法:ルールとセッションのコツ 技術仕様 プラットフォーム MetaTrader 5 インジケータータイプ マルチタイムフレーム・トレンドインジケーター 動作タイムフレーム すべてのチャート時間足(上位足M1~MN1を独立して選択可能) 主要対象銘柄 為替(Forex)、ゴールド(XAUUSD)、その他のCFD 推奨口座 すべての口座タイプ ビジュアル表示 トレンドカラーローソク足(買い/売り/弱い/変化)+ 買い/売りシグナル
Miraculous Indicator Binary & Forex v3 StrategySafe Miraculous Indicator Binary & Forex v3 StrategySafe は、明確なシグナル、強力な確認ツール、そして Binary と Forex 市場で使える体系的な取引アプローチを求めるトレーダー向けのプロフェッショナル指標です。 v3 では、MIR Dashboard、Miraculous Confirmation Dashboard、GANN Law、Square of 9 レベル、GANN 角度、そしてより高度な Forex モードが搭載されています。 主な特徴 Binary と Forex の両方に対応。 MIR Dashboard による素早い市場分析。 Miraculous Confirmation Dashboard によるエントリー確認。 Forex 分析用の GANN Law drawing lines。 Square of 9 のライン、レベル、方向表示。 1x1 GANN Angle によるトレンド圧力の確認。 Entry I

Scalper Inside PRO は日中トレンドの分析を助け、エントリー前にトレードを組み立てられるインジケーターです。中核となるのは、相場をより正確に読むための3つの専用ストラテジー。シグナルが出た瞬間に方向を自動で判断し、主要な価格帯を計算するので、想定エントリーポイント、予想ストップロス、複数の利確レベルを前もって確認できます。詳細なパフォーマンス統計が、各銘柄とストラテジーが過去にどう機能したかを示し、今の相場に合った資産選びを助けます。単体のスキャルピングツールとしても、あなたのシステムの一部としても、自作 EA のベースとしても使えます。MetaTrader 4 プラットフォームで動作します。 インジケーターはエントリー、3つの利確レベル - TP1、TP2、TP3、そして任意のストップロスをチャート上に直接表示します。自作の矢印インジケーターを接続し、その統計と収益性を検証することも可能です。 ご購入後は直接ご連絡ください。専用のボーナス add-ons、実トレードでの活用に関する追加情報、そしてご自身のトレードシステムや EA への正しい接続のサポートをお渡しします
これはMT4のインジケーターで、再描画なしで取引に参入するための正確なシグナルを提供します。 外国為替、暗号通貨、金属、株式、インデックスなど、あらゆる金融資産に適用できます。かなり正確な見積もりを提供し、取引を開始して終了するのに最適な時期を教えてくれます。1つのシグナルを処理しただけでインジケーターの元が取れた例の 動画 (6:22)をご覧ください。Entry PointsPro インジケーターの助けを借りたほとんどのトレーダーの最初の1週間の結果が改善しています。 Telegramグループ に登録してください。Entry Points Proインジケーターのメリットは次の通りです。 再描画のないエントリーシグナル 再描画されるインジケーターでは一度表示されたシグナルが削除されて大きな金銭的損失につながることがありますが、これと異なり、表示されて確認されたシグナルは消えることがありません。 エラーなしの取引開始 インジケーターアルゴリズムによって取引を開始する(資産を売買する)理想的な瞬間を見つけることができます。それを使用するすべてのトレーダーの成功率が向上します。 あら

Dynamic Forex28 Navigator - 次世代の Forex 取引ツール。 現在 49% オフ。 Dynamic Forex28 Navigator は、長年人気のインジケーターを進化させたもので、3 つの機能を 1 つにまとめています。 Advanced Currency Strength28 インジケーター (レビュー 695 件)  + Advanced Currency IMPULSE with ALERT (レビュー 520 件) + CS28 コンボ シグナル (ボーナス)。 インジケーターの詳細 https://www.mql5.com/en/blogs/post/758844 次世代の Strength インジケーターが提供するもの  オリジナルで気に入っていたすべての機能が、新機能と精度の向上によって強化されました。 主な機能: 独自の通貨強度計算式。 すべての時間枠でスムーズかつ正確な強度ライン。 トレンドの特定と正確なエントリーに最適です。 ダイナミックマーケットフィボナッチレベル (マーケットフィボナッチ)。 このインジケーターに固有

Neuro Poseidon is a new indicator by Daria Rezueva. It combines precise trading signals with adaptive TP/SL levels - creating best possible trades as a result! Message me and get  Neuro Poseidon Assistant  as a gift to automize your trading process! What makes it stand out? 1. Proven profitability on all assets and timeframes 2. Only confirmed BUY and SELL signals present on the chart 3. Adaptive TP & SL levels generated by the software for each trade 4. Easy to understand - suitable for all
ご紹介     Quantum Breakout PRO は 、ブレイクアウト ゾーンの取引方法を変革する画期的な MQL5 インジケーターです。 13年以上の取引経験を持つ経験豊富なトレーダーのチームによって開発された Quantum Breakout PROは 、革新的でダイナミックなブレイクアウトゾーン戦略により、あなたの取引の旅を新たな高みに押し上げるように設計されています。 クォンタム ブレイクアウト インジケーターは、5 つの利益ターゲット ゾーンを備えたブレイクアウト ゾーン上のシグナル矢印と、ブレイクアウト ボックスに基づいたストップロスの提案を提供します。 初心者トレーダーにもプロのトレーダーにも適しています。 量子EAチャネル:       ここをクリック MT5バージョン:   ここをクリック 重要!購入後、インストールマニュアルを受け取るためにプライベートメッセージを送ってください。 推奨事項: 時間枠: M15 通貨ペア: GBPJPY、EURJPY、USDJPY、NZDUSD、XAUUSD アカウントの種類: ECN、Raw、またはスプレッドが非

現在30%OFF! 初心者やエキスパートトレーダーのためのベストソリューション! このダッシュボードソフトウェアは、28の通貨ペアで動作しています。それは私達の主要な指標(高度な通貨の強さ28と高度な通貨インパルス)の2に基づいています。それは全体の外国為替市場の大きい概観を与えます。それは、すべての(9)時間枠で28の外国為替ペアのための高度な通貨の強さの値、通貨の動きの速度と信号を示しています。チャート上で1つのインディケータを使用して市場全体を観察し、トレンドやスキャルピングの機会をピンポイントで見つけることができたら、あなたのトレードがどのように改善されるか想像してみてください。 このインディケータには、強い通貨と弱い通貨の識別、潜在的な取引の識別と確認がより簡単になるような機能が搭載されています。このインディケータは、通貨の強さや弱さが増加しているか減少しているか、また、すべての時間枠でどのように機能しているかをグラフィカルに表示します。 新機能として、現在の市場環境の変化に適応するダイナミックなマーケットフィボナッチレベルが追加され、すでに当社のAdvanced
現在20%OFF! 初心者やエキスパートトレーダーに最適なソリューションです。 このインディケータは、エキゾチックペア・コモディティ・インデックス・先物など、あらゆるシンボルの通貨の強さを表示することに特化したインディケータです。金、銀、原油、DAX、US30、MXN、TRY、CNHなどの通貨の強さを表示するために、9行目にどのシンボルでも追加することができます。独自の機能を多数搭載し、新しい計算式を採用したため、ユニークで高品質、かつ手頃な価格のトレーディングツールとなっています。新しいトレンドやスキャルピングチャンスのトリガーポイントを正確に把握することができるため、あなたのトレードがどのように改善されるか想像してみてください。 ユーザーマニュアル:ここをクリック   https://www.mql5.com/en/blogs/post/708876 すべての時間枠に対応します。あなたはすぐにトレンドを見ることができるようになります! 新しいアルゴリズムに基づいて設計されているため、潜在的な取引の特定と確認がより簡単になります。これは、8つの主要通貨と1つのシンボルの強弱
KURAMA GOLD SIGNAL PRO MT4版 ゴールドのサインに、目で見えるトレード計画を。 ゴールドのサインが出た。利確はどこか。損切りはどこか。エントリー前に何を確認すべきか。 KURAMA GOLD SIGNAL PROは、その判断材料をチャートに集約します。XAUUSDのM5、M15向けに、売買サイン、自動計算TP/SL、3段階のサイン評価、注意すべき相場条件を知らせるMARKETパネルを搭載。 セットアップ、決済目安、相場の注意点を一か所で確認。情報を集める手間を減らし、トレードの判断に集中できます。 買い切り購入者限定特典 AI Zone Radar MT5版と完全PDFマニュアルを無料プレゼント。 ご購入後にMQL5でメッセージをお送りください。買い切り購入が対象です。レンタルは対象外です。 AI Zone Radarを見る サインから、具体的なトレード計画へ SMA 13、21、75、100へのタッチを使ったセットアップを検出。各サインに売買方向と対象MAを表示するため、浅い押し目、戻りと深い調整を区別して確認できます。 チャートとパネルには、次の情報を表示し
Price & Time Market Structure Indicator A professional market structure tool that analyzes waves through both price and time — not price alone. Main Description NeoWave PRO is a professional market structure indicator for MetaTrader 4 designed for traders who want to move beyond traditional one-dimensional wave tools such as ZigZag, swing indicators, and basic high/low systems. Most wave indicators analyze only one thing: Price. But a real market wave is not only a price movement. A true wave de
Super Signal – Skyblade Edition プロ仕様のノンリペイント / ノーラグ・トレンドシグナルシステム。卓越した勝率を実現 | MT4 / MT5 対応 1分足、5分足、15分足などの低い時間足で最も効果を発揮します。 主な特徴: Super Signal – Skyblade Edition は、トレンド取引に特化したスマートなシグナルシステムです。マルチレイヤーのフィルターロジックを用いて、明確な方向性と実際のモメンタムに支えられた強力なトレンドのみを検出します。 このシステムは 天井や底を予測するものではありません 。次の3つの条件がすべて満たされた場合にのみシグナルを発生させます: 明確なトレンド方向 モメンタムの増加 健全なボラティリティ構造 市場セッションに基づく流動性分析と組み合わせることで、シグナルの精度とタイミングがさらに向上します。 シグナルの特性: すべての矢印シグナルは 100% 非リペイント / 遅延なし 一度出現したシグナルは固定され、点滅・消失しません チャート上の矢印、情報パネル、ポップアップ通知、音声アラート、プッシュ通知
I have been trading for some time now and always find it a difficulty remembering the timing of the various market opening hours at the other part of the world (especially, when it comes to daylight saving), but could not find any decent indicator online that could help. And it is for this reason that gives birth to this indicator, which I have spent much time, effort and thinking. As many already know that opening of a certain marketplace, depending on which currency pair, has an impact on the
BTMM State Engine Pro by G-Labs — Beat The Market Maker indicator for MetaTrader 4. Asian session range, London and New York kill zones, level progression (L1/L2/L3), peak formation detection (PFH/PFL), entry signals, and a multi-pair scanner from one chart. Stop scanning charts one pair at a time. The State Engine tracks the BTMM daily cycle automatically — Asian box, room boundaries, level blocks, peak formations, and filtered entries — while the scanner dashboard shows level, peak status,
This indicator is SO SIMPLE… when the green Rise Coming arrow appears, a price drop may be on the way! Plain and easy profits! As you receive more than one 'Rise Coming' text signal in a downtrend, it means momentum is building larger for a bull run. HOW TO USE 1. When the green "Rise Coming" text appears, a price jump may be on the way! This indicator Never Repaints! To get the best setting it's a matter of tweaking the indicator until it gives you the best results. Our recommendation, and what
Presenting one-of-a-kind Gann Indicator for XAUUSD IQ Gold Gann Levels is a non-repainting, precision tool designed exclusively for XAUUSD intraday trading. It uses W.D. Gann’s square root method to plot real-time support and resistance levels, helping traders spot high-probability entries with confidence and clarity. William Delbert Gann (W.D. Gann) was an exceptional market analyst whose trading technique was based on a complex blend of mathematics, geometry, astrology, and ancient calculation
The elite (V3) multi-indicator suite from JoaquinTrading specifically geared towards Forex & binary options, including regulated exchanges such Nadex, Cantor Exchange, and other binary option brokers. The Probability Tool Suite Elite will provide the given win/loss outcome probabilities of up to 10 strike levels, a specific expiration duration, based on a combination of up to 16 indicators, rules, or conditions and derivative behavior (i.e. expiry, touch, touch & retrace).  Using this indicato
Elliott Wave Trend was designed for the scientific wave counting. This tool focuses to get rid of the vagueness of the classic Elliott Wave Counting using the guideline from the template and pattern approach. In doing so, firstly Elliott Wave Trend offers the template for your wave counting. Secondly, it offers Wave Structural Score to assist to identify accurate wave formation. It offers both impulse wave Structural Score and corrective wave Structure Score. Structural Score is the rating to sh
Miraculous Indicator – ガン・スクエア・オブ・ナインに基づく100%非リペイントのFXおよびバイナリーツール この動画では、FXおよびバイナリーオプションのトレーダー向けに特別に開発された、非常に正確で強力な取引ツールである Miraculous Indicator を紹介しています。このインジケーターがユニークなのは、伝説的な ガン・スクエア・オブ・ナイン と ガンの振動の法則 に基づいている点で、現代の取引で利用できる最も正確な予測ツールの一つとなっています。 Miraculous Indicatorは 完全に非リペイント であり、ローソク足が確定した後にシグナルが変化したり消えたりすることはありません。つまり、見たものがそのまま利用できます。これにより、トレーダーは自信を持ってエントリーおよびエグジットを行うための信頼性と一貫性のある根拠を得ることができます。 主な特徴: ガン・スクエア・オブ・ナインとガン理論に基づいて構築 100%非リペイントのシグナルシステム すべての時間枠(M1、M5、H1、H4、日足、週足)で機能 FXおよびバイナリーオプション取引
Introduction to EFW Analytics EFW Analytics was designed to accomplish the statement "We trade because there are regularities in the financial market". EFW Analytics is a set of tools designed to maximize your trading performance by capturing the repeating fractal geometry, known as the fifth regularity in the financial market. The functionality of EFW Analytics consists of three parts. Firstly, Equilibrium Fractal Wave Index is an exploratory tool to support your trading logic to choose which r
ORB Seeker
Marcela Goncalves De Oliveira
4 (1)
期間限定の割引価格! たったの 149 ドル! ご購入後、ボーナスとしてORB Seeker EAと個人最適化セットファイルをお受け取りいただくため、私にご連絡ください。 クリーンなセッションブレイクアウトを自信を持ってキャッチしましょう! ORB Seekerは、正確性、シンプルさ、柔軟性、そして明確なチャート構造を求めるトレーダー向けに開発された、プロ仕様のオープニングレンジブレイクアウト(ORB)インジケーターです。 このシステムは、あらゆる銘柄のプレマーケットまたはカスタムセッションのレンジを自動的にプロットし、エントリー、ストップロス、テイクプロフィット、およびオプションの50%部分TPレベルを含む明確なブレイクアウトシグナルを提供します。すべての計算結果はリアルタイムでチャート上に表示されます。 ロンドン市場オープン、ニューヨーク市場セッション、アジア市場セッション、または独自のカスタム市場時間帯で取引できます。ORB Seekerは選択したセッション時間帯に合わせて調整されるため、市場レンジ、ブレイクアウトレベル、トレードレベルの位置を正確に把握できます。 ご購入いた
Cycle Sniper
Elmira Memish
4.39 (36)
Please contact us after your purchase and we will send you the complimentary indicators to complete the system Cycle Sniper is not a holy grail but when you use it in a system which is explained in the videos, you will feel the difference. If you are not willing to focus on the charts designed with Cycle Sniper and other free tools we provide, we recommend not buying this indicator. We recommend watching the videos about the indiactor and system before purchasing. Videos, settings  and descri
Gold Channel is a volatility-based indicator, developed with a specific timing algorithm for the XAUUSD pair, which consists of finding possible corrections in the market. This indicator shows two outer lines, an inner line (retracement line) and an arrow sign, where the theory of the channel is to help identify overbought and oversold conditions in the market. The market price will generally fall between the boundaries of the channel. If prices touch or move outside the channel it is a tradi
Binary Booster
Yaroslav Varankin
5 (1)
Binary Options Trading Indicator: A Reliable Tool for Your Trades This indicator is specifically designed for binary options trading and has proven its high quality, reliability, and adequate accuracy, depending on the dynamics of the chart. Key Points: Signal Interpretation: When a blue cross signal appears, it indicates a potential entry into a trade, though it is considered a weak signal on its own. However, if the blue cross is accompanied by an arrow, it is considered a more reliable buy s
Binary Options Support Resistance Indicator This indicator is designed for binary options trading and effectively shows retracements from support and resistance levels. Signals appear on the current candle. A red arrow pointing downwards indicates a potential selling opportunity, while a blue arrow pointing upwards suggests buying opportunities. All that needs adjustment is the color of the signal arrows. It is recommended to use it on the M1-M5 timeframes as signals are frequent on these timef
The Notorious OB — 流動性スイープ、オーダーブロック、そしてチャート上の確認。 オーダーブロックとFVGの中間線を通過する流動性スイープを、チャート上で確認。リアル口座パネル。 The Notorious OBは、オーダーブロック(OB)またはフェアバリューギャップを通過する流動性スイープを待ち、さらに自分のチャートでの確認を待ってから矢印を表示する。 当社のインジケーターは、真剣で規律あるプロップファームのトレーダー向けに作られています。プロップファームのコピートレードに関する規則のため、購入数に応じて価格を引き上げ、利用者数を制限します。 構造を判定する時間足は自由に選べ、たとえばM1やM5チャートの背後でM15を使える。インジケーターはその時間足のオーダーブロックとフェアバリューギャップを中間線とともに描画し、流動性を刈り取りながらいずれかのゾーンの中間線を通過するローソク足を監視する。そのローソク足が確定するとセットアップが待機状態になる。買いまたは売りの色の点線に Buy armed または Sell armed のラベルが付き、この時点では矢印はまだ表示
IQ FX Gann Levels a precision trading indicator based on W.D. Gann’s square root methods . It plots real-time, non-repainting support and resistance levels to help traders confidently spot intraday and scalping opportunities with high accuracy. William Delbert Gann (W.D. Gann) was an exceptional market analyst, whose trading technique was based on a complex blend of mathematics, geometry, astrology, and ancient mathematics which proved to be extremely accurate. We don't offer free or bonus indic
Owl smart levels
Sergey Ermolov
4.26 (38)
トレンドに沿ってトレードする際の主な難しさは、レベルを見つけることではなく、どこが実際に有効なエントリーポイントなのかを理解することにあります。 価格はしばしばレベルに反応しますが、動きが継続しないことが多く、その結果、誤ったエントリーや機会損失につながります。 Owl Smart Levels は単にレベルを表示するだけではなく 、市場構造とプルバックに基づいてゾーンを形成します。これにより、エントリーポイントを異なる視点で評価でき、一部の誤シグナルを回避できます。 Owl Smart Levels システムに含まれるもの Owl Smart Levels は単なるレベルの表示ではなく、各要素が連携する 完全なトレードモデル です。 内容は以下の通りです: Owl Smart Levels(インジケーター) トレンド方向、プルバックゾーン、事前定義されたエントリー・StopLoss・TakeProfitレベルを表示 システムガイド 実際のトレードでのシグナルの扱い方を解説:どの状況を考慮し、どれを回避し、どのようにトレードを管理するか トレード判断チェックリスト シグナルを迅
OrderFlow Absorption – MT4用プロフェッショナル・デルタ&アブソープションシグナルインジケーター OrderFlow Absorptionで本物のオーダーフロー分析の力を解き放ちましょう。MetaTrader 4向けの究極のデルタヒストグラム&アブソープションシグナルインジケーターです。あらゆる価格変動の裏側で何が起きているのかを知りたいトレーダーのために設計されており、市場を動かす隠れた買い/売り圧力や吸収イベントを明らかにします。 特徴 デルタヒストグラムの可視化:   買い圧力・売り圧力を色分けされたヒストグラムで即座に表示。 アブソープションシグナル検出:   高度なロジックで強気・弱気の吸収イベントを特定し、反転の兆しを早期に通知。 チャートマーカー:   吸収シグナルをチャート上に直接マークし、視覚的に分かりやすく表示。 ポップアップアラート:   新しい吸収シグナルが出現した際にリアルタイムで通知。 カスタマイズ可能な閾値:   弱いシグナルを除外し、高確率のセットアップに集中。 リソース管理:   大きなチャートでも高速に動作する効率的な計算。
A. A2SR とは何ですか ?   * 先行テクニカル指標です (塗り直しなし、ラグなし)。 -- ガイダンス : -- https://www.mql5.com/en/blogs/post/734748/page4#comment_16532516 -- そして https://www.mql5.com/en/users/yohana/blog .. MT5 version:  https://www.mql5.com/en/market/product/140111 A2SR には、サポート (需要) とレジスタンス (供給) のレベルを決定する特別な手法があります。 ネットで見かける通常の方法とは異なり、A2SR は実際の SR レベルを決定する独自のコンセプトを持っています。 元の手法はインターネットから取得されたものではなく、インターネット上で公開されたこともありません。 A2SR は、取引スタイルに応じて SR レベルを自動選択します。 時間枠を変更しても、SR レベルはその位置にとどまります。 実際のSRは、使用する時間枠から取得されるわけではないため. A2SR
作者のその他のプロダクト
Entry Point M5 — 完全なトレーディングシステム Entry Point M5 は、あらゆる通貨ペアに対応する 高性能なトレーディングシステム型インジケーター です。価格構造を分析し、市場の反転ポイントや新しいトレンドの発生を正確に特定します。強いトレンド相場からレンジ相場まで、さまざまな市場局面に自動適応し、追加のフィルターや補助ツールを使わずに明確で視覚的なシグナルを提供します。 このシステムでの取引は非常にシンプルです。 緑の矢印 が表示されたら**買いポジション(Buy)**を開きます。 赤い矢印 が表示されたら、すべての買いポジションをクローズし、 売りポジション(Sell) を開きます。次に再び緑の矢印が表示されたら、すべての売りをクローズし、新たに買いを開きます。こうしてインジケーターは、主観的な判断を必要とせず、シグナルに従うだけで機能する 完全なトレーディングシステム を構築します。 Entry Point M5 は、M1、M5、M15、H1 などの多くのタイムフレームや、すべての通貨ペアで使用できます。内部の適応アルゴリズムにより、各銘柄のボラティリテ
Aggressive intraday scalper is a mechanical system for intraday scalping, which displays trade opening and closing signals as arrows on the chart. When a signal emerges, the indicator sends email and push notifications. So, you don't have to stay by the monitor analyzing the market and waiting for a signal. Aggressive intraday scalper will do it for you. The system has been developed for those traders who do not have their own trading system and who would love to quickly start trading using the
XL Arrow is a signal indicator that displays market entry points. The red arrow and the DOWN signal at the right corner indicate it is time to sell, while the blue arrow and the UP signal indicate it is time to buy. Settings PeriodSlower - indicator slowing period. PeriodFaster - indicator acceleration period. Recommendations trading pairs: EURUSD, GBPUSD and USDJPY timeframes: M5 - H4
Market Scanner Elite is a new generation of indicators of the Market Scanner series. The Elite version features an improved market analysis algorithm, with a better identification of the entry points and filtering of the false signals. The logic of market analysis and calculation of effective entry points applied in this product are significantly different from those applied in Market Scanner . This indicator cannot be called a big brother, as it is a completely new product with innovative analy
Forex Gump
Andrey Kozak
2.4 (5)
Forex Gump is a fully finished semi-automatic trading system. In the form of arrows, signals are displayed on the screen for opening and closing deals. All you need is to follow the instructions of the indicator. When the indicator shows a blue arrow, you need to open a buy order. When the indicator shows a red arrow, you need to open a sell order. Close orders when the indicator draws a yellow cross. In order to get the most effective result, we recommend using the timeframes H1, H4, D1. There
The Quantum Expert Advisor is designed for trading EURUSD H1 . The trading algorithm lies in placing pending orders at the peaks of currency fluctuations, after a preliminary analysis of the market conditions. Trading is fully automated. Lot size is calculated automatically based on the lot percentage. Parameters MaxRisk - percentage of the deposit, used for the automatic calculation of the lot. LongWave - long wave of price fluctuation. ShortWave - short wave of price fluctuation. Level contro
The BoxetFx Expert Advisor analyzes the market using multiple trading strategies. Once the optimal signals for opening trades are obtained, the EA automatically determines the order volume as a percentage pf the deposit. Next, a pending order is placed in the direction of the expected price movement. When the deal reaches an optimal profit or loss level, it is automatically closed. Multiple analytical centers of information processing allow the EA to diversify the possible risks of the trader by
The Medok indicator shows the market entry and exit points on the chart using arrows and resistance lines. The indicator is very easy to use. Buy when a blue arrow appears and sell when a red arrow appears. After an order is opened, it is recommended to close a buy position when the price reaches the lower resistance level or to close a sell position when the price reaches the upper resistance level. Recommended values for EURUSD H1 Periods - 2; Acceleration - 0.02. Recommended values for EURU
TOP Xios is a ready-made trading system, which provides the trader with signals for opening and closing deals. The information panel in the right corner of the screen shows the total number of signals, the number of points in profit or loss and the percentage of valid and false signals. Working with this indicator is very simple. As soon as a blue arrow appears, open a buy deal and wait for a red cross to appear, which indicates the necessity to close the deal. When a red arrow appears, open a s
Buy Market Scanner is a ready-made trading system, which shows the moments when it is necessary to open or close deals. Buy arrows appear on the zero bar without delay and redrawing. The same applies to signals for closing orders. They appear on the zero bar and are not redrawn. The number of profit or loss in points for a certain time period is displayed in the top right corner of the indicator. The indicator works best on the EURUSD currency pair with the H1 timeframe. Operation Principles In
The DayWay indicator shows the current trend direction on the chart as a colored line. The best timeframes for operation are M5 and higher. Works on all currency pairs. Suitable for any scalping strategies. Quite easy to use. Recommendations on usage When a blue line appears, wait for a candle to close and open a buy order. When a red line appears, wait for the current candle to close and open a sell order. Parameters Periods - period of the indicator.
Leo Trend is a signal indicator that shows the market entry points, as well as the trend direction and flat on the chart in the form of arrows and lines. Leo Trend will be useful both for beginners creating a trading strategy, and for professionals to integrate into ready-made trading systems. Leo Trend works without redrawing and without significant delays. The operation of the indicator is demonstrated in the video. In addition, you can test this indicator in the strategy tester free of charge
NIZMA is a ready-made trading system, that is the most efficient on the EURUSD, AUDUSD and GBPUSD currency pairs. The best timeframes are M5 and higher. The system shows the market entry points in the form of arrows, and also displays the information on the strength and direction of the trend. The signals are easy to interpret. It is suitable for both novice and professional traders. With the properly selected settings, it gives the minimum number of false signals. In tests, this number did not
XPointer is a completely ready trading system. It shows the trader when to open and close a trade. It works on all currency pairs and all time frames. Very easy to use and does not require additional indicators for its operation. Even a beginner trader can start working with XPointer. But it will also be useful for professional traders to confirm the opening of orders. Features of the XPointer indicator It does not redraw its values. It works on all currency pairs and all time frames. It has al
Lobster is a ready-made trading system with a flexible market analysis algorithm. It performs most of the work for a trader. All you have to do is open and close orders following the indicator signals. The indicator will be very useful for both beginners and professionals. It is able to work with other indicators and independently. Features No signal repainting; Any pair; Any timeframe; Flexible market analysis system. How to trade When the blue arrow appears, open a buy order; When the blue c
Gets is a smart trading system with complex market analysis mechanism. The operation principle of Gets is based on neural networks and diversified collection of information from various market analyzers. Then the system analyzes the statistical databases to create a general idea of the current market situation and the further price movement. The information is displayed on the screen in a simple and intuitive way - in the form of buy and sell arrows. Also, the information on the current trend st
Scalper Zoom is a new trading system designed to facilitate the process of Forex trading both for beginners and professionals. The Scalper Zoom indicator uses an adaptive method of operation and analyzes the market using multiple trading algorithms, while selecting the most efficient one for the given currency pair and timeframe. Working with this indicator is very simple. When a red vertical line appears, open a sell order. Close it when a blue vertical line appears. Follow the opposite steps f
Brabux is a ready-made mechanical trading system. It works on all currency pairs and timeframes automatically adjusting to them. It also selects the most efficient trading parameters for receiving a necessary profit. In the indicator parameters, specify the trading period used for calculations and the least acceptable profit in points. Next, the system automatically selects the necessary trading parameters. Trading data is displayed on the info panel. After setting the indicator on the chart and
CoolLine is a signal indicator displaying on a chart points for opening and closing trade positions. The indicator signals are not redrawn. It draws arrows on the zero bar Open[0]. It works on all currency pairs and all time frames. Indicator Advantages Precisely shows the opening and closing points on the chart Does not redraw signals Works on all currency pairs and timeframes Very easy to use; suitable even for beginners Has a very flexible system of settings Can send push and email notificat
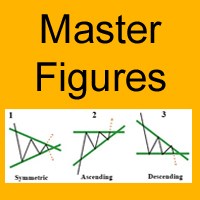
The Master Figures indicator analyzed the market for the most common chart patterns. The first pattern is called Pin bar . This pattern can rightly be considered one of the most widespread. This pattern looks like a candle with a small body and large tail (wick). Once you see it on the chart, open a position against the wick. It is better to use the resistance lines for closing. Master Figures shows this pattern in the form of circles. A position should be opened when a new candle appears after
Attention! Friends, since there have been many scammers on the Internet recently selling indicators called ForexGump, we decided to warn you that only on our page is the LICENSE AUTHOR'S VERSION of the INDICATOR sold! We do not sell this indicator on other sites at a price lower than this! All indicators are sold cheaper - fakes! And even more often sold demo versions that stop working in a week! Therefore, in order not to risk your money, buy this indicator only on this site! Forex Gump Pro is
Market Trend - a comprehensive system for determining the trend direction. Analyzes the market using a formula which considers the values of multiple technical indicators and other trading strategies. IT determines not only the current trend direction, but also its movement strength. The indicator is intuitive and very easy to use. The information on the current trend direction and its movement strength are displayed on the chart. If the indicator shows "UP!" then an uptrend is currently present
Jerus Line Scalper is an indicator for scalping on EURUSD, GBPUSD, AUDUSD, USDJPY and USDCAD pairs. Recommended pairs: M5, M15, M30 and H1. The trading strategy is as follows: as soon as the arrow appears, open an order in the direction of the arrow and set take profit to +10 points. Set stop loss at the indicator's stop line. Stop line is displayed in red or blue depending on the indicator signal. Also, the Martingale system can be applied in the system. If a trade is closed at a loss, the next
DotaScalping is a semi-automated trading system for scalping. The indicator shows recommended moments for opening Buy/Sell trades as dots on the chart. Signals are generated based on the algorithm for price amplitude smoothing. The indicator tries to accurately calculate the moments of the maximum peak price values ​​and produces signals based on the smoothed correlation. The indicator determines the High and Low price values and generates signals based on the trend direction. The indicator is v
ForexGumpUltra is a new and more advanced indicator of the ForexGump series. This indicator easily determines the price direction on any currency pair and any timeframe. The indicator draws its signals on the zero bar and does not redraw them (see the video). In the 34th second of the video it can be seen that this indicator uses new filters to determine the changes in price movement direction without delay, despite the market noise present at the moment (see the video on the 34th second). Once
Attention! Friends, since there have been many scammers on the Internet recently selling indicators called ForexGump, we decided to warn you that only on our page is the LICENSE AUTHOR'S VERSION of the INDICATOR sold! We do not sell this indicator on other sites at a price lower than this! All indicators are sold cheaper - fakes! And even more often sold demo versions that stop working in a week! Therefore, in order not to risk your money, buy this indicator only on this site! Forex Gump Scalpin
Bomb Scalper is a ready-made mechanical trading system that analyzes the market using 12 market signals, as well as candle patterns, providing signals for opening and closing trades. On the screenshot below, you can see how the system draws the blue arrow for buying and the red one for selling. Order close signal is shown as the yellow arrow. Besides, during a closing signal, the indicator calculates potential profit/loss. How the indicator works After launching, Bomb Scalper navigates through
Stiker is a robot capable of trading in automatic or semi-automatic mode . If auto=true in the robot settings, the robot automatically opens and closes orders on its own when a signal appears. If auto=false, the robot analyzes the market and shows signals on the screen, while a trader manually confirms opening or closing orders by clicking the Open Buy and Close Order buttons. This is done to enable traders make trading decisions themselves. This reduces the trading risk. Striker is a smart syst
If you do not yet have your trading strategy, you can take advantage of our ready-made trading strategy, which is most effective for EURUSD H1 currency pair. The indicator "Ready Made Scalping System" automatically analyzes the market and shows the trader when to open and close orders. You just need to follow his instructions. When the arrow appears - open the order, when a square appears with a tick - close the warrant. For convenience of the trader, the indicator when signals appear sends a m
Amok is a fully automatic trading system that was developed for trading on the EURUSD currency pair, H1 timeframe on micro accounts. Nevertheless, as practice shows, this trading system works well in other currency pairs. Principle of work of the trading robot Amok In the algorithm of the robot, there are more than 7 different trading strategies. This was done to ensure that the robot could work more stably in different market conditions. The program part of the robot uses 12 different indicato
フィルタ:
Sirevelu Sasi Kumar
182
Sirevelu Sasi Kumar 2026.09.23 17:57 
 

ユーザーは評価に対して何もコメントを残しませんでした

Andrey Kozak
47460
開発者からの返信 Andrey Kozak 2026.09.23 17:59
Hi! Thanks for your feedback!
aborisov
128
aborisov 2026.09.23 16:59 
 

ユーザーは評価に対して何もコメントを残しませんでした

Andrey Kozak
47460
開発者からの返信 Andrey Kozak 2026.09.23 17:09
Hi! Thanks for your feedback!
レビューに返信