Dynamic DOM
- インディケータ
- バージョン: 1.0
- アクティベーション: 10

Instructions for the Dynamic_DOM_Labels indicator
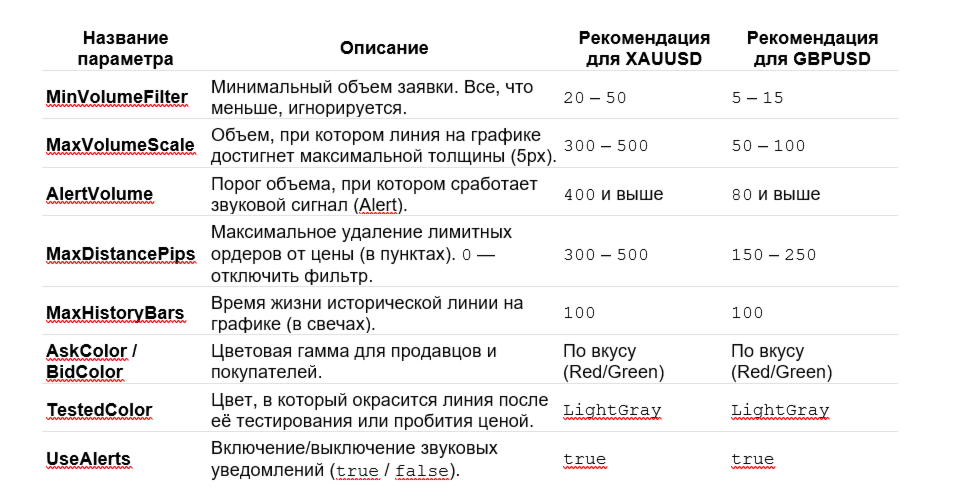
Dynamic_DOM_Labels is a professional analytical tool for the MetaTrader 5 terminal, designed to analyze the Order Flow in real time. The indicator connects directly to the broker's Depth of Market /DOM, finds large limit orders from buyers (Buy Limit) and sellers (Sell Limit) and projects them onto the work schedule.
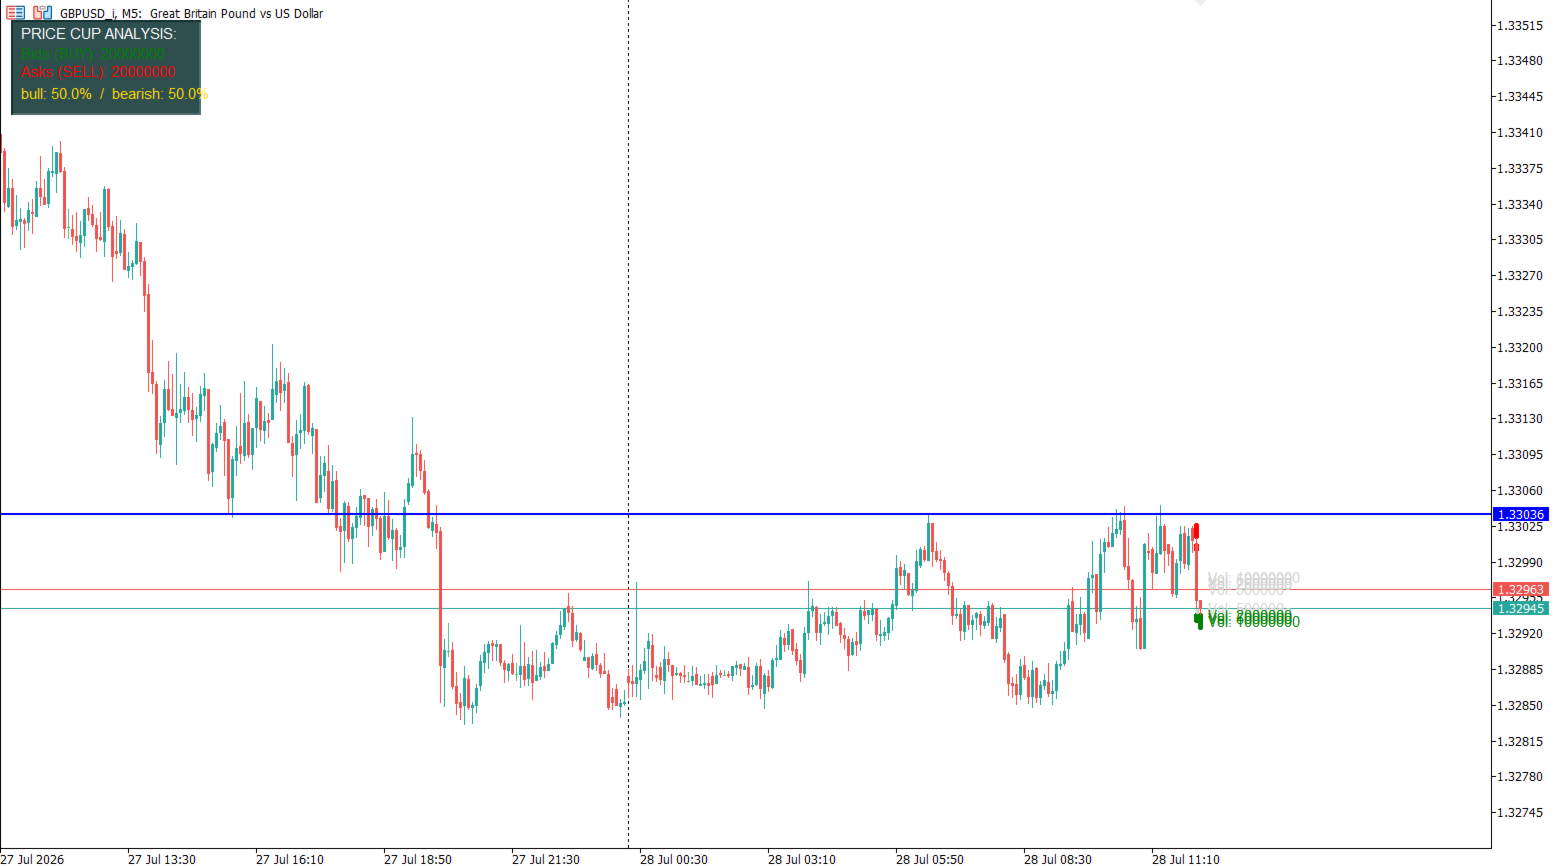
The tool is designed specifically for liquid markets such as Gold (XAUUSD) and major currency pairs (for example, GBPUSD), where large limit orders act as psychological barriers behind which stop loss pools of retail participants accumulate.
The main features and logic of the work
1. Dynamic visualization of densities (Depth of Market):
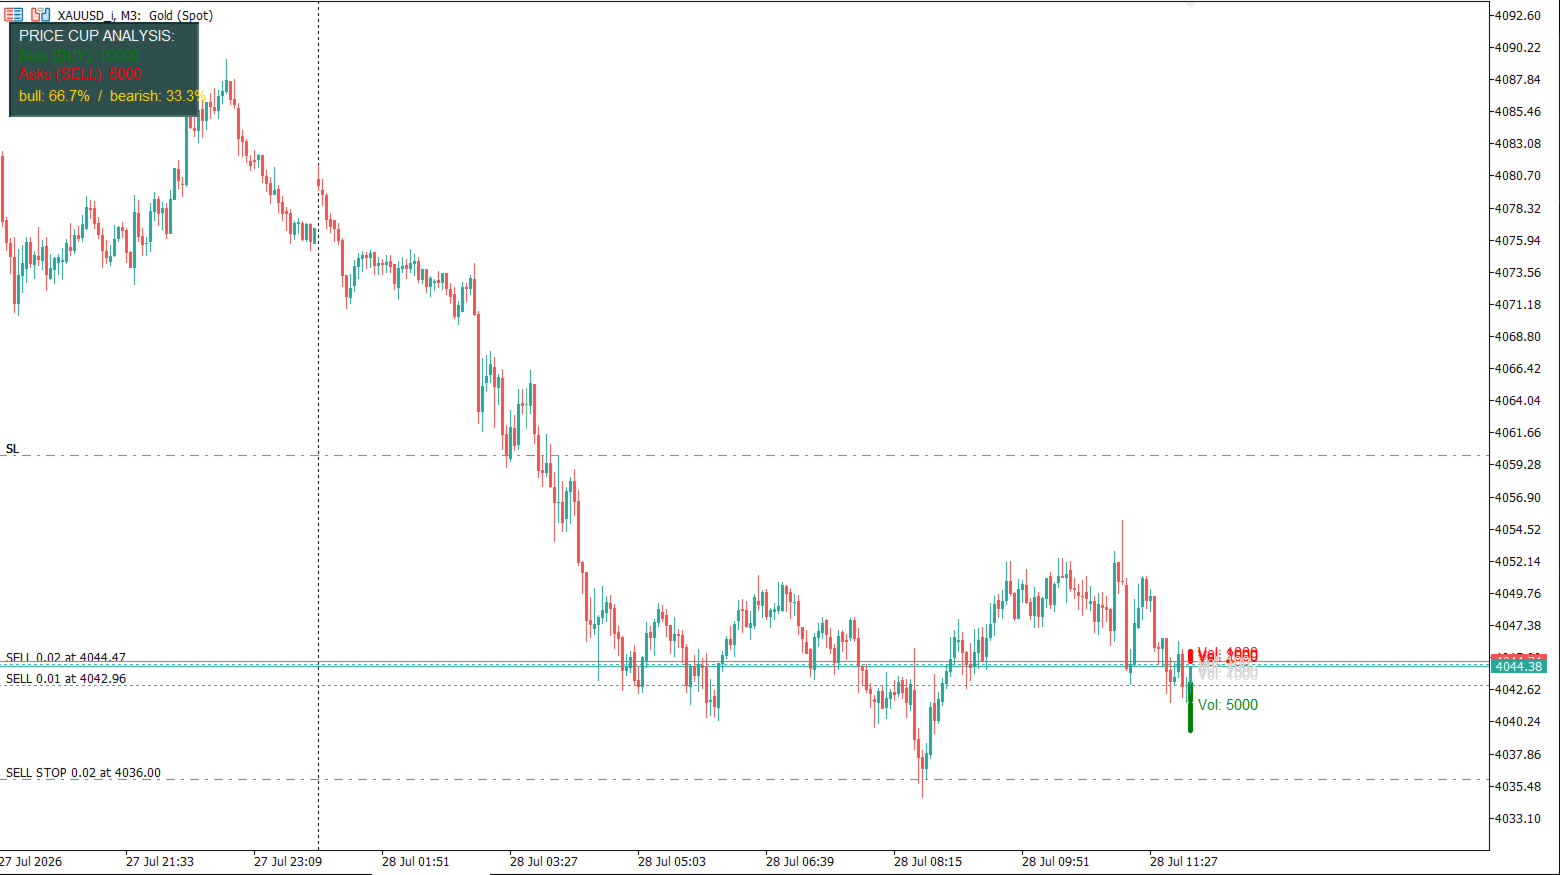
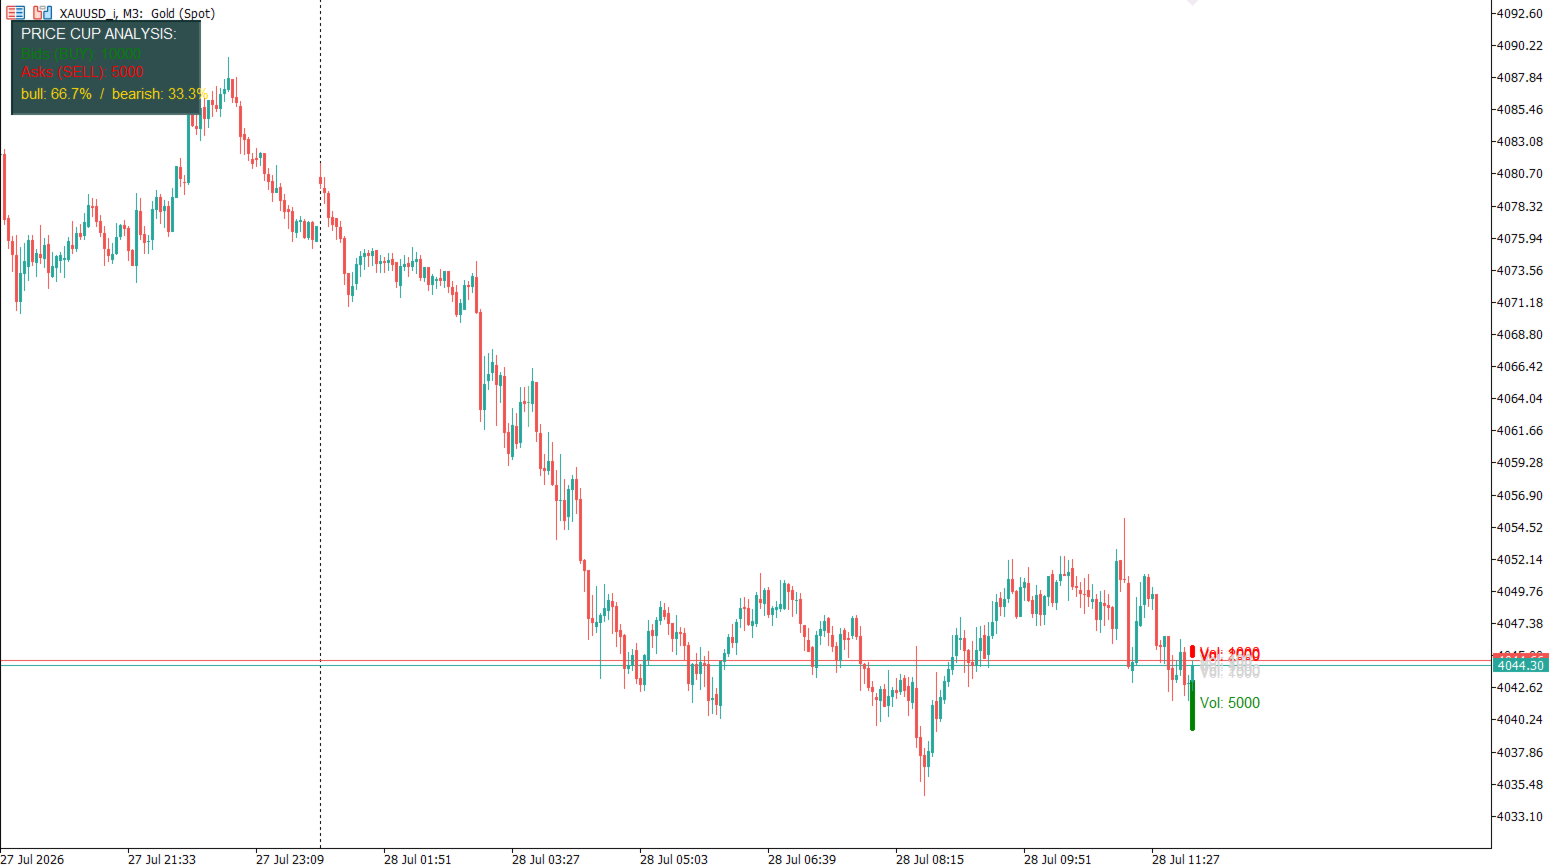
The indicator converts dry figures from the glass table into visual horizontal lines on the chart.
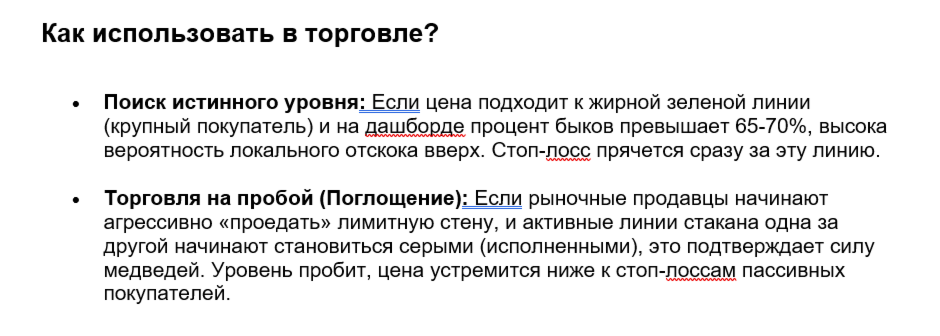
Green lines: Large Purchase Orders (Bids).
Red Lines: Large Sell Orders (Asks).
2. Proportional scaling (Line thickness):
The line thickness is calculated automatically from 1 to 5 pixels. The larger the order volume on the exchange, the bolder the line on the chart. This allows you to instantly visually distinguish "noise" orders from the positions of large players.
3. Information Dashboard (Balance of Power):
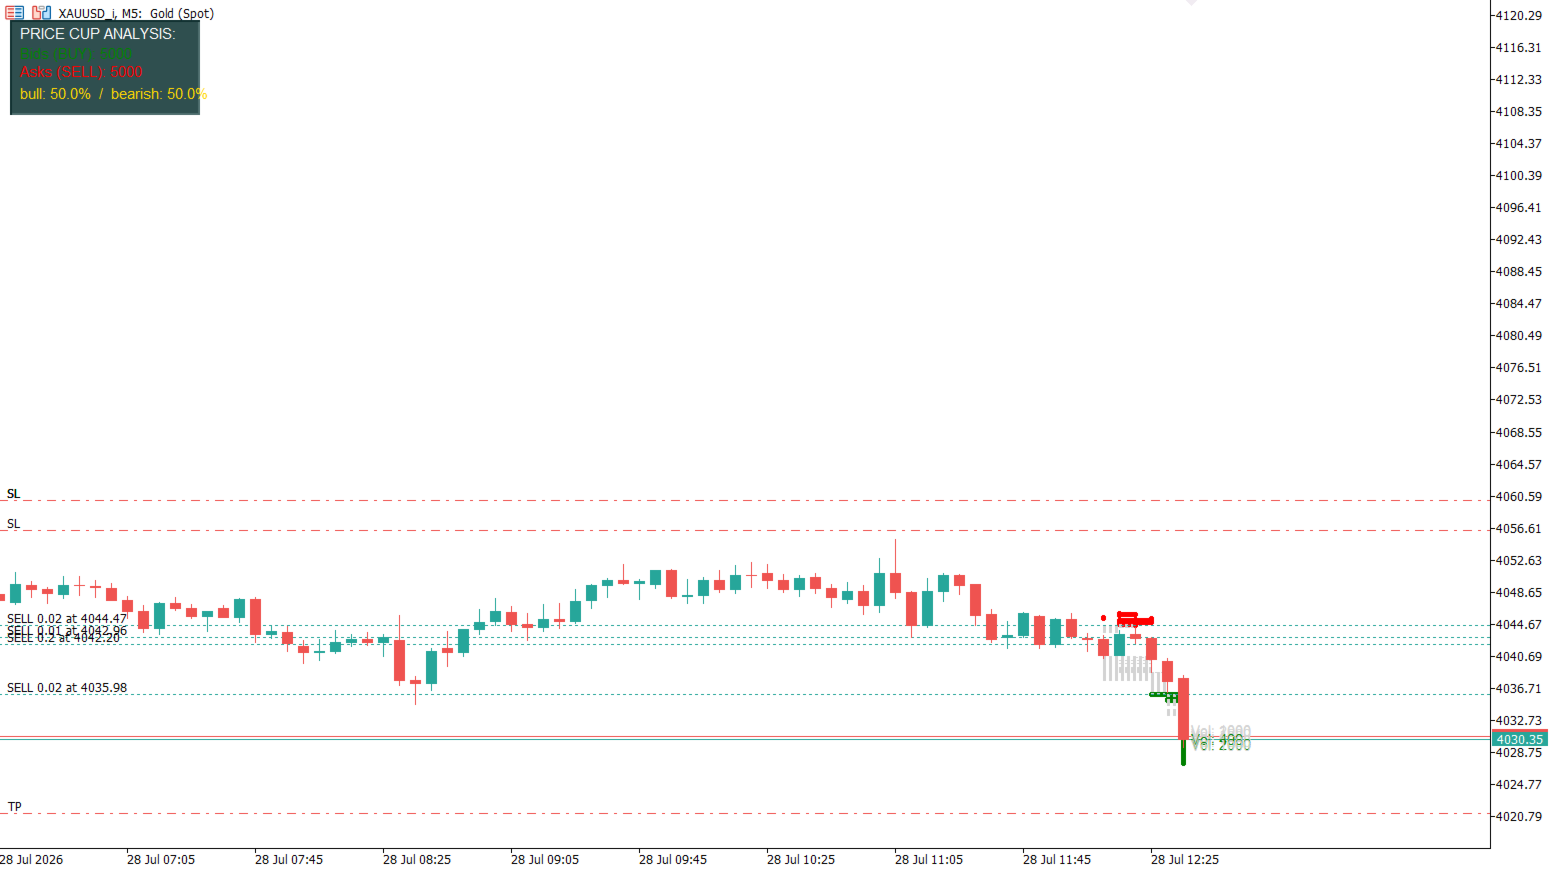
A compact panel is displayed in the upper-left corner of the screen, which calculates in real time:
The total volume of all filtered purchase orders.
The total volume of all filtered sales orders.
The percentage of forces (Bulls% / Bears%) that helps identify hidden market imbalances.
4. The function of "Historical attenuation" of orders (Order Absorption):
A unique feature for analyzing liquidity absorption. When the current price touches or "flashes" the level of the limit player, the indicator captures this event. The punched line instantly changes color to gray, becomes thin and dotted. This shows the trader that the volume at this level has been fully or partially filled (absorbed by the market).
5. Smart distance filter and auto-cleaning:
To prevent the chart from being overloaded with unnecessary information, the indicator displays orders only in a given range from the current price. Old historical lines are automatically erased after a set number of candles (for example, 100 bars), unloading the terminal's memory.
6. Full adaptability to timeframes:
The indicator automatically adjusts to any working timeframe (from M1 to D1). Text volume labels (Vol: XXXX) are always neatly attached to the right side of the screen in front of the current candle.
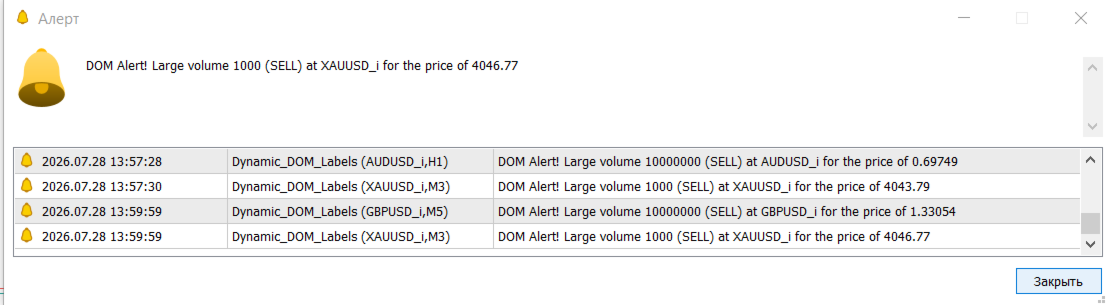
7. Sound Alerts:
When an abnormally large volume appears in the glass, exceeding the set filter, the indicator issues a system sound alert indicating the price and direction. To protect against spam, the alert is triggered strictly once per candle.