Stochastic Divergence Matrix 28
- インディケータ
- バージョン: 3.31
- アクティベーション: 10

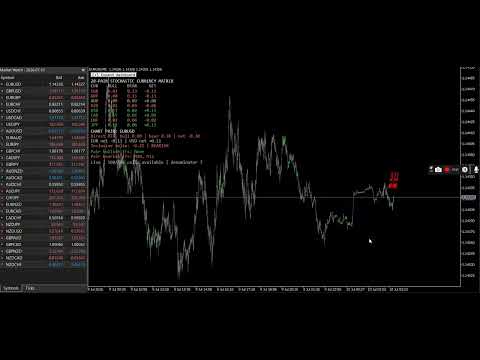
Stochastic Divergence Matrix 28 scans all 28 major Forex pairs across up to 21 MetaTrader 5 timeframes. It converts confirmed stochastic divergences into weighted pair scores, individual currency scores and an inclusive delta for every major currency pair.
Stochastic Divergence Matrix 28 is a multi-currency and multi-timeframe analytical indicator for MetaTrader 5.
The indicator scans the complete matrix of 28 Forex pairs formed by the eight major currencies:
USD, EUR, GBP, JPY, AUD, CAD, CHF and NZD.
Each pair is analyzed across up to 21 standard MetaTrader 5 timeframes, from M1 to MN1. This creates a live analytical matrix containing up to 588 pair-timeframe combinations.
The indicator detects confirmed classical stochastic divergences, applies a user-defined weight to every enabled timeframe and calculates separate bullish and bearish scores.
These pair scores are then aggregated into individual currency scores. The indicator calculates the relative delta between the base and quote currencies of every pair.
Main purpose
A divergence on one pair can be caused by strength in the base currency, weakness in the quote currency, or both.
This indicator provides a broader view by analyzing all seven relationships of every major currency rather than evaluating one chart in isolation.
For example:
AUD net score: -0.30
JPY net score: +0.60
AUDJPY inclusive delta:
-0.30 - 0.60 = -0.90
A negative AUDJPY delta represents bearish divergence pressure for AUDJPY. A positive delta represents bullish divergence pressure.
The indicator is an analytical and alerting tool. It does not execute trades.
Core features
- Scans all 28 major Forex pairs from one chart
- Supports all 21 standard MetaTrader 5 timeframes
- User-defined weight for every timeframe
- Separate bullish and bearish divergence scores
- Eight aggregated major-currency scores
- Inclusive delta for every one of the 28 pairs
- Retractable full pair and timeframe matrix
- Alerts for all pairs crossing a selected delta threshold
- Separate threshold for the current chart-pair candle labels
- Configurable label lifetime
- Separate stronger-signal arrow threshold
- Persistent arrows during the current indicator session
- Closed-bar divergence confirmation
- Configurable stochastic and pivot parameters
- Automatic broker symbol-prefix and suffix detection
- Live-state processing designed to reduce unnecessary recalculation
Supported timeframes
The following standard MetaTrader 5 timeframes can be enabled or disabled individually:
M1, M2, M3, M4, M5, M6, M10, M12, M15, M20, M30, H1, H2, H3, H4, H6, H8, H12, D1, W1 and MN1.
Every timeframe also has an independent weight input.
Pair score calculation
For each pair:
Bullish pair score =
sum of active bullish timeframe weights
divided by the number of enabled timeframes
Bearish pair score =
sum of active bearish timeframe weights
divided by the number of enabled timeframes
Pair net score =
bullish pair score - bearish pair score
A divergence remains active for the selected number of bars of its own timeframe.
For example, two active H4 bars represent two H4 candles, while two active D1 bars represent two daily candles.
Currency score calculation
Every major currency is included in seven pairs.
A pair’s net score is assigned according to its position in the symbol:
                                                    Base currency contribution  = + pair net score
Quote currency contribution = - pair net score
The seven signed contributions are averaged to calculate the final net score for that currency.
Inclusive pair delta
For every pair:
                                                    Inclusive pair delta =
base currency net score - quote currency net score
The calculation includes the chart pair itself. This produces one consistent score for each currency across the full 28-pair matrix.
Dashboard
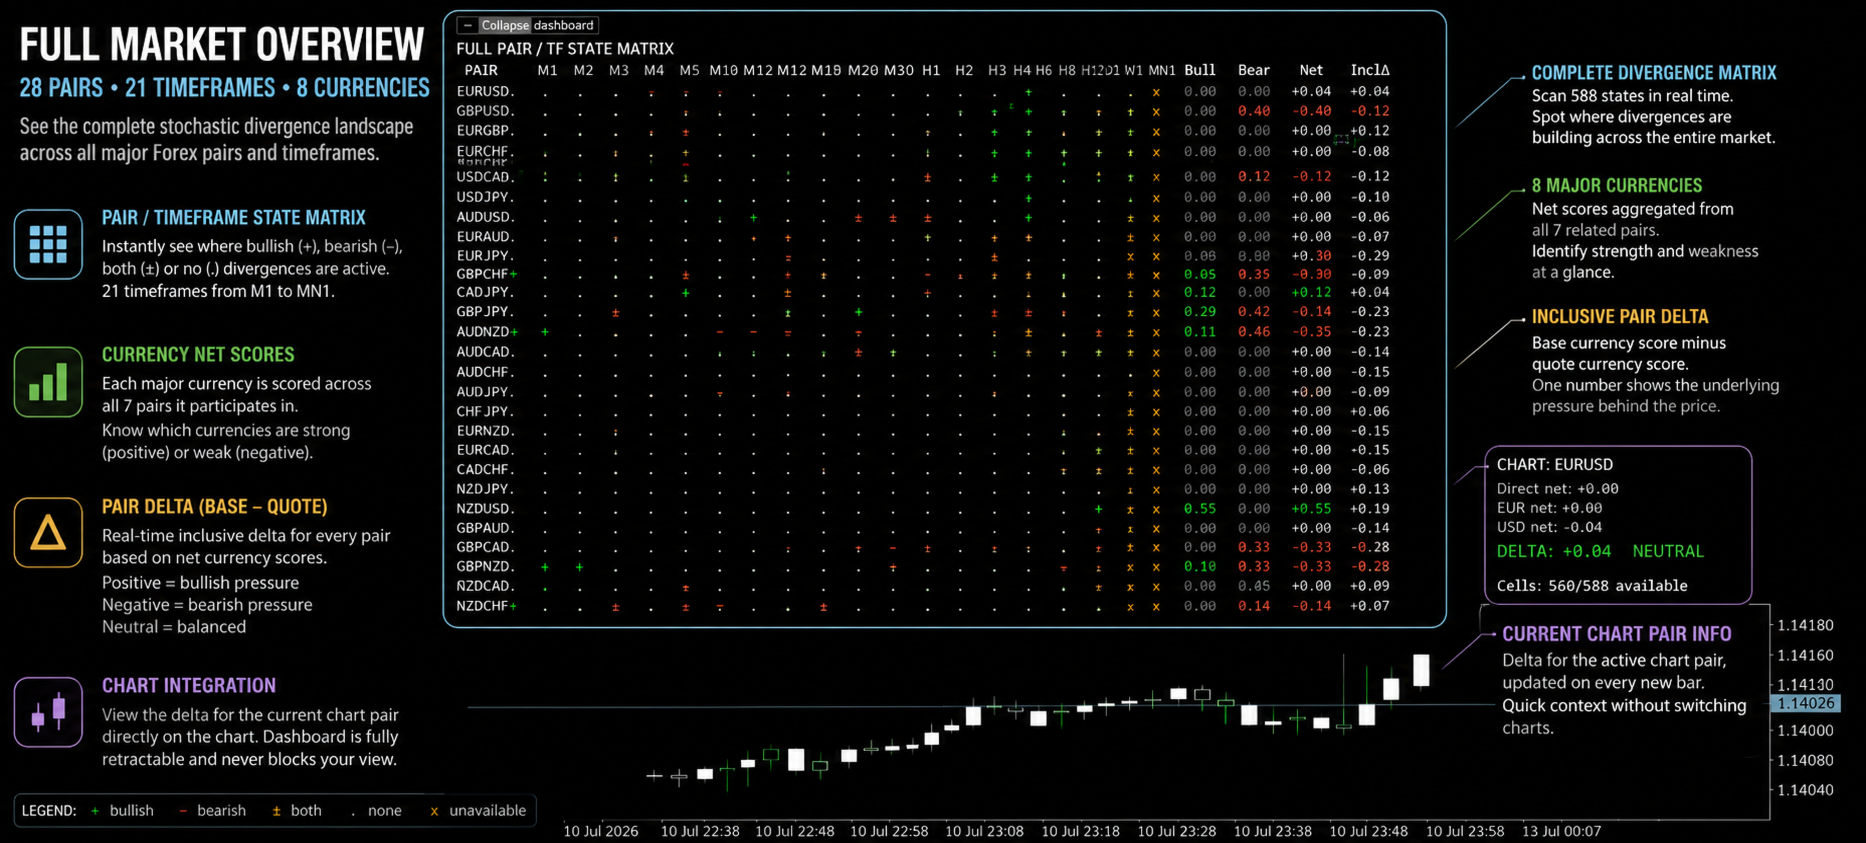
The retractable dashboard displays:
- bullish, bearish and net score for all eight currencies
- the full 28-pair and 21-timeframe divergence matrix
- bullish and bearish state for every pair-timeframe cell
- direct multi-timeframe pair score
- inclusive delta for every pair
- current chart-pair delta
- active bullish and bearish timeframes
Matrix symbols:
                                                    +  Active bullish divergence
-  Active bearish divergence
±  Bullish and bearish divergences are both active
.  No active divergence
x  Data unavailable for that cell
Alerts
The indicator can monitor all 28 pairs and issue an alert when a pair’s inclusive delta crosses the selected threshold.
Available notification methods include:
- terminal popup
- sound
- mobile push notification
Each pair is tracked independently. An alert is generated on a new threshold crossing rather than continuously repeating while the delta remains beyond the threshold.
Candle labels
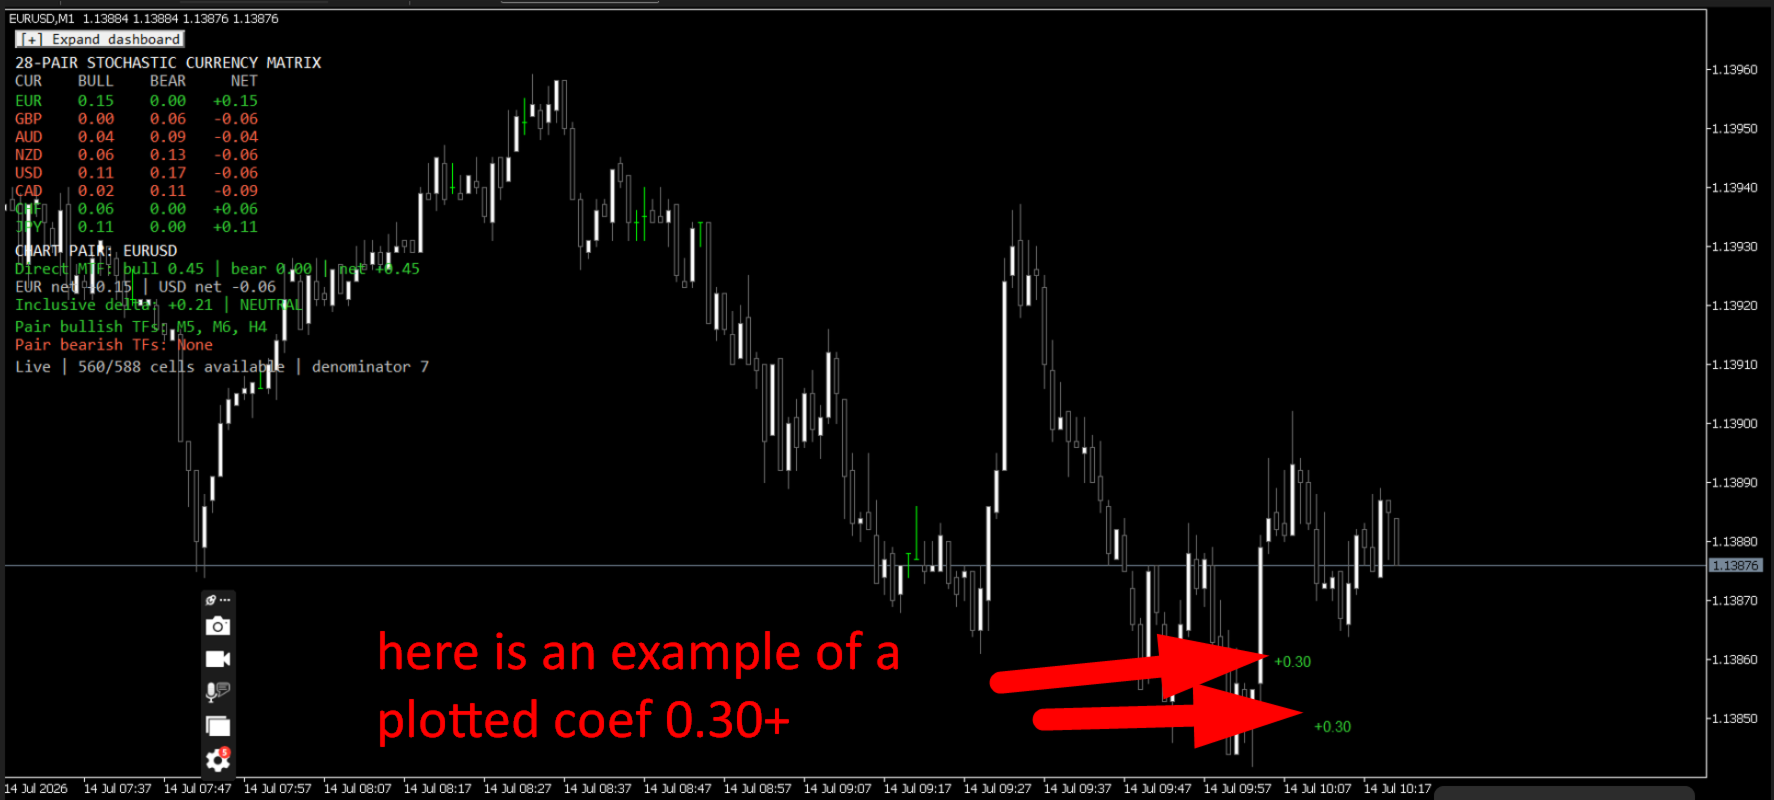
When the current chart-pair delta exceeds the selected label threshold:
- a positive value is displayed below the candle
- a negative value is displayed above the candle
The number of chart bars for which labels remain visible is configurable.
The indicator works with live matrix states. It does not reconstruct historical currency-delta calculations before the indicator was initialized.
Strong-signal arrows
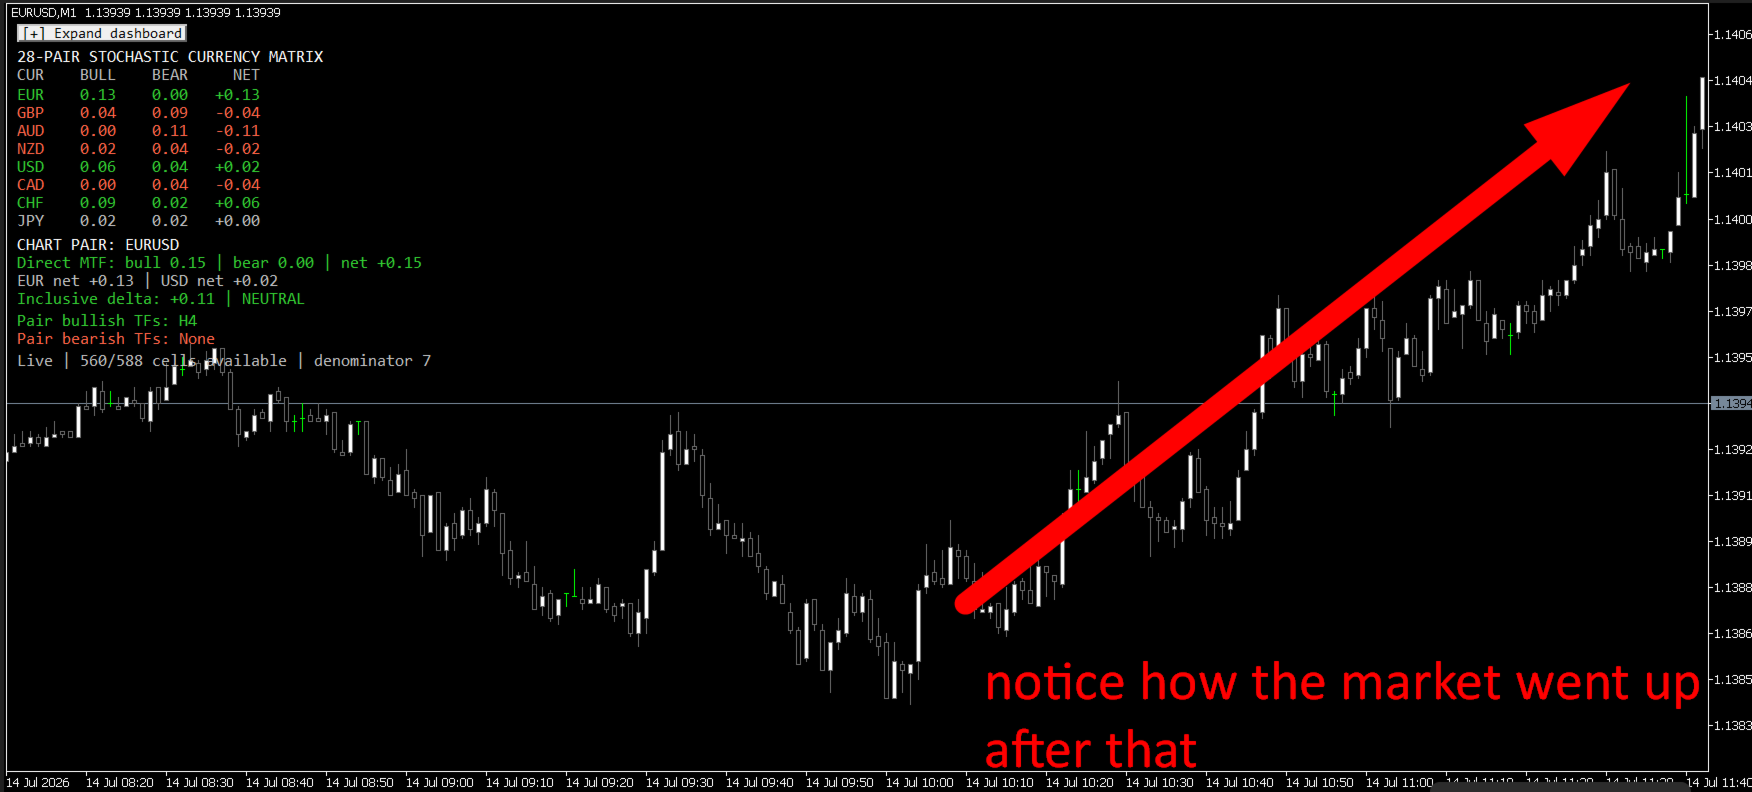
A separate higher threshold can be used for directional arrows.
- Positive strong delta: bullish arrow below the candle
- Negative strong delta: bearish arrow above the candle
Strong-signal arrows are not removed when the live delta later moves back below the threshold during the current indicator session.
Important inputs
Stochastic and divergence
- K period
- D period
- slowing
- pivot strength
- maximum divergence lookback
- oversold level
- overbought level
Signal persistence
- number of timeframe bars for which a divergence remains active
Timeframe configuration
- enable or disable each timeframe
- individual weight for each timeframe
Delta visualization
- candle-label threshold
- label lifetime
- strong-arrow threshold
- text size and offset
- arrow size
Alerts
- all-pair alert threshold
- popup
- sound
- push notification
Dashboard
- show or hide dashboard
- collapsed or expanded startup state
- dashboard position
- font and matrix-cell dimensions
Installation
- Install the indicator through MetaTrader 5.
- Open a chart of one of the 28 major Forex pairs.
- Attach Stochastic Divergence Matrix 28 to the chart.
- Allow the indicator to initialize the required pair and timeframe history.
- Open the dashboard to inspect the full matrix.
- Adjust timeframe weights, delta thresholds and alert settings when required.
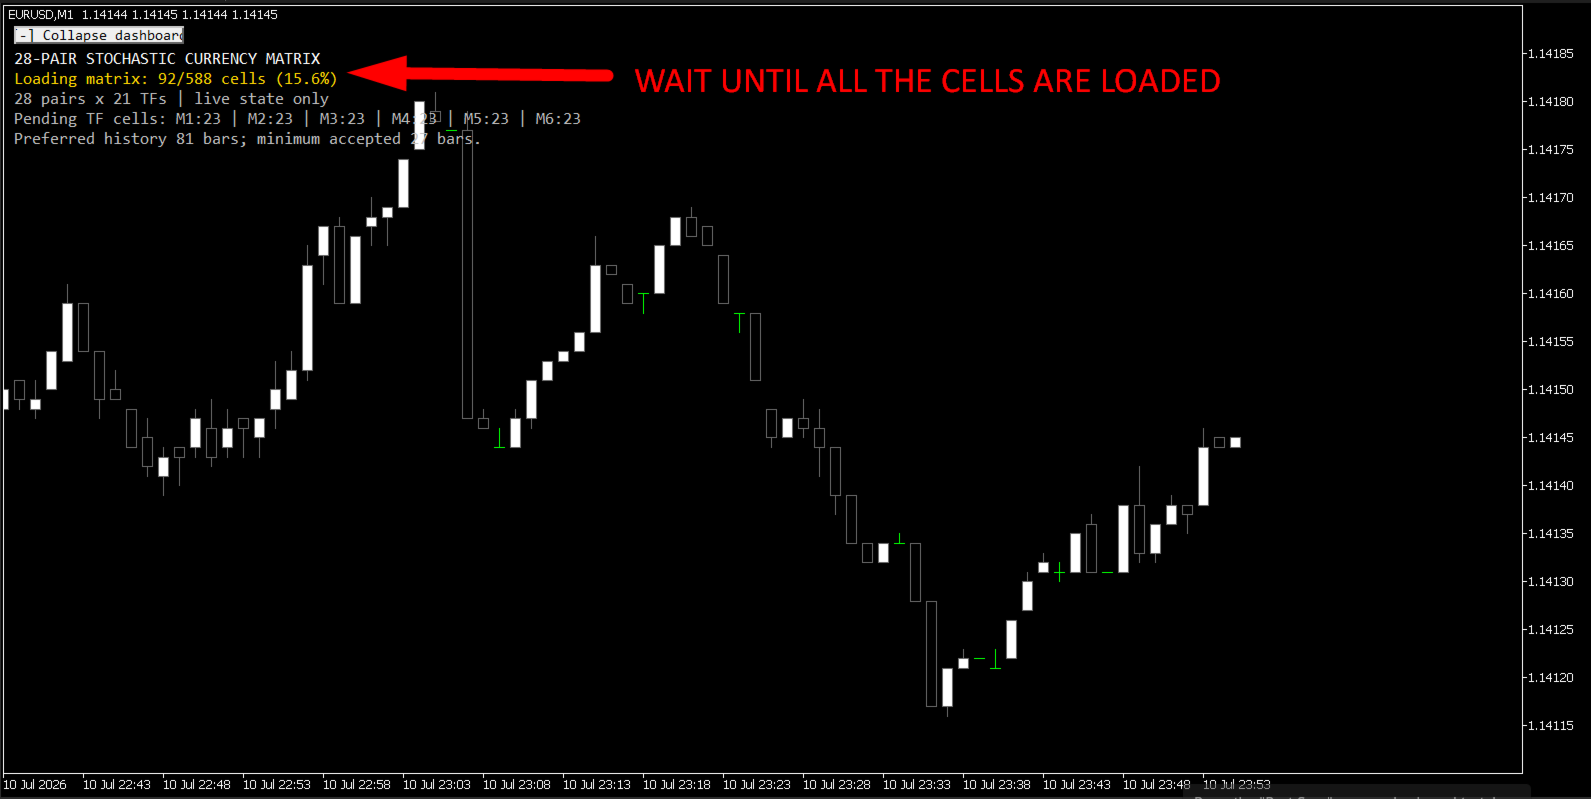
For the initial load, MetaTrader may need time to download historical data for multiple symbols and timeframes.
Broker compatibility
The indicator supports common broker symbol prefixes and suffixes.
Examples include:
                                                    EURUSD
EURUSD.a
EURUSDm
pro.EURUSD
Symbol detection should still be tested with the buyer’s broker before relying on alerts.
Interpretation
The indicator measures aggregated stochastic-divergence pressure. It is not a conventional trend-strength meter.
A bullish divergence can appear while price is still declining, and a bearish divergence can appear while price is still rising.
The indicator should therefore be combined with the user’s own market structure, trend, risk-management and execution rules.
Demo testing
The MQL5 Market demo version of an indicator can be viewed in the MetaTrader 5 Strategy Tester in Visual mode.
Because the indicator scans multiple symbols and timeframes, ensure that the required historical data is available during testing.
Disclaimer
This indicator provides technical analysis and alerts. It does not guarantee future price direction or trading results. Users are responsible for their own trading decisions and risk management.