FiboPlus MT5
- インディケータ
- バージョン: 2.1
- アップデート済み: 27 6月 2017
- アクティベーション: 5

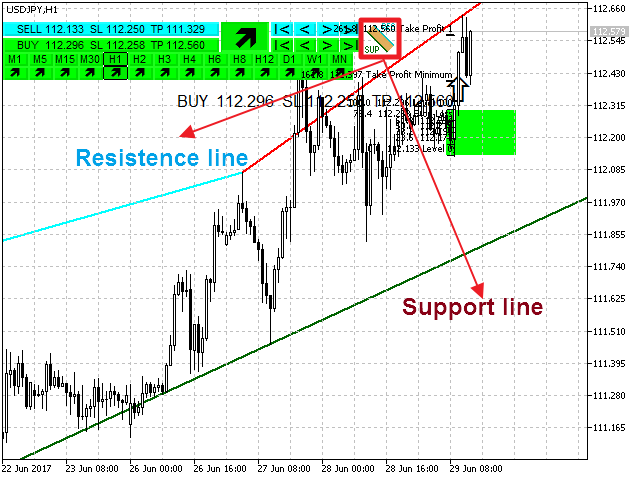
どんなツール(シンボル)でも、グラフのどんな期間でも、買いと売りのフィボナッチレベルの自動的な作成とフォローアップ。
FiboPlus は、次のものを表示している:
- アップかダウン方向、ありそうな値動きのフィボナッチレベル。
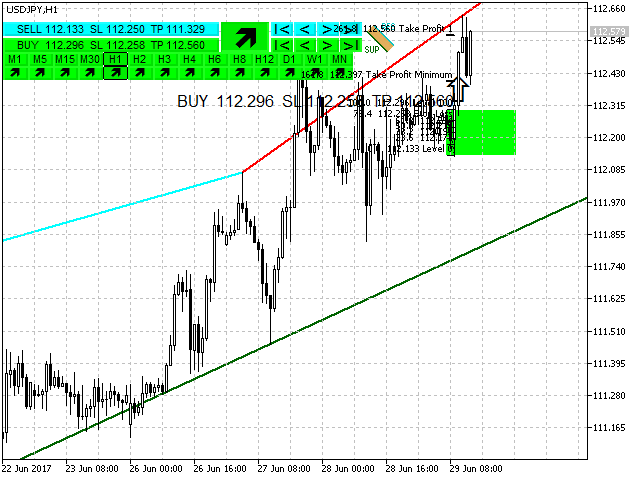
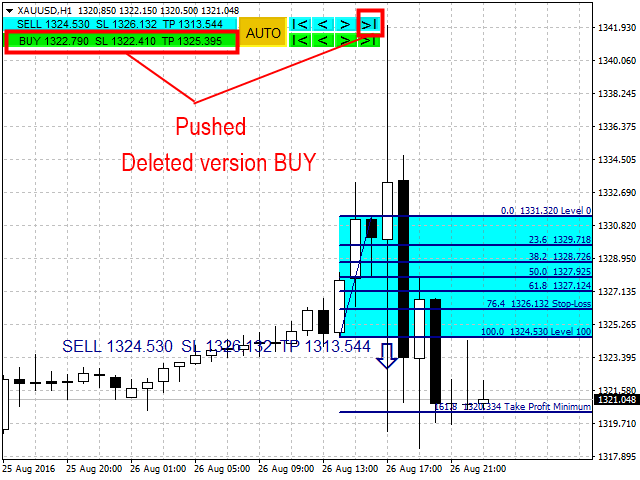
- エントリーポイントは「アップ矢印」、「ダウン矢印」アイコンで示され、情報はボタンにて再度表示されている。(SELL, BUY)
- 0から100までのレベルで限られた直角的エリア。トレードは、一つのレベルから他のレベルへ(トレンドなし)。
特長
- 値動きの予測、市場エントリーポイント、オーダーのための stop loss とtake profit。
- 作成済みのトレードシステム。
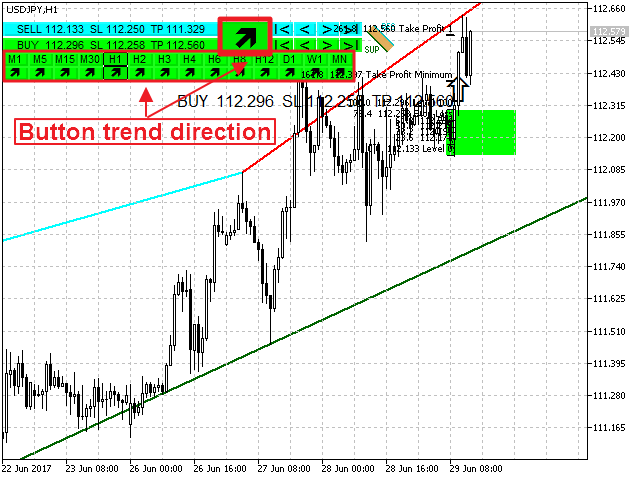
- 管理ボタンは、フィボナッチオプションの度リラかを選択できるようにする。
- 買いか売りのオプションを非表示にする。
- グラフの他の期間を参照する。
- 「+」と「―」ボタンは、レベルの自動的再計算しながらグラフを大きく・小さくする。
- 何のフィボナッチレベルでも。
- 何の色でも表示。
- ボタンをグラフの便利な場所に移動。
パラメーター
- Language (Russian, English, Deutsch, Espanol, Portugues)
- フィボナッチレベルのオバーレイのオプション:
- Best 同じ色のピークポイントに与え、反対の色の最初のピークまで、
- Standard 標準的な作成、
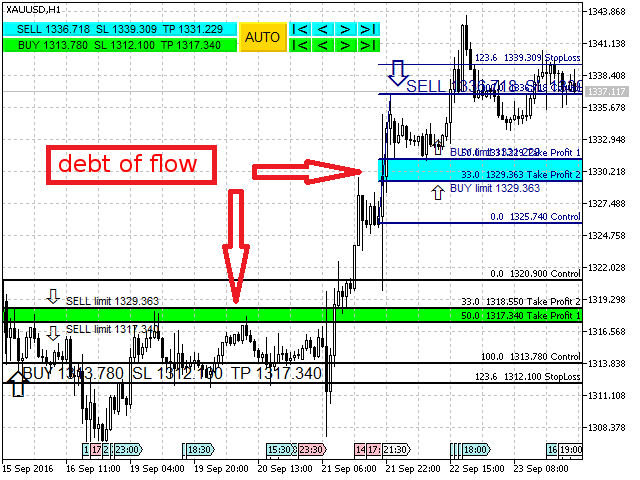
- debt of flow 市場の強い変形が発生した場合に得られるマーケットメーカーのストリーム債務
- カラースキーム(プリセットの色):
- White background 白いバックグラウンド用。
- Black background 黒いバックグラウンド用。
- Custom background 各色のユーザー設定。
- FIBO Custom 「、」で分けられたレベルの数値
- customcolors: 色のユーザー設定
- coordinatesX, Y buttons to snap pixels ボタンをグラフにつなげるためのX、Y座標
ボタン
- SELL. 売りに関する市場エントリーオプション。SELL ボタンを押せば、売りに対するフィボナッチレベルを表示・非表示にする。
- |<売りに市場エントリーの第1オプション
- < 売りに市場エントリーの前オプション
- > 売りに市場エントリーの次オプション
- >| 売りに市場エントリーの最後オプション+自動的フォローアップ
- BUY. 買いに関する市場エントリーオプション。BUY ボタンを押せば、買いに対するフィボナッチレベルを表示・非表示にする。
- |<買いに市場エントリーの第1オプション
- < 買いに市場エントリーの前オプション
- > 買いに市場エントリーの次オプション
- >| 買いに市場エントリーの最後オプション+自動的フォローアップ
- AUTO. 買いと売りに関する新しいフィボナッチレベルの自動的計算とフォローアップ。
FiboPlusインジケーターをもとにしたトレードシステム
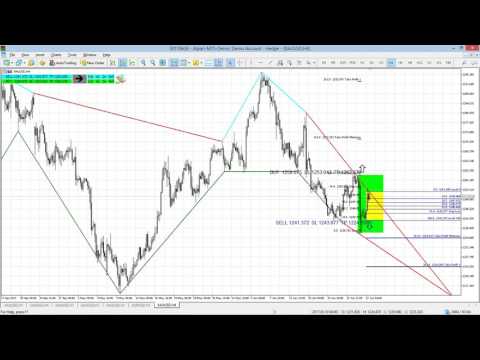
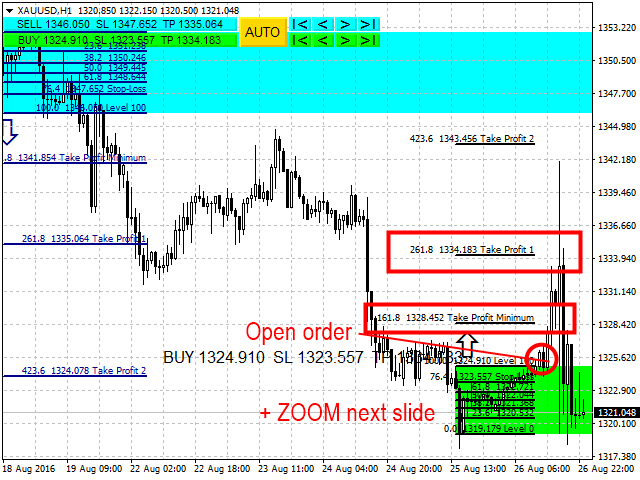
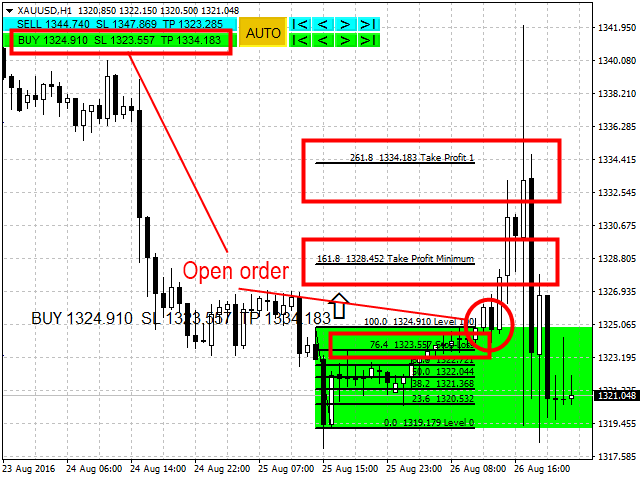
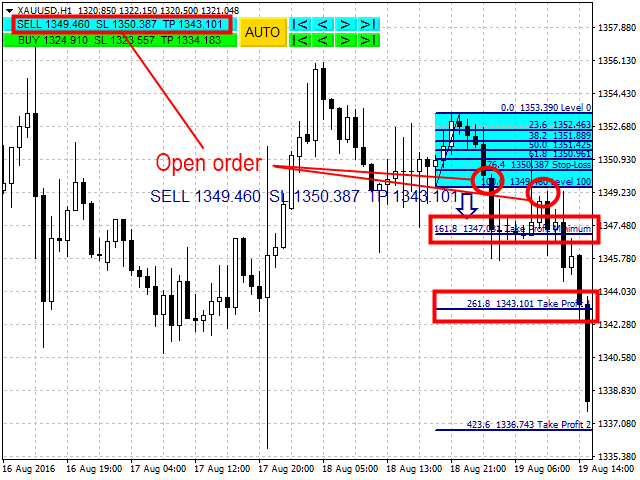
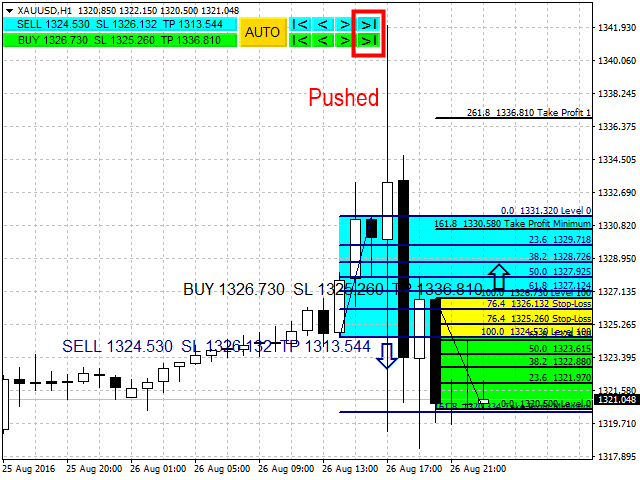
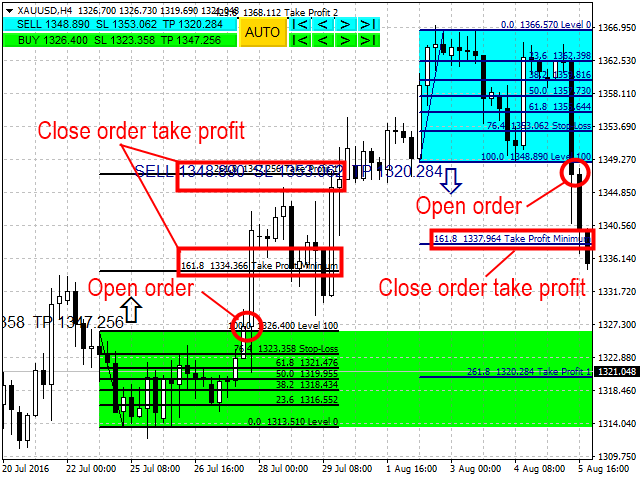
- 売り。ピークは100レベル以下でクローズし、stop loss は76.4レベル以上, take profit minimum 161.8, take profit 1 - 261.8, take profit 2 - 423.6.
- 買い。ピークは100レベル以上でクローズし、stop loss は76.4レベル以下, take profit minimum 161.8, take profit 1 - 261.8, take profit 2 - 423.6.
- 0から100までのレベルで限られた直角的エリアで買い/売り。トレードは、一つのレベルから他のレベルへ(トレンドなし)。
- "debt of flow" オプション。 FiboPlus はマーケットメーカーの「debt of flow」レベルを作成し、値がこれらのレベルへ戻る可能性が高い。100レベルから までのトレード。営業の第2オプション、トレンドに対して50%と33%レベルで延期制限オーダーの設定。
ツールの現在グラフにインジケーターをオバーレイする前にデータの更新が薦められる(次々に期間を押しながら M1, M5, M15, M30, H1, H2, H3, H4, H6, H8, H12, D1, W1, MN)。