Elara AI
- インディケータ
-
Prabir Sarkar
 Hello! I’m Prabir Sarkar, the creator behind AlgoMatrix, a brand focused on developing clean, stable and algorithmically-sound trading systems for MetaTrader 4 & MetaTrader 5.
My work specializes in:
• Trend-based Expert Advisors
• High-precision scalping systems - バージョン: 1.10
- アクティベーション: 7
A refined session-liquidity decision engine for traders who want to understand whether price is sweeping, rejecting, or accepting a breakout—not another chart filled with unexplained arrows.
Launch pricing moves forward: when the first three copies at $43 are gone, ELARA AI moves to the next listed tier. Completed launch tiers are not planned to reopen.
Every session leaves information behind. Highs and lows attract liquidity. A level can be swept and rejected, or broken and accepted. During the first moments, those two events may look almost identical—yet they can lead to completely different trade ideas.
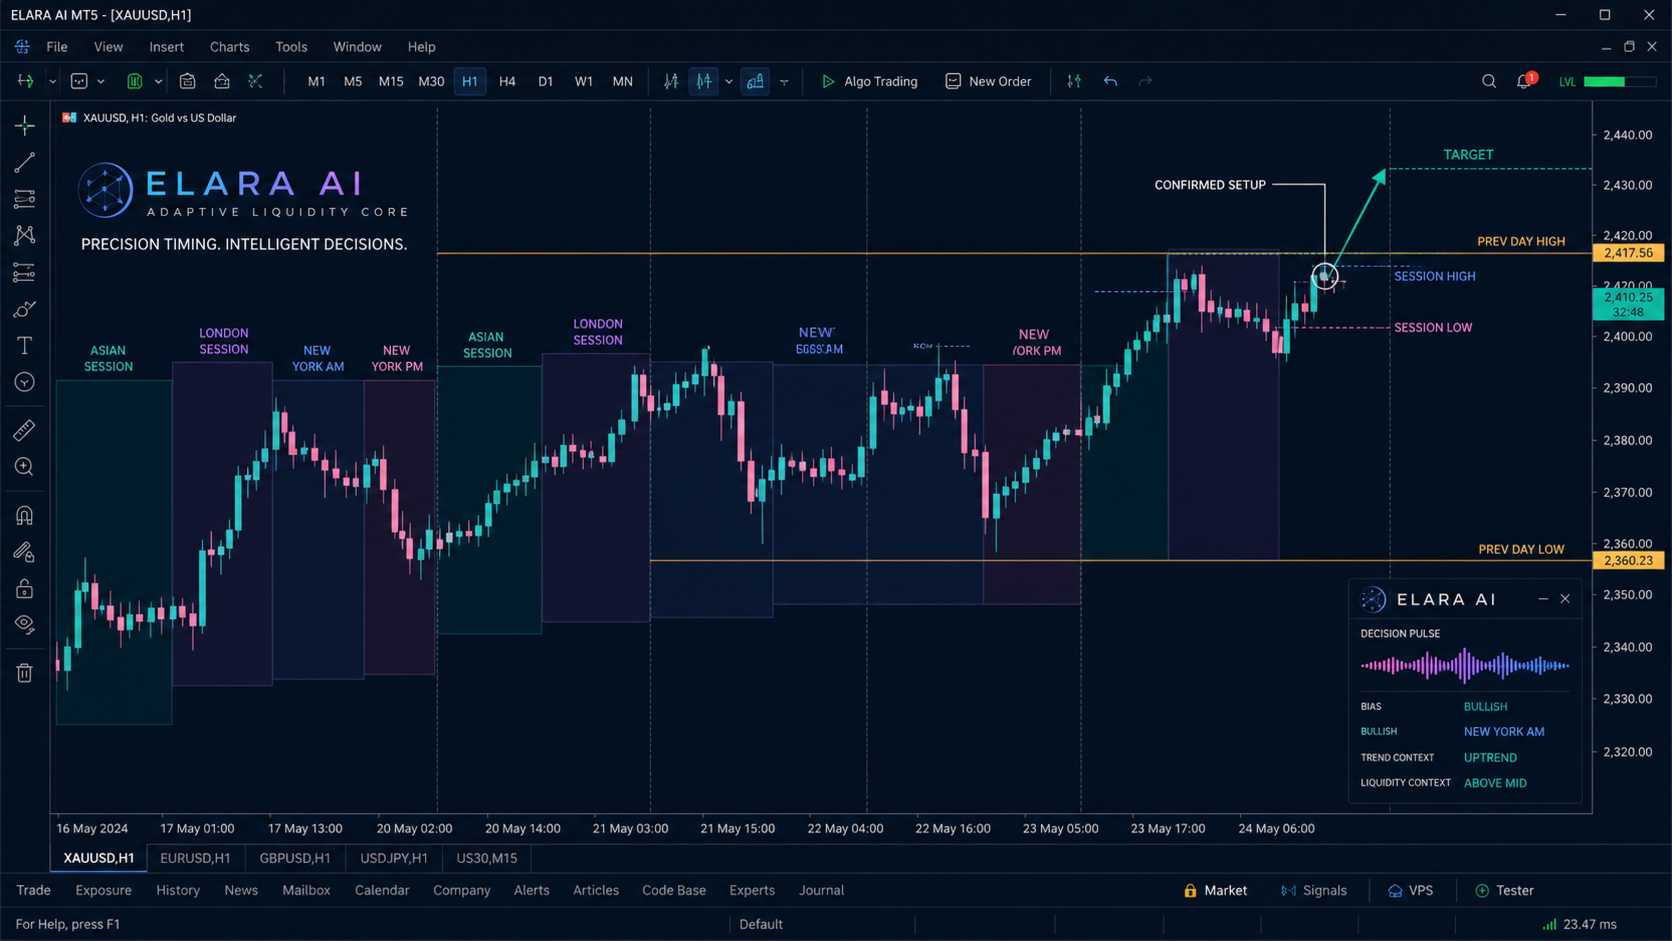
ELARA AI organizes that uncertainty into one professional workspace. It maps the Asian, London, New York AM and New York PM sessions, evaluates how price interacts with their liquidity, measures reversal pressure and breakout quality, and presents a structured decision state for manual trading.
Understand what price is doing around liquidity
A wick above a session high is not automatically a sell signal. A candle below a session low is not automatically a breakout. ELARA AI looks for the evidence surrounding the event.
For a possible reversal, the engine studies meaningful penetration, the return inside structure, rejection-wick quality, candle direction, displacement and follow-through. For a possible continuation, it evaluates close acceptance, body strength, ATR-normalized displacement, follow-through and market activity.
This distinction helps the trader avoid two common mistakes: fading a healthy breakout too early and chasing a false breakout after liquidity has already been rejected.
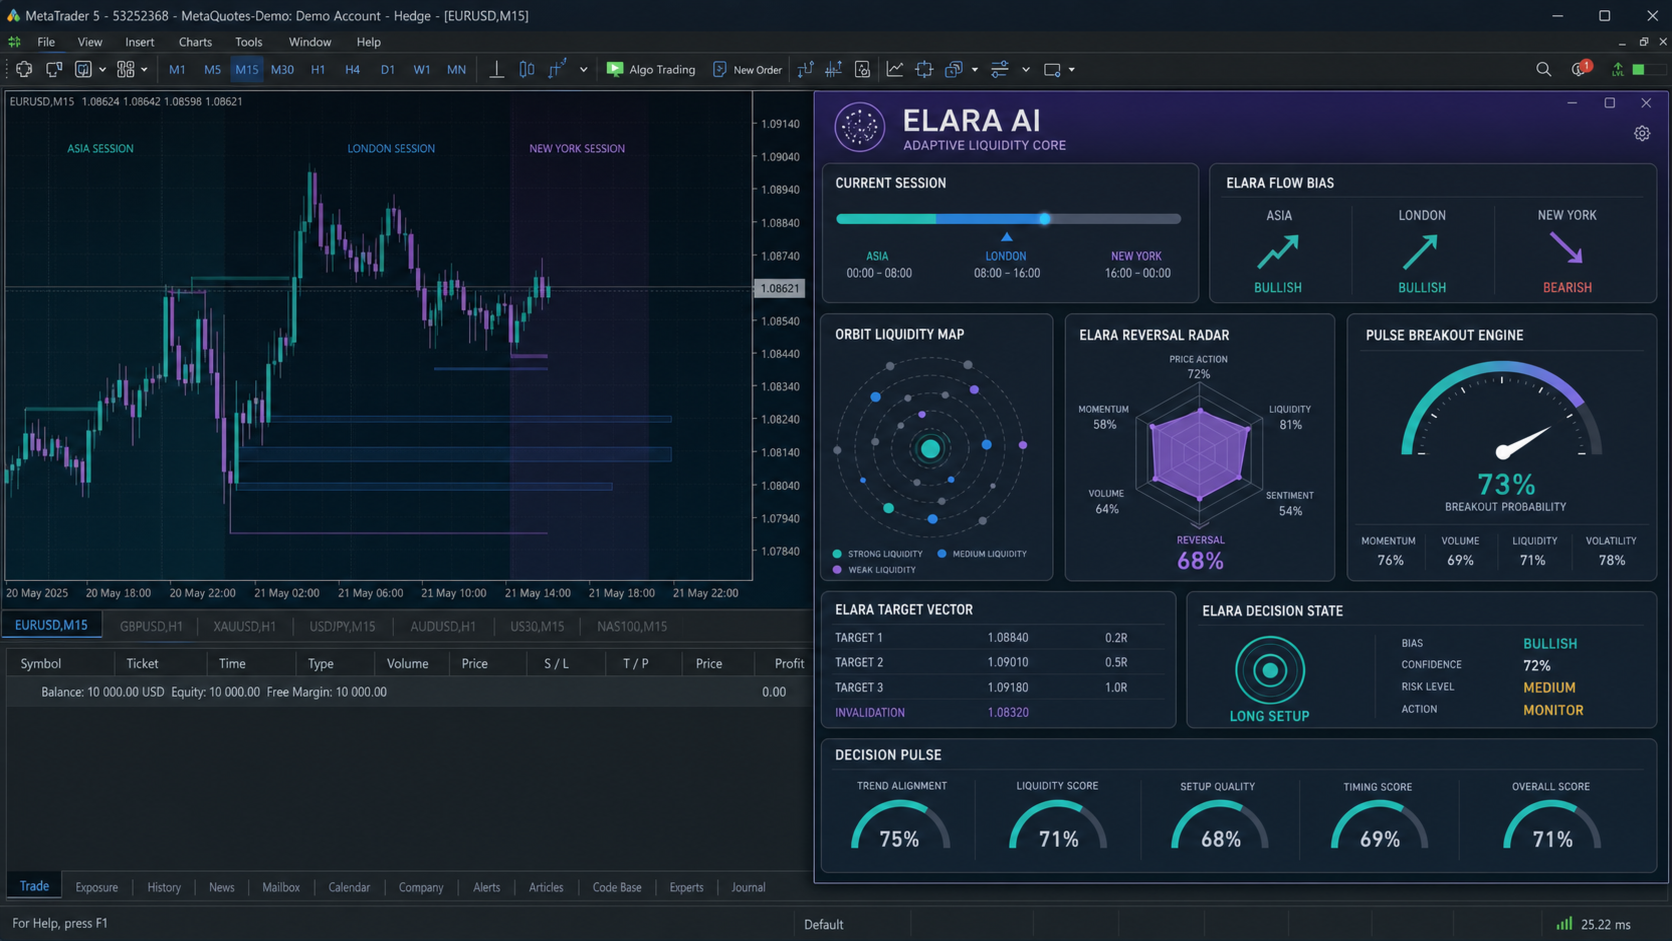
The ELARA Intelligence Interface
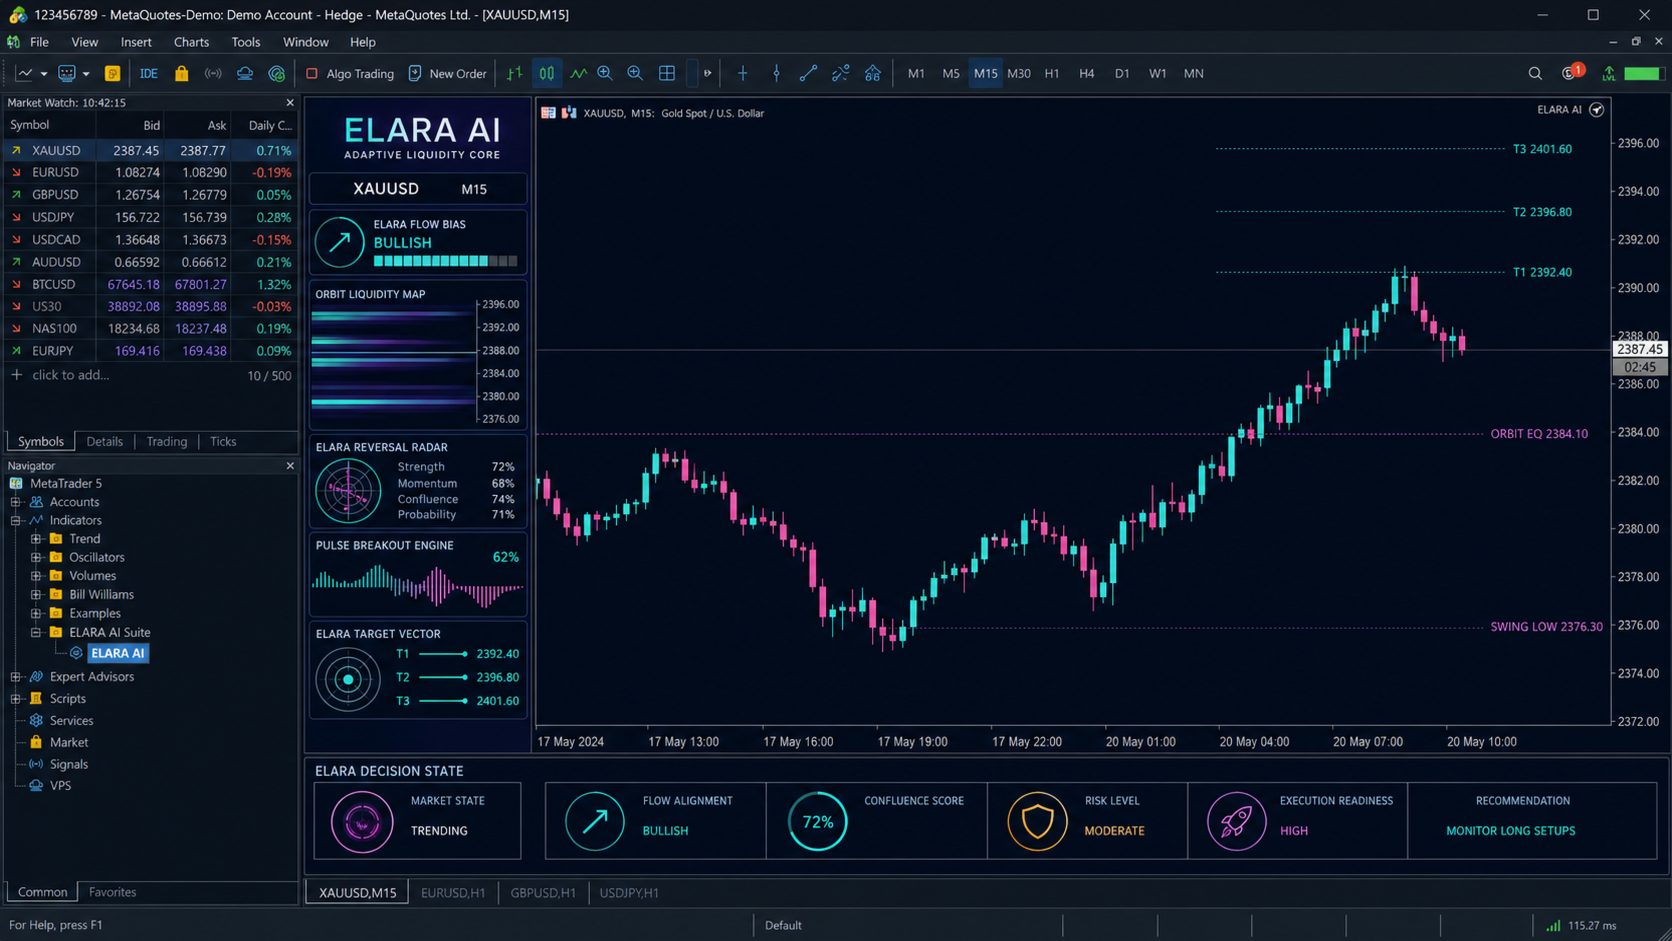
01 — Current Session
Displays the active session, broker time and session progress so the current structure can be viewed in context.
02 — ELARA Flow Bias
Summarizes the directional character of the Asian, London and New York session structures.
03 — Orbit Liquidity Map
Shows whether the Asian range is building or complete and whether its high or low remains intact or has been swept.
04 — ELARA Reversal Radar
Condenses rejection and trap-related evidence into one clear pressure score and state.
05 — Pulse Breakout Engine
Measures whether price is showing genuine acceptance and continuation strength beyond session structure.
06 — ELARA Target Vector
Highlights the next structural objective or the selected fixed risk-ratio target.
07 — ELARA Decision State
Converts the current evidence into a practical state such as waiting, bullish setup developing, bearish setup developing, or confirmed opportunity.
08 — Decision Pulse Panel
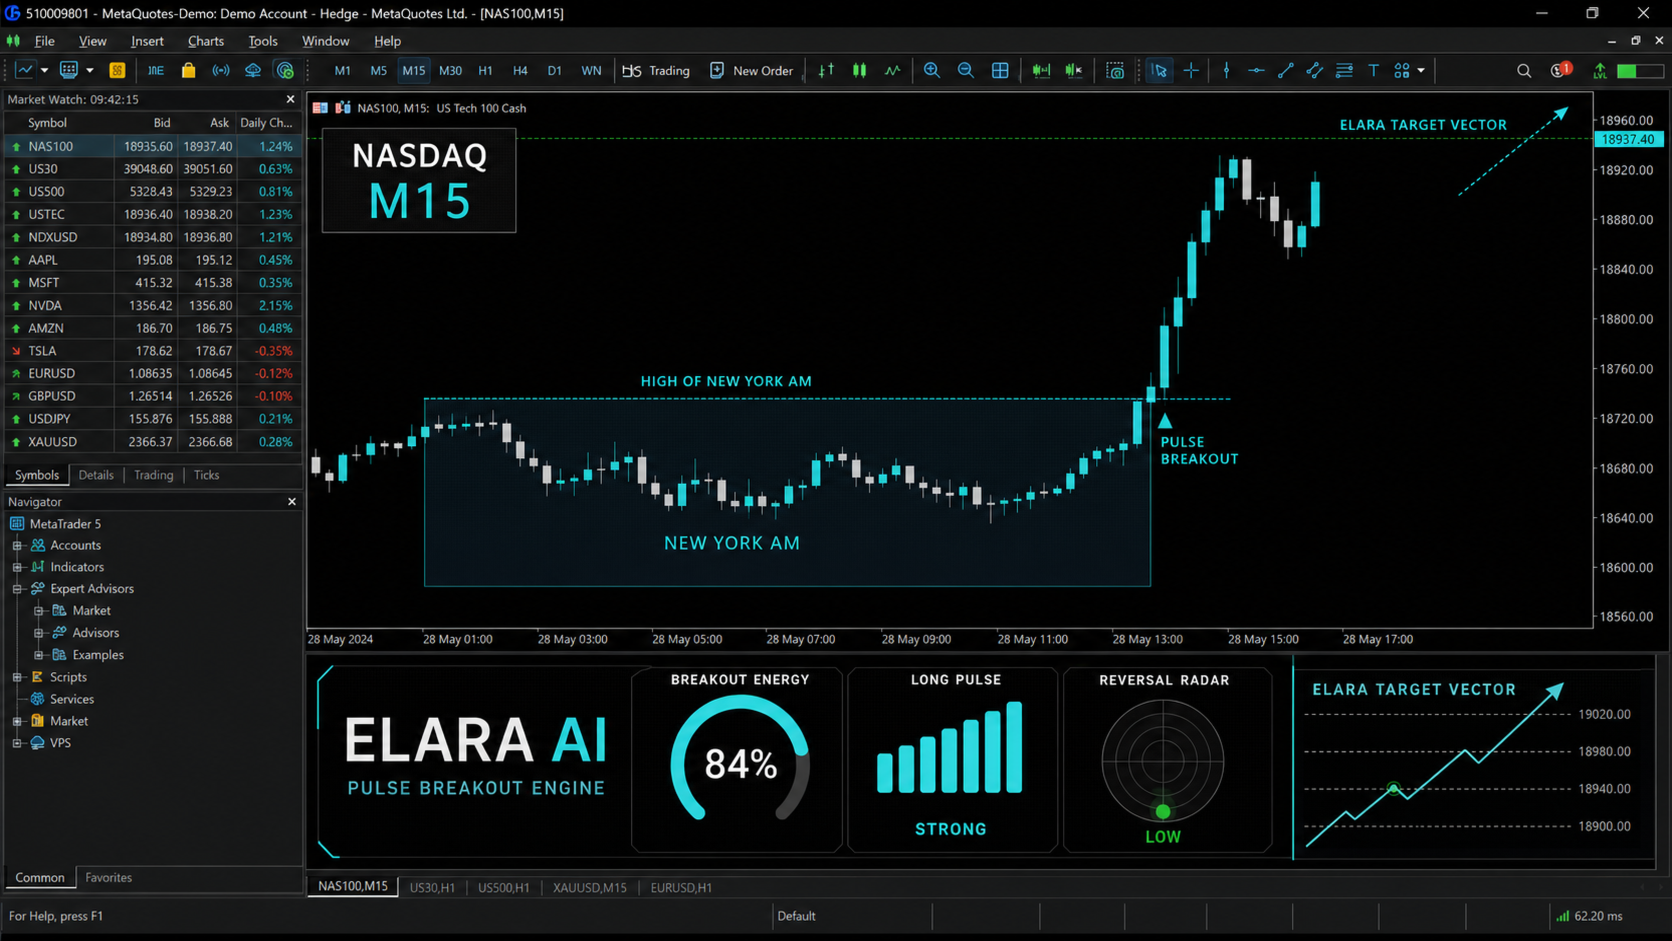
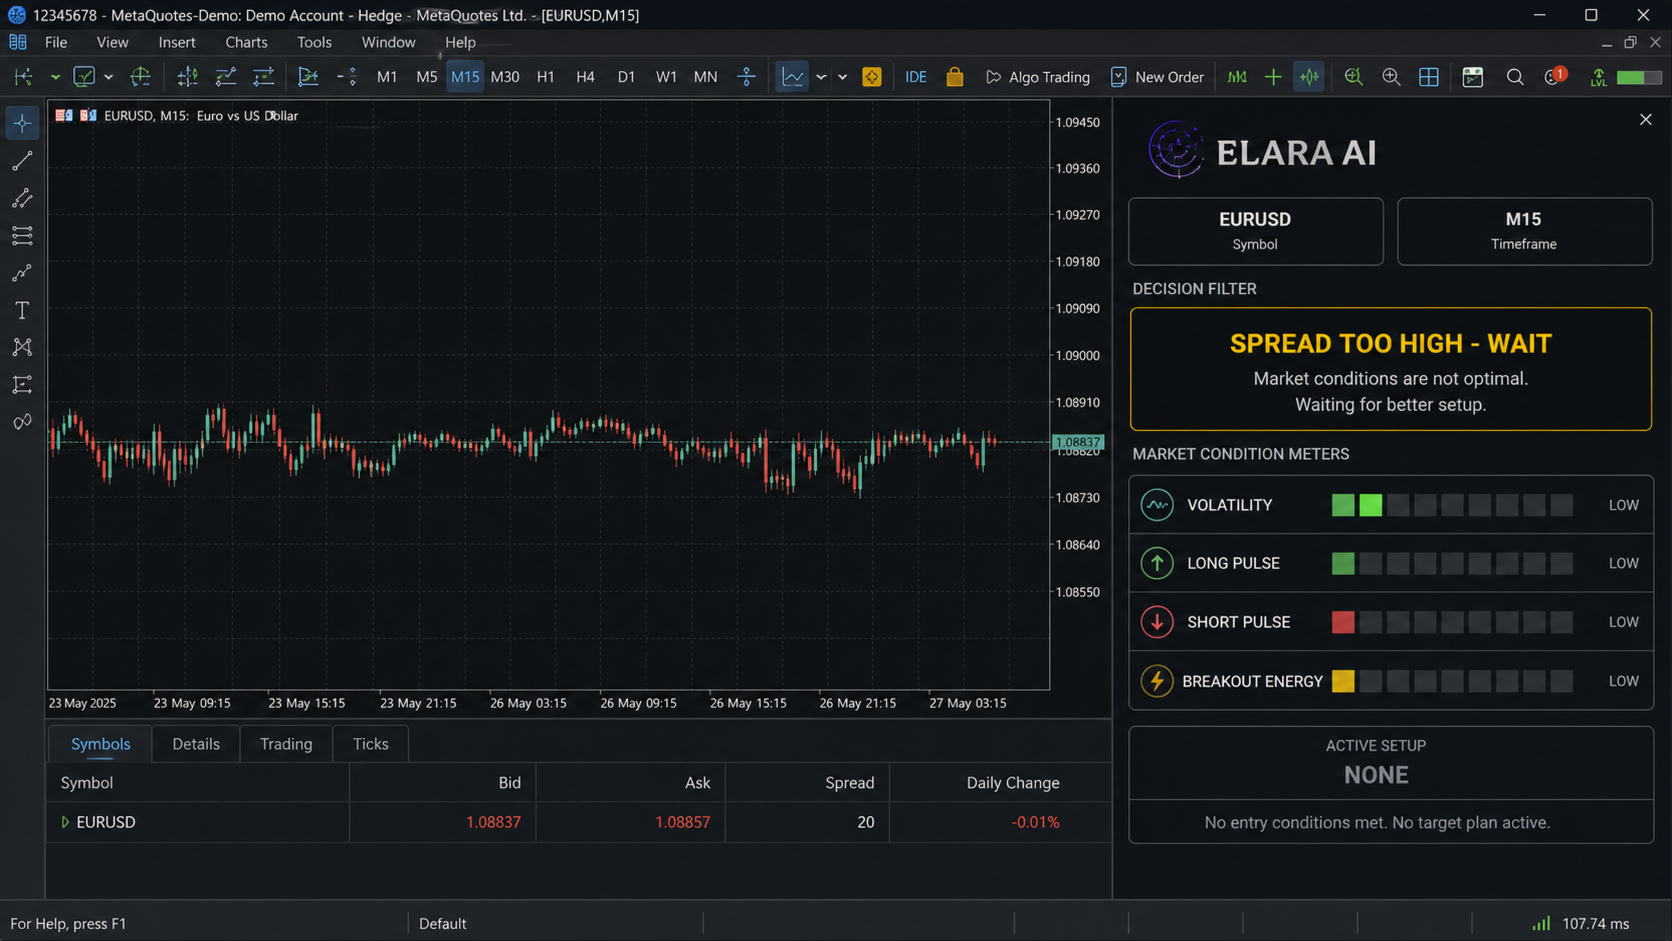
Displays Long Pulse, Short Pulse, Reversal Radar and Breakout Energy together for rapid comparison.
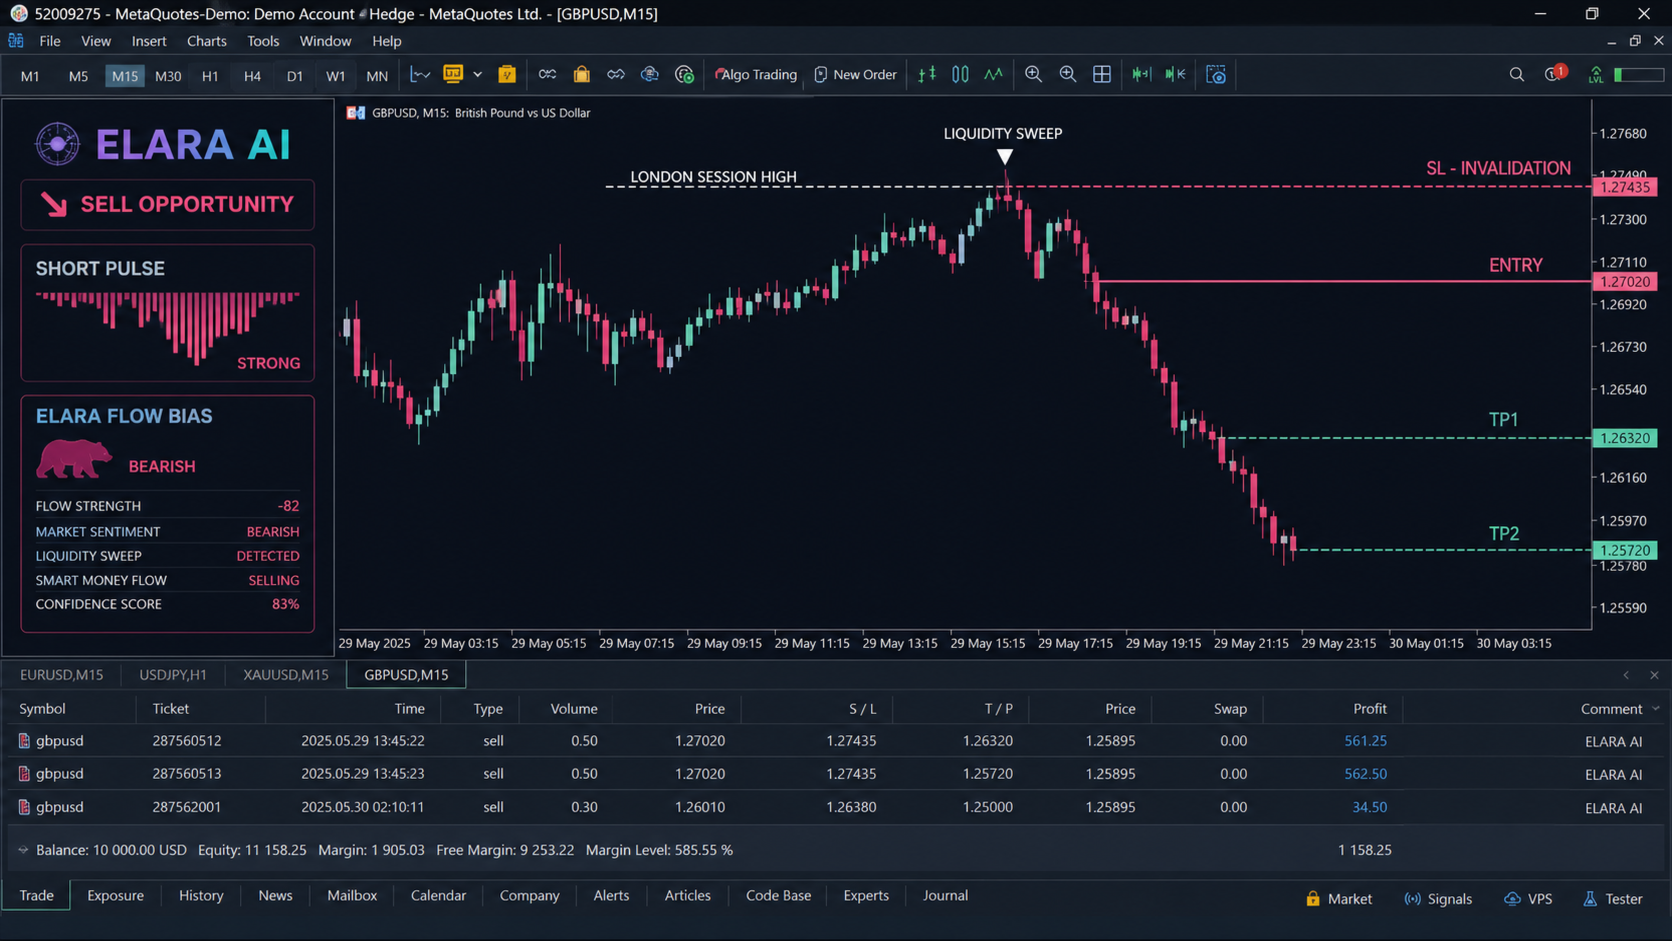
A complete visual trade plan
When a setup passes ELARA's confirmation, spread, volatility and reward-to-risk filters, the chart can display a complete analytical plan:
- reference entry level;
- SL invalidation level;
- TP1 and TP2 target references;
- initial reward-to-risk information;
- 1R monitoring and analytical breakeven status;
- signal badge and setup direction;
- local TP1, TP2, SL and breakeven observation counters.
The plan is visual guidance only. ELARA AI does not execute or manage a real position; the trader remains responsible for order placement, position sizing and trade management.
How ELARA approaches a reversal
Bullish liquidity reversal
Price first attacks liquidity below a session low. ELARA then checks whether the penetration is meaningful, whether the completed candle returns inside the range, whether the lower wick shows rejection and whether the next price action supports a move away from the swept area. If enough evidence aligns and the safety filters pass, Long Pulse can develop into a confirmed bullish opportunity.
Bearish liquidity reversal
Price attacks liquidity above a session high, but continuation begins to fail. ELARA evaluates the upper-wick response, close location, bearish displacement, return inside structure and follow-through. When those conditions align, Short Pulse and Reversal Radar can identify a qualified bearish opportunity for independent confirmation.
How ELARA approaches a breakout
A valid continuation requires more than price briefly touching the other side of a range. ELARA's Pulse Breakout Engine studies how far the candle closes beyond structure, how much of the candle is directional body, whether displacement is meaningful relative to ATR and whether subsequent completed candles support acceptance.
Strong Breakout Energy can help a trader avoid selling simply because a session high has broken or buying simply because a session low has broken. Weak acceptance combined with strong rejection can instead increase the relevance of the Reversal Radar.
Sometimes the best decision is WAIT
ELARA AI is designed to reject conditions that do not meet its safety rules. The Decision State can remain neutral or display a clear warning when:
- spread is too high;
- volatility is too low;
- a candle is abnormally large;
- session data is insufficient;
- the structural reward-to-risk is poor;
- closed-candle confirmation is incomplete.
This does not remove trading risk, but it helps prevent every market fluctuation from being presented as an opportunity.
Midnight Aurora visual identity
ELARA AI includes a distinctive chart theme designed to remain clear over session zones. Luminous aqua bullish candles, orchid-rose bearish candles, restrained violet structure and deep midnight backgrounds create a consistent professional workspace.
- unique aqua and orchid candle palette;
- subtle Asian, London and New York session zones;
- session high and low structure lines;
- previous-day high, previous-day low and day-open references;
- draggable and minimizable dashboard;
- saved panel position per chart, symbol and timeframe;
- optional chart-theme restoration when the indicator is removed.
A practical manual-trading workflow
Step 1: Verify that the session times match your broker's server clock.
Step 2: Read ELARA Flow Bias and compare Long Pulse with Short Pulse.
Step 3: Decide whether price is interacting with intact liquidity, sweeping a level, or accepting a breakout.
Step 4: Compare Reversal Radar with Breakout Energy. They describe different market stories and should not be interpreted as identical signals.
Step 5: Wait for the confirmed Decision State. Closed-candle confirmation is recommended for stable decisions.
Step 6: Review entry, invalidation, targets, spread, news risk and position size before placing any manual order.
Step 7: Skip the trade if price has already moved too far from the reference entry or the setup no longer meets your personal reward-to-risk rules.
Markets and timeframes
ELARA AI can be used on Forex, metals, indices and cryptocurrencies where suitable broker data is available. It may be particularly useful on actively traded symbols such as XAUUSD, EURUSD, GBPUSD, GBPJPY, NASDAQ, US30 and BTCUSD.
M15 is a practical starting point because it offers a balance between session detail and signal stability. Lower timeframes react more quickly but contain more noise and spread sensitivity. Higher timeframes provide broader structure but naturally produce fewer events. No timeframe or preset is universally best.
Sweep distance, spread limits, minimum ATR and session times should be calibrated to the instrument and broker. Settings copied from a major FX pair should not be applied unchanged to gold, indices or cryptocurrency.
What is included
ELARA AI is a native MetaTrader 5 indicator with no DLL and no external service dependency. Its engine includes session mapping, liquidity-sweep detection, reversal/trap analysis, breakout acceptance, volatility normalization, spread filtering, target ranking, visual trade planning and configurable alerts.
Users can control session schedules, sweep sensitivity, wick requirements, reversal and breakout thresholds, higher-timeframe context, ATR settings, signal grades, target mode, dashboard behavior, chart visuals and notification channels.
Designed for decisions—not dependency
ELARA AI does not claim to predict the future. Its percentages are normalized summaries of currently aligned rules, not guaranteed win probabilities. A high Reversal Radar score means more rejection-related evidence is present. High Breakout Energy means more acceptance-related evidence is aligned.
The purpose is to make the reasoning visible. The trader can compare ELARA's state with price action, market structure, scheduled news and personal risk rules before deciding whether the setup deserves attention.
Who is ELARA AI for?
ELARA AI is designed for manual session and liquidity traders, London and New York reversal traders, and breakout traders who want acceptance confirmation before acting. It can also support gold and index traders who need a fast visual summary of session structure.
It is most suitable for traders who understand basic candlesticks, stop-loss placement, reward-to-risk and position sizing. New traders may use the interface as a learning aid, but should never treat a Long Pulse, Short Pulse or confirmed opportunity as an instruction to trade without independent confirmation.
ELARA AI is an analytical indicator, not an automated trading robot. It does not open, modify or close positions. Long Pulse, Short Pulse, Reversal Radar, Breakout Energy, target levels and outcome counters do not guarantee future performance. Always confirm every setup independently and use appropriate risk management.
Before purchasing
Please review the screenshots and product information carefully. Broker symbols, prices, spreads, session times, daylight-saving schedules, tick volume and historical data can differ. Therefore, dashboard values, signals and visual outcomes may vary between brokers and accounts.
No indicator can eliminate risk or predict every market movement. Begin on a demo account, verify the session configuration and observe the indicator across different market conditions before considering live use.