Peak Pips MT4

  • インディケータ
  • Sindhu Bairavim
    Sindhu Bairavim
    4.4 (21)
    私は、信頼性の高い高品質なソフトウェアソリューションの構築において14年以上の経験を持つテクニカルアーキテクトです。私は、MQL5インジケーターおよびエキスパートアドバイザー(EA)の開発においても、同様の正確さ、構造、そして問題解決への姿勢を活かしています。私の焦点は、トレーダーが市場をより明確に読み解き、憶測を減らし、確信を持ってより情報に基づいた意思決定を行えるよう支援する、実用的な取引ツールの作成にあります。
  • バージョン: 1.2
  • アップデート済み: 15 7月 2026
  • アクティベーション: 20

Peak Pips MT4

Zero-Repainting Trend Signals, Peak-Pips Tracking and Multi-Timeframe Scanning

Peak Pips MT4 is a powerful trend-analysis indicator designed to help traders identify fresh BUY and SELL opportunities for scalping, intraday and swing trading, all from one chart.

Backed by 23 years of testing with Dukascopy 100% tick data, the indicator combines a protected signal algorithm, confirmed zero-repainting signals, live peak-pips tracking and a built-in multi-timeframe scanner in one trader-friendly workspace.

Instead of switching constantly between charts, traders can monitor directional conditions, review signal performance and track favorable price movement more efficiently.

More Than an Arrow Indicator

Peak Pips MT4 is designed to filter noisy market movement and highlight stronger trend conditions rather than filling the chart with random arrows.

Its private signal engine focuses on producing qualified signals while keeping the core strategy logic fixed and protected.

Use it with your preferred:

  • Symbols
  • Trading sessions
  • Timeframes
  • Alert settings
  • Scalping, intraday or swing-trading approach

The indicator does not force one trading style.

Qualified BUY and SELL Signals

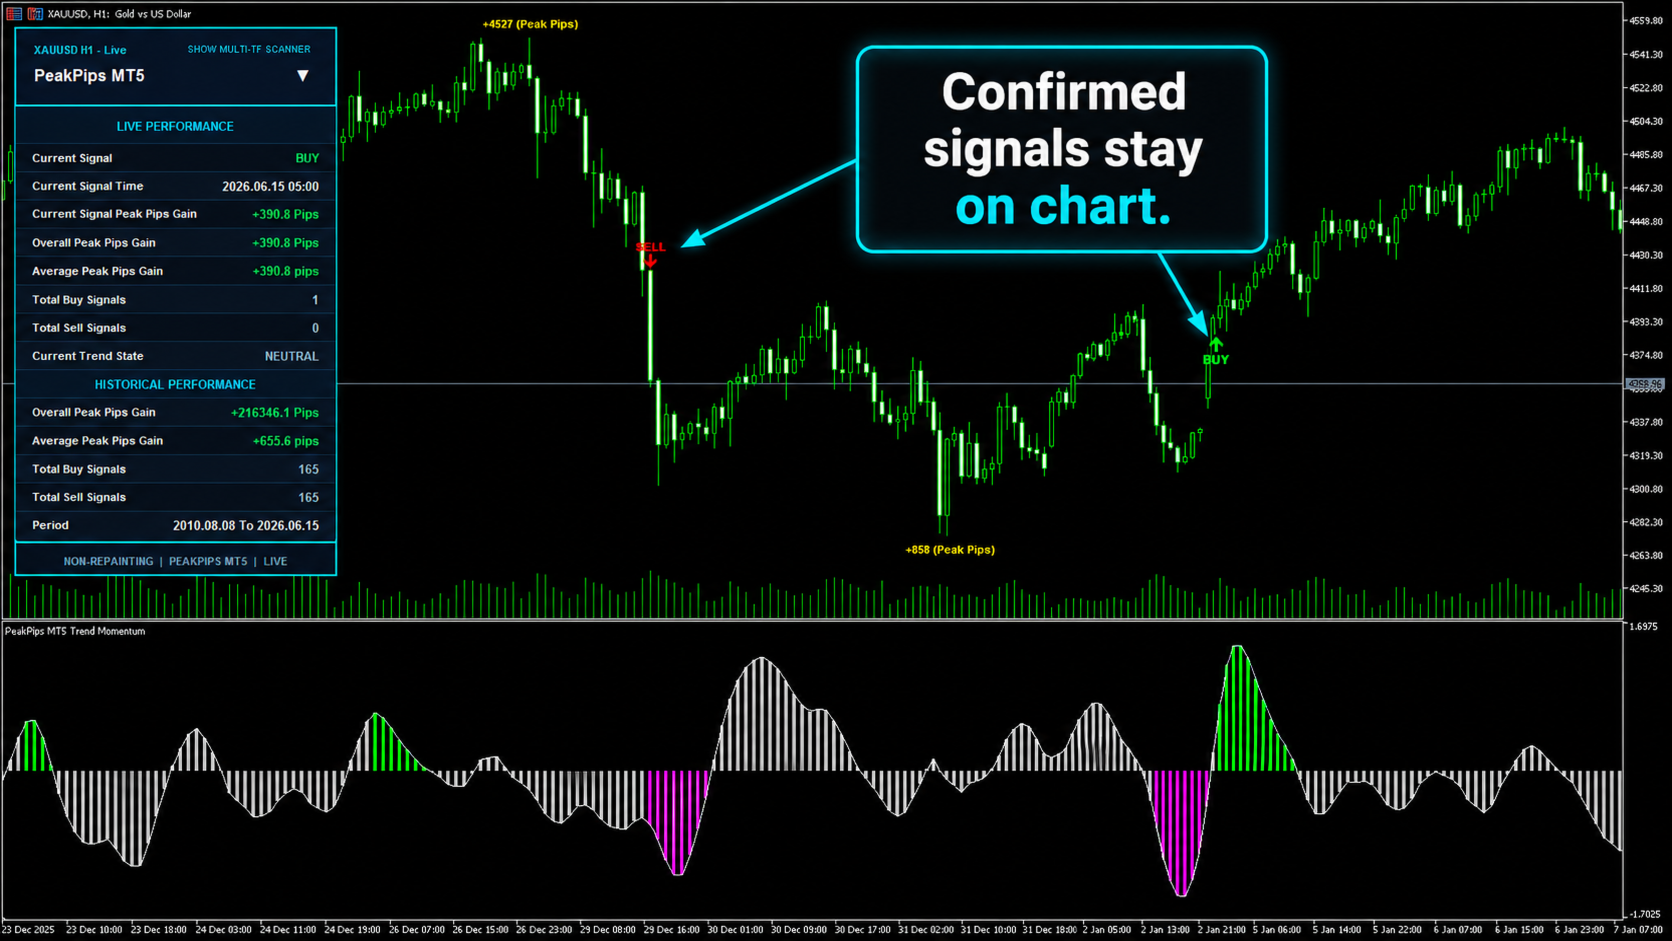
Peak Pips MT4 displays clear BUY and SELL signals when its internal conditions are confirmed.

The zero-repainting design helps traders review chart signals with greater consistency, while the visual labels and alerts make new opportunities easier to notice.

Signals can be used as part of your own trading plan, confirmation process and risk-management rules.

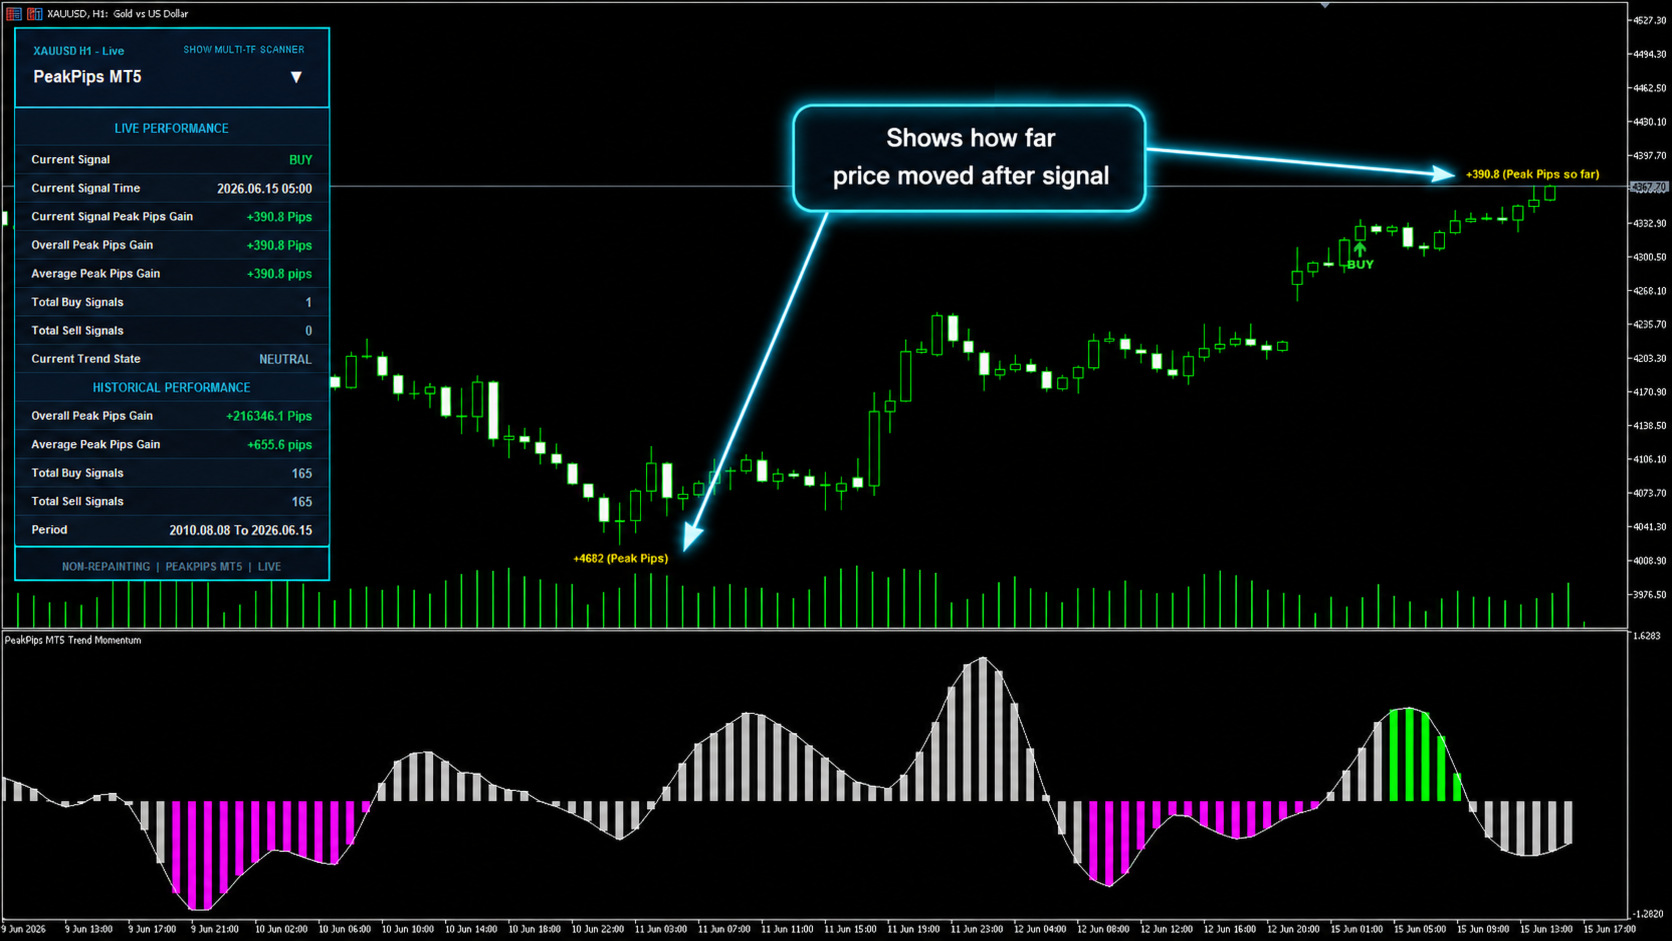
Live Peak-Pips Tracking

One of the indicator's main strengths is its Peak Pips Tracker, which measures how far price moves in favor of each signal.

It helps you evaluate:

  • Current signal movement
  • Maximum favorable movement
  • Live peak-pips gain
  • Historical signal performance
  • Average peak-pips gain
  • Overall movement captured by previous signals

This provides a clearer view of signal behavior than a basic entry arrow alone.

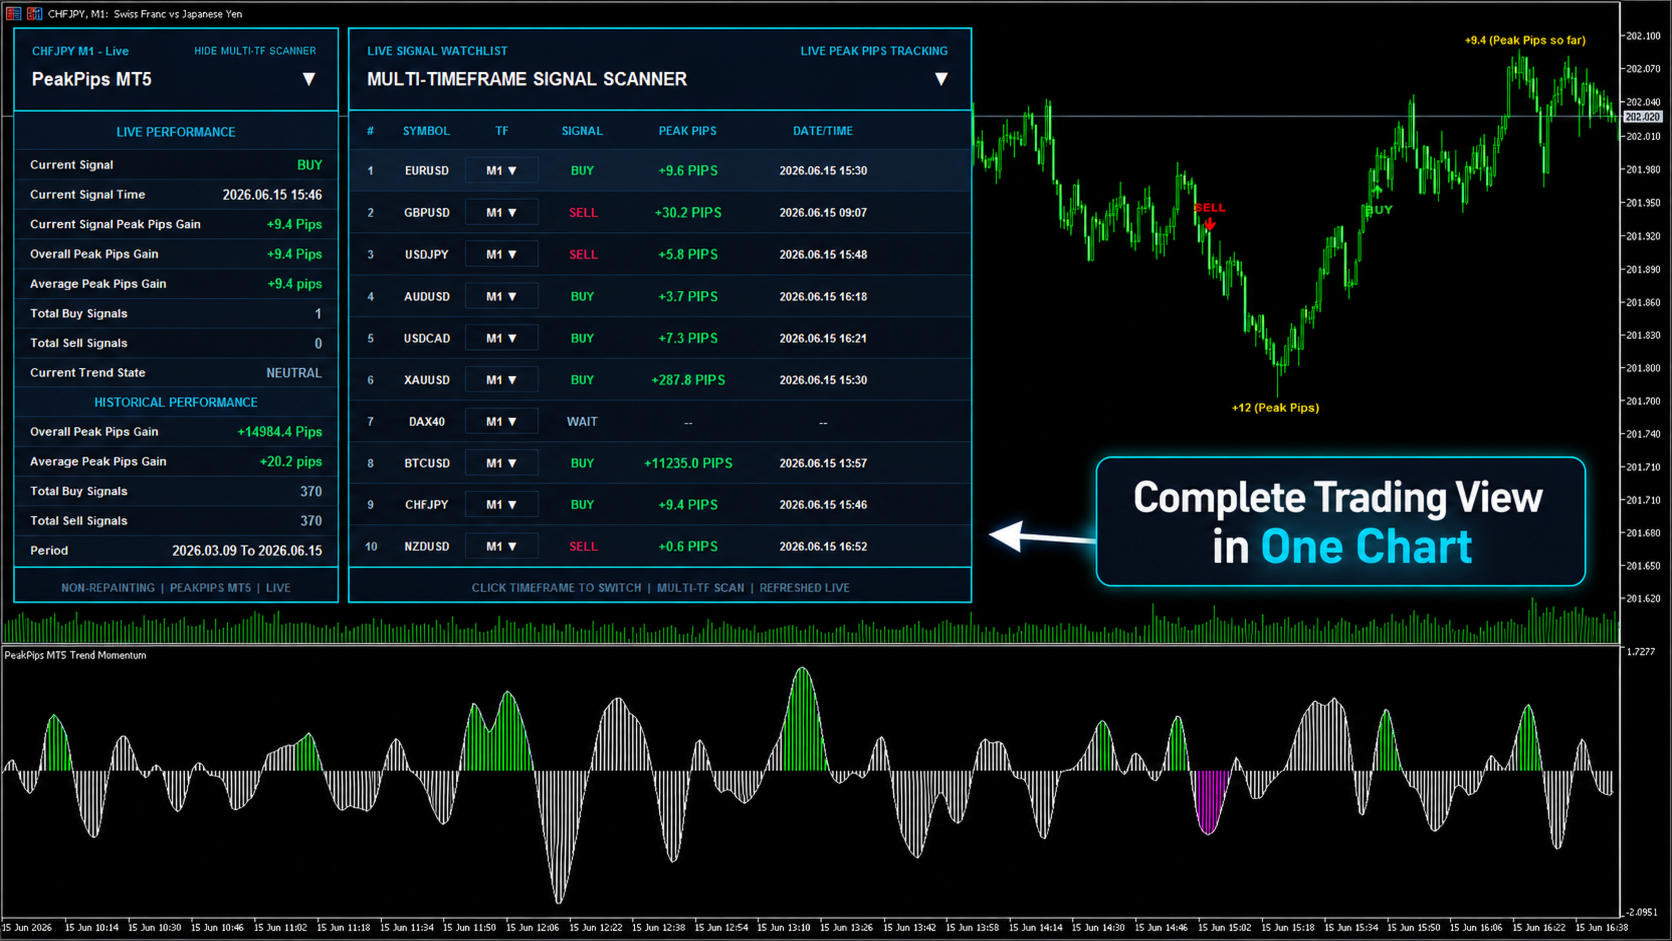
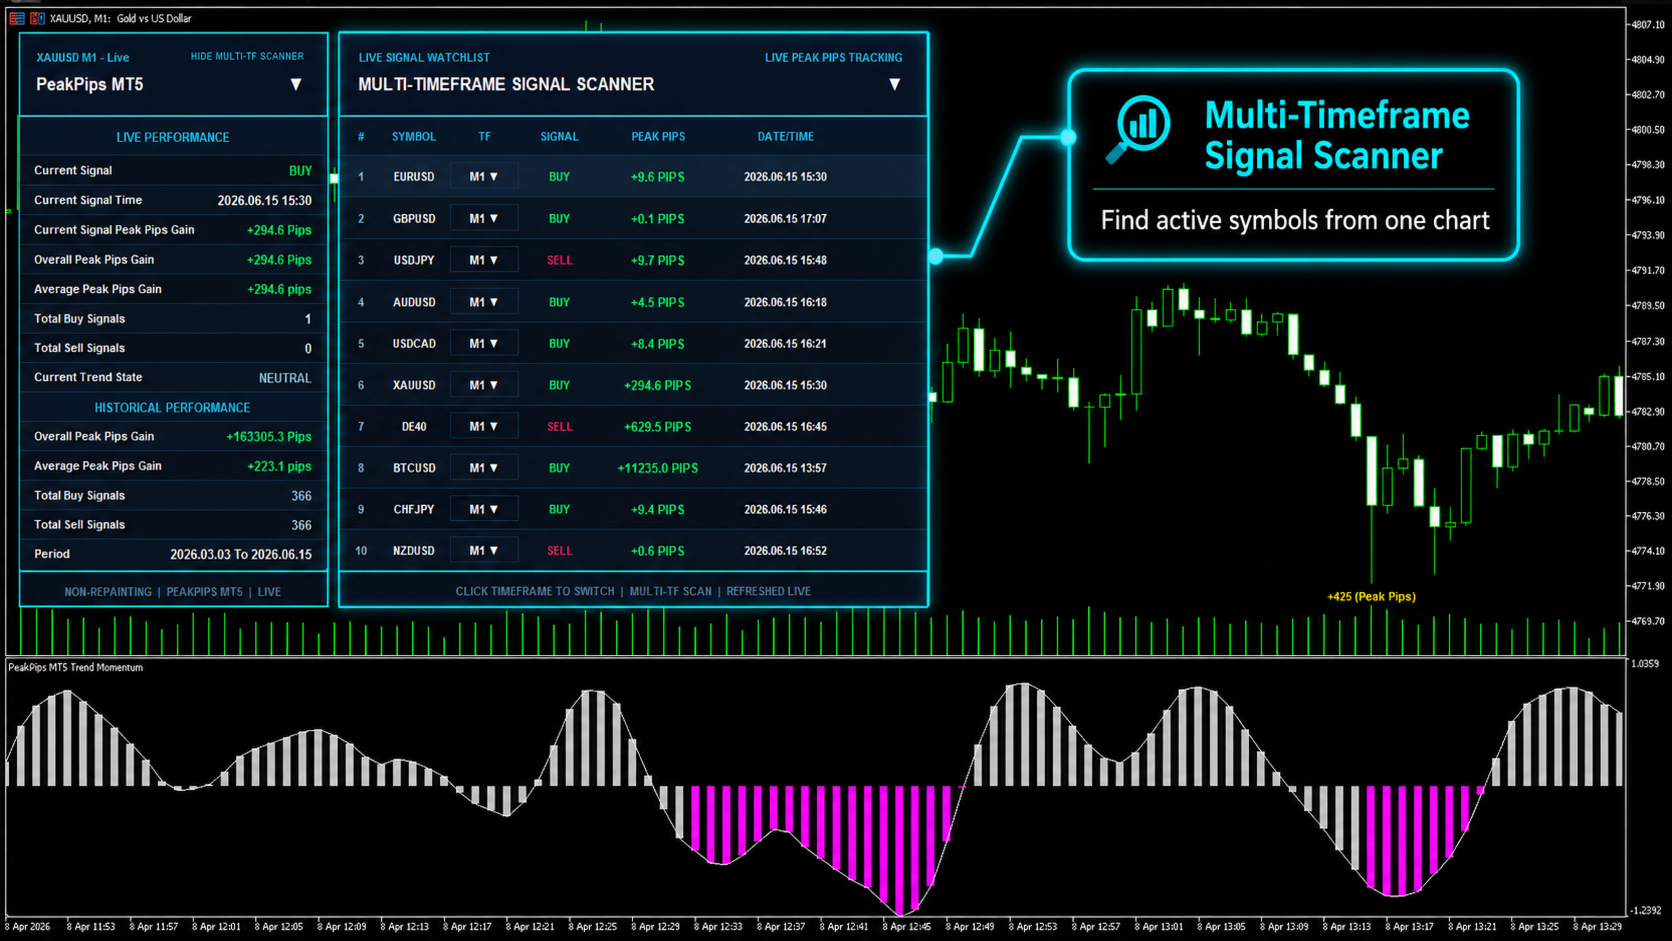
Multi-Timeframe Signal Scanner

Monitor multiple selected symbols and timeframes from one chart.

The scanner displays:

  • BUY, SELL or WAIT status
  • Symbol and timeframe
  • Signal time
  • Live peak-pips movement
  • Current directional condition

This can reduce unnecessary chart switching and help traders review several markets more efficiently.

Three Integrated Performance Panels

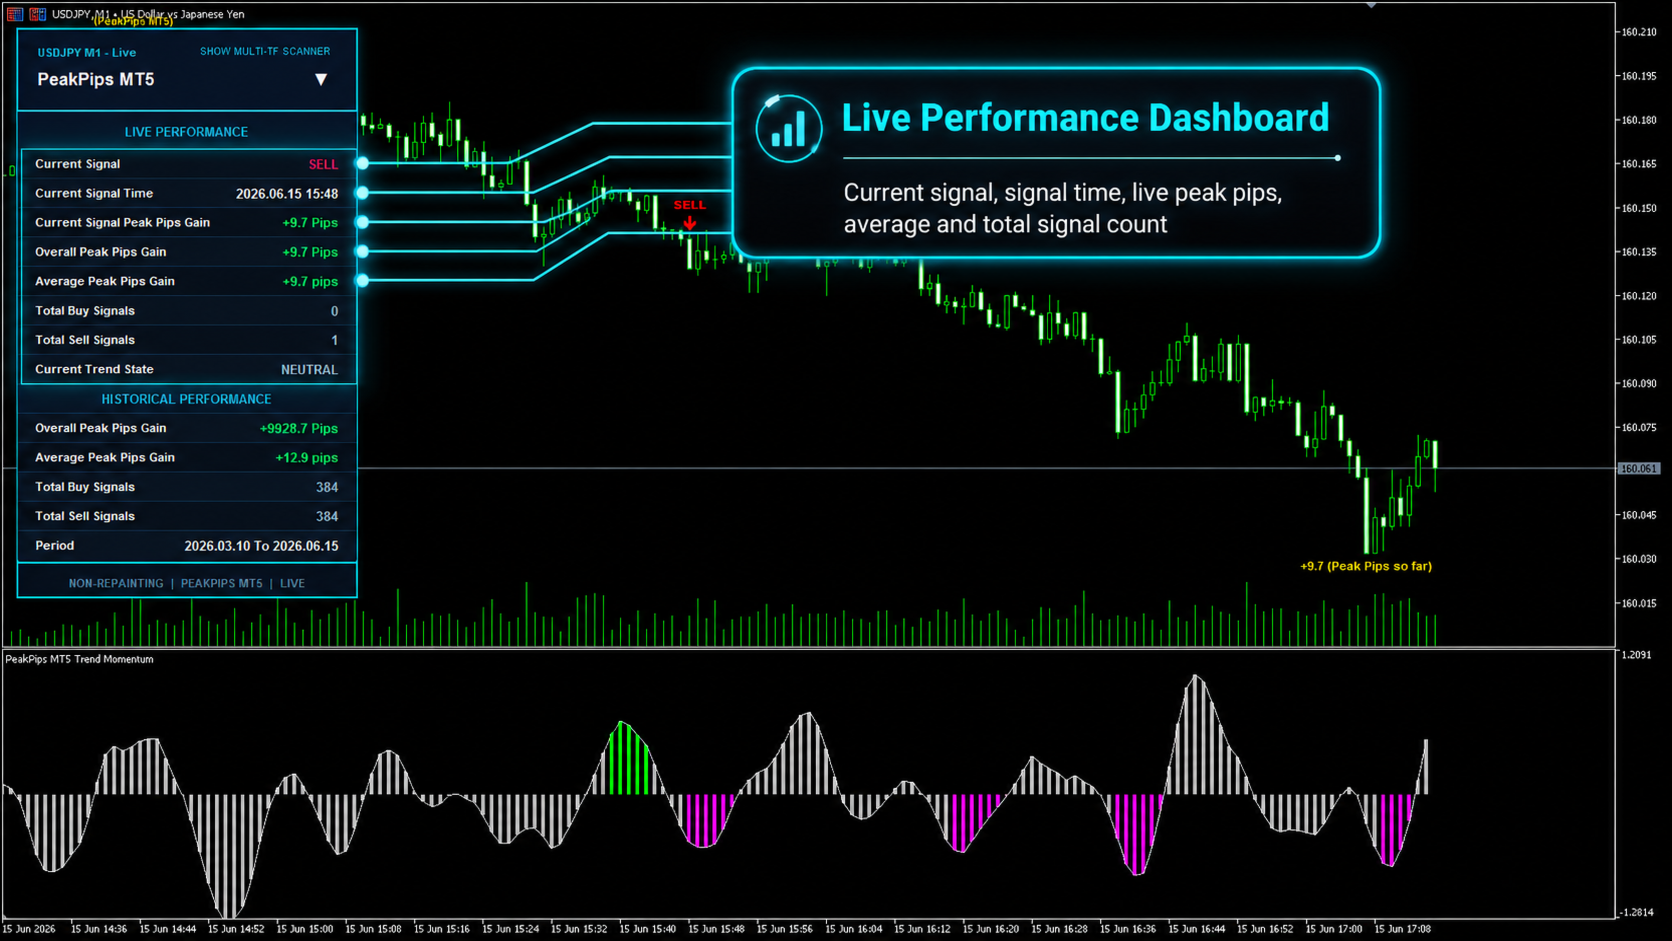
  1. Live Performance Dashboard: Displays the current chart signal, signal time, live peak-pips gain, overall peak-pips gain, average gain and total BUY and SELL signals.
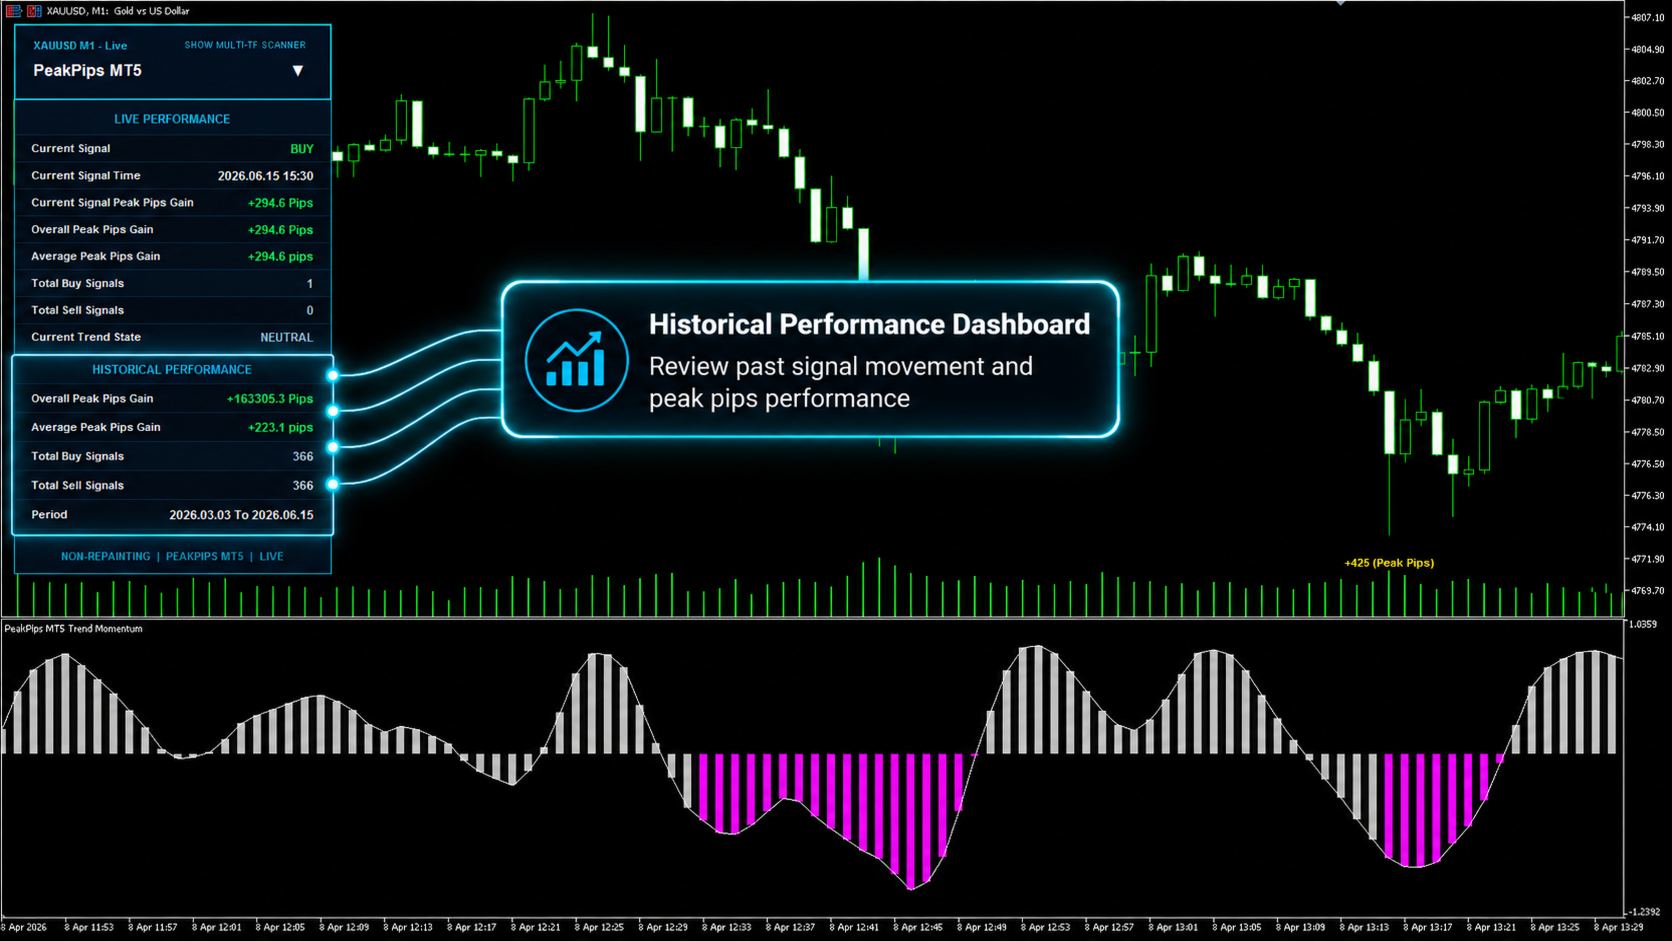
  2. Historical Performance Dashboard: Shows historical peak-pips performance, average movement, total BUY and SELL signals and the selected analysis period.
  3. Multi-Timeframe Scanner: Tracks selected markets and presents their current signal status, timeframe, signal time and peak-pips progress in one organized panel.

Markets and Timeframes

Peak Pips MT4 can be used across broker-supported instruments, including:

  • Forex pairs
  • Gold and other metals
  • Indices
  • Cryptocurrencies
  • CFDs and additional MT4 symbols

Suitable trading styles include:

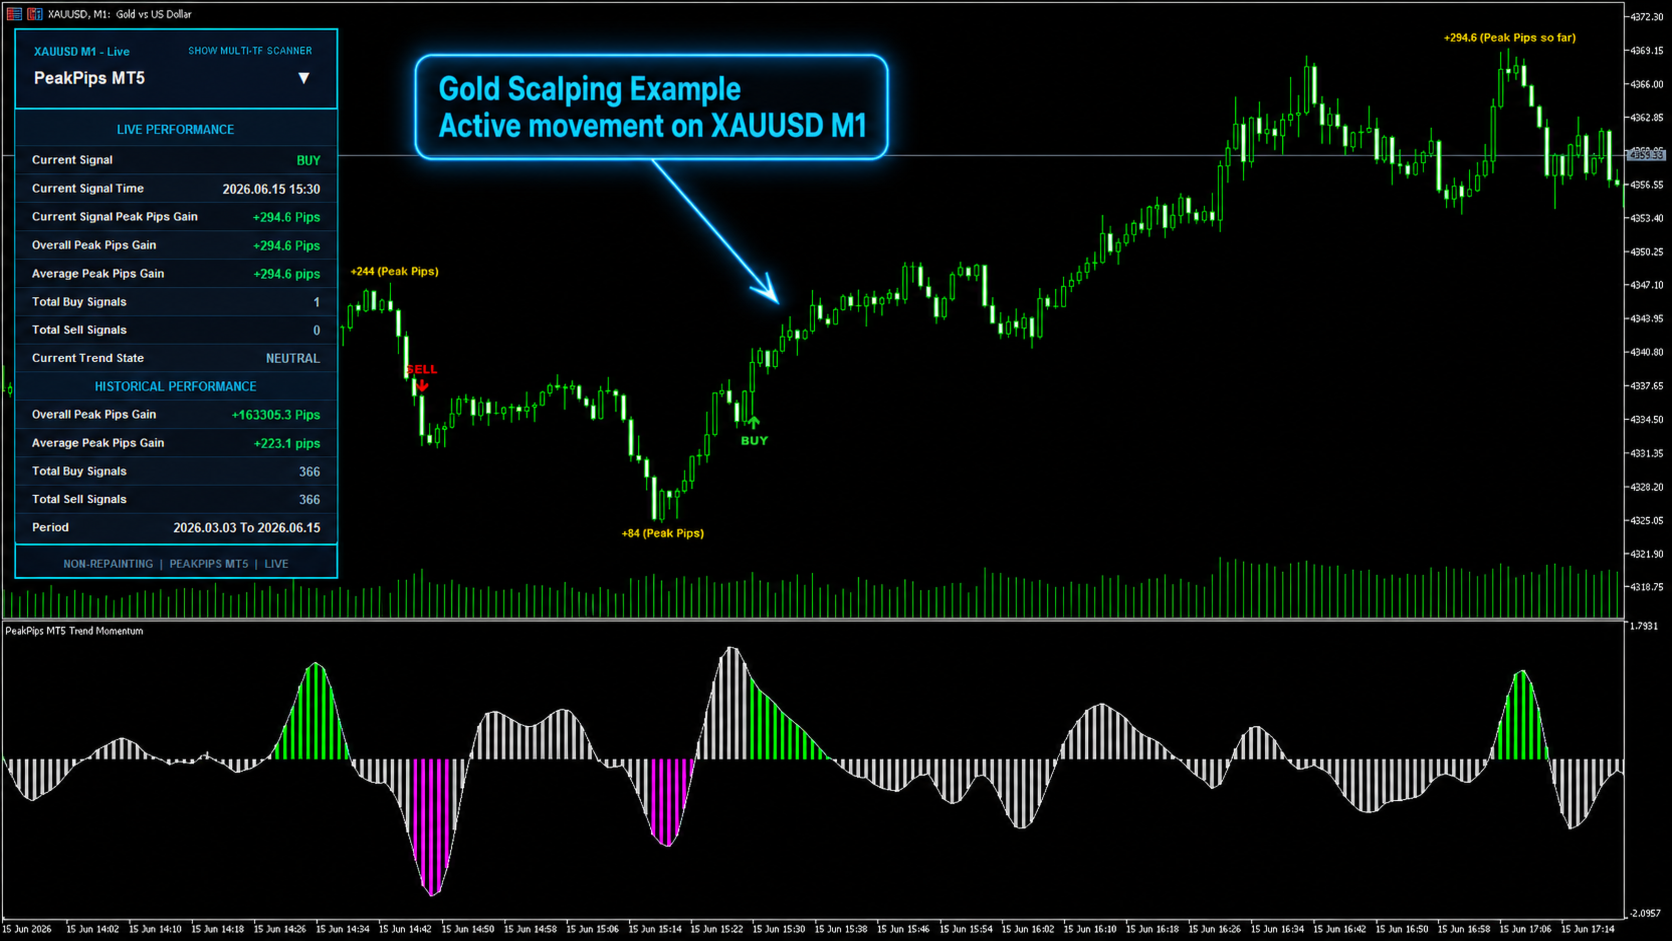
  • Scalping: M1, M5 and M15
  • Intraday trading: M15, M30 and H1
  • Swing trading: H1, H4 and D1
  • Trend following: M15 through D1 and higher
  • Short-term analysis: M5, M15, M30 and H1

The indicator supports M1, M5, M15, M30, H1, H4, D1 and higher timeframes.

Fast Chart Alerts

For the fastest chart-based alerts:

  1. Open the required symbol chart.
  2. Attach Peak Pips MT4.
  3. Set Enable Multi-TF Scanner Alerts to false.
  4. Set Chart Signal Alerts > Popup Alert to true.

Alert behavior can also be customized through popup, push, email and sound notification settings.

Flexible Settings

  • PeakPips Visuals: Adjust chart colors, fonts, labels and visual elements.
  • Premium Panels: Customize panel size, position and appearance.
  • Multi-Timeframe Scanner: Choose symbols, timeframes and scanning speed.
  • Strategy Tester: Use dedicated settings for smoother and lighter backtesting.
  • Scanner Alerts: Enable popup, push or email notifications for scanner updates.
  • Chart Signal Alerts: Configure popup, push and sound alerts for the active chart.
  • Protected Engine Settings: The core signal logic remains fixed and hidden to protect the indicator's internal system.

Best Suited For Traders Who Want

  • Clear BUY and SELL signals
  • Confirmed zero-repainting behavior
  • Less manual chart switching
  • Multi-symbol and multi-timeframe monitoring
  • Live peak-pips tracking
  • Historical performance information
  • Customizable alerts and dashboards
  • A clean, organized MT4 trading workspace

Try the Free Demo

Use the free demo to test Peak Pips MT4 on your own symbols and timeframes. Review the signals, scanner, dashboards and peak-pips tracking before making your decision.

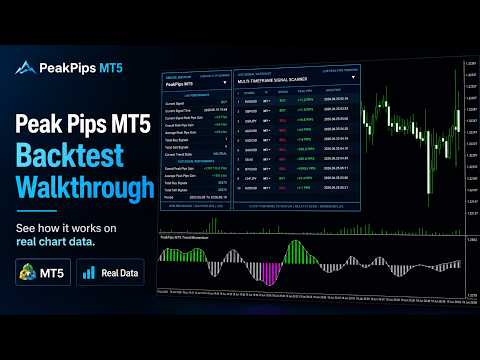
Screenshots and the demonstration video also show how the indicator presents live signals and performance information in real trading conditions.

MT5 Version

Looking for MetaTrader 5? The MetaTrader 5 version of this indicator is available to download from here.

Stay Updated

Join the MQL5 Channel for product updates and discounts:

Support

Questions about installation, settings or usage? Contact the seller directly:

Important Note

Peak Pips MT4 is a technical-analysis indicator. It does not place trades automatically and does not guarantee profits. Signals should be combined with personal analysis, suitable risk management and responsible trading decisions.
おすすめのプロダクト
XFibo Auto Fibonacci
Welinton Dos Reis Goncalves
5 (1)
Use with disciplined risk management. Fibonacci entry system based on the golden zone 38.2 - 61.8 where the entry is confirmed at 23.6 with indications of Take Profit 3:1. Automatically plotted Fibonacci contains retracement and expansion Fibonacci in a single indicator. Up to 77% win rate with this system. FTMO challenge pass with 0.50% risk and 1.50% R:R.
フィボナッチ・トレンド・マーカー (Fibonacci Trend Marker) は、現在のローソク足が過去のローソク足の高値-安値(High-Low、HL)範囲に対してどのように振る舞うかを、フィボナッチ・リトレースメントレベルを用いて分析するトレンド指標です。トレンドの強さを視覚的に追跡し、ローソク足の色の変化を通じてトレンドの弱まりや反転の可能性を示します。 特徴: トレンド重視のトレーダーのために設計されており、フィボナッチレベルに基づいてトレンドの変化を素早く検出します。 市場のボラティリティが十分で、3~5本のローソク足が明確な動きを形成する場合、あらゆる時間枠で有効です。 ローソク足のサイズはチャートのスケールに自動的に適応し、ズーム時にも正確な表示を保証します。 現在のローソク足をリアルタイムで分析することでトレンド変化に高い感度を持ち、M1やM5の時間枠でのスキャルピングに最適です。 取引方法: エントリー: 前の閉じたローソク足の色が変化した後にポジションを開きます。例えば、赤いローソク足の後に青で閉じた場合、上昇トレンドのシグナルとなり、買い(Buy)の取引
Channels + S & R Indicator (CSRI) Indicator draws 3 channels (Large, Medium, Small) within bars’ range of current timeframe and pair / instrument. It can identify Support and Resistance levels within any chosen channel. Additionally Fibonacci levels can be drawn for Large Channel. All lines and levels can be customized by color and width. Identify Support and Resistance Levels for any Channel: IdentifySupportAndResistanceLevels - Identify Support and Resistance Levels IdentifySRforChannel – Ide
NO REPAINT ADVANCED CHART PATTERN INDICATOR By definition, a price ( chart)  pattern is a recognizable configuration of price movement that is identified using a series of  trendlines  and/or curves. When a price pattern signals a change in trend direction, it is known as a reversal pattern; a continuation pattern occurs when the trend continues in its existing direction following a brief pause. Advanced Chart Pattern Tracker is designed to find the MOST ACCURATE patterns. A special script is a
Neuro Poseidon is a new indicator by Daria Rezueva. It combines precise trading signals with adaptive TP/SL levels - creating best possible trades as a result! Message me and get  Neuro Poseidon Assistant  as a gift to automize your trading process! What makes it stand out? 1. Proven profitability on all assets and timeframes 2. Only confirmed BUY and SELL signals present on the chart 3. Adaptive TP & SL levels generated by the software for each trade 4. Easy to understand - suitable for all
The indicator is activated at the beginning of each week and detects both bullish and bearish ORDERBLOCK potentials. These levels are of high operational probability, being able to use a minimum ratio of 3 to 1 to maximize profits. It is recommended to use pending orders at the OB levels of the chart and place the SL up to a maximum of 20 pips from the entry price. Submit the indicator to Backtesting to become familiar with its performance and complement it with other trend or oscillation type
This is a simple and efficient indicator based on market logic. The indicator creates a range chosen by a trader. Trader selects only two parameters. The first one is the number of candles that define the frame. The second one is the number of candles needed for confirmation frame. The indicator shows all situations in history and works with the actual movement of the market. The indicator works on all timeframes . You are not limited by use of different timeframes, the indicator is able to adap
Deep Analyst Expert Advisor    (mt5  https://www.mql5.com/en/market/product/163998 ) Deep Analyst   is a professional analytical tool powered by a specialized algorithm designed for deep analysis of market cycles and price amplitude fluctuations. By analyzing market conditions over a specific timeframe, the Expert Advisor determines price strength and amplitude using a unique indicator system based exclusively on real-time data. When the global trend and its vector shift, the algorithm automati
The Grid Inside
Luiz Octavio Vidal Lacerda De Godoy
5 (1)
The Grid Inside works on a counter trend mode, automatically opens a new order when it hits the price target due to the Fibonacci levels at 23.6 and 73.6. If the price goes the wrong way it opens another order with a calculated lot and position. All the positions are closed when it reaches the target profit defined on settings. As TGI does not use stop loss, I don't recommend you put on your account more than you can afford to lose, the higher the timeframe safer it gets. Once an order is trigge
The Transition Trend indicator shows the points of potential market reversal. The indicator's smart algorithm detects the trend, filters out market noise and generates entry signals and exit levels. Simple, visual and efficient trend detection. Uses just one parameter for settings. The indicator does not redraw and does not lag. You can set up message alerts as sound or email. Works on all currency pairs and all timeframes. Ready-made trading system.
MetaTrader 5用スマートピボットポイント — スマートな取引のための明確なレベル スマートピボットポイントは、MetaTrader 5用のプロフェッショナルインジケーターです。チャート上に主要な取引レベルを自動計算し、表示します。混沌とした価格変動を、明確な構造化されたマップに変換し、サポート、レジスタンス、価格バランス、そして潜在的なターゲットゾーンをハイライトします。明瞭性を重視するトレーダーのために設計されたこのツールは、FX、仮想通貨(ビットコイン、イーサリアム)、株価指数、株式、コモディティ(XAUUSD)など、あらゆる市場で機能します。 このインジケーターは、計算時間を節約し、分析に客観性をもたらす、信頼できる分析アシスタントです。市場シグナルを提供したり、代わりに意思決定を行うわけではありませんが、情報に基づいた独自の取引判断のための高品質な情報基盤を提供します。 主な機能とメリット すぐに使える価格座標システム:もう手動でレベルを描く必要はありません。中心レベル(バランス)、サポート、レジスタンス、買いターゲット、売りターゲットの5本の明確なラインがチャ
In the context of trading,   Malaysia SNR   (Support and Resistance) refers to the technical analysis of   support and resistance levels   in financial markets, particularly for stocks, indices, or other assets traded. There are three type of Malaysia SNR level Classic , GAP and Flipped 1. Classic Support   is the price level at which an asset tends to stop falling and may start to rebound. It acts as a "floor" where demand is strong enough to prevent the price from dropping further. Resistance
Introducing the Accumulated RSI,  your ultimate tool for precise trend identification and momentum analysis in the world of Forex and financial markets. This cutting-edge MetaTrader 4 (MT4) indicator, designed for traders seeking unparalleled insight and accuracy, empowers you to make well-informed trading decisions like never before. Features Accurate Trend Detection: The Accumulated RSI utilizes the Relative Strength Index (RSI) in an innovative way to pinpoint the prevailing market trends wit
Scalper Terminal インターフェイス ソフトウェアはインジケーターであり、自動売買取引には関与しません。 このインジケーターは、スキャルピング取引機会が発生したときに取引を開始できる現在の取引ゾーンを示します。 スキャルピング シグナルがある場合、関連する取引ペアの右側にターコイズ色のライトが点灯し、その上に正確な取引方向が表示されます。 その後、「ターコイズ」ボタンをクリックしてトランザクションを入力します。 新しいタブが開きます。 その後、ローソク足の終値が予想され、これがスキャルピング取引に参加するための条件となります。 Scalper Terminal でスキャルピング取引取引を成功させるため; 説明セクションにあるビデオを必ずご覧ください。 兵士のように Scalper Terminal ソフトウェアに固執します。 各取引ペアの右側には、5M、15M、および DIRECTION 列があります。 まず、「通知」ボタンをクリックして緑色にします。 常に画面を見続ける必要はありません。 ターコイズ色の光信号またはメタトレーダー警告メッセージ音が鳴るのを待ってくだ
このインジケーターは実践的なトレードに最適な自動波動分析のインジケーターです! 場合... 注:   Tang Lun (Tang Zhong Shuo Zen) の命名規則の影響で、私は波のグレーディングに西洋の名前を使用することに慣れていません。基本的な波を ペン 、二次波のバンドを セグメント と名付けました。同時に、 セグメント にはトレンドの方向が指定されます (この命名方法は将来のノートで使用されます。最初に言っておきます)。ただし、アルゴリズムは曲がりくねった理論とはほとんど関係がないため、付けるべきではありません。これは、私の市場分析 によって要約された、絶えず変化する複雑な運用ルール を反映しています。 バンドは標準化され、人によって異なることがないよう定義されており、市場参入を厳密に分析する上で重要な役割を果たす人為的な干渉の描画方法が排除されています。 このインジケーターを使用することは、取引インターフェイスの美しさを改善することと同等であり、元の K ライン取引を放棄し、取引の新しいレベルに連れて行きます。また、宣伝の観点から顧客の認識も向上します。 イ
My indicator is 1000%, it never repaints, it works in every time period, there is only 1 variable, it sends notifications to your phone even if you are on vacation instead of at work, in a meeting, and there is also a robot version of this indicator With a single indicator you can get rid of indicator garbage It is especially suitable for scalping in the m1 and m5 time frames on the gold chart, and you can see long trends in the h1 time frame.
The indicator is triggered at the start of each trading day and detects both bullish and bearish ORDERBLOCK potentials. These levels are of high operational probability, being able to use a minimum ratio of 3 to 1 to maximize profits. It is recommended to use TimeFrame M5 to M30 for a proper display and consider pending orders at the OB levels of the chart and place the SL up to a maximum of 20 pips from the entry price. Submit the indicator to Backtesting to become familiar with its performan
buy sell star indicator has a different algoritms then up down v6 and buy sell histogram indicators. so that i put this a another indicator on market. it is no repaint and all pairs and all time frame indicator. it need minimum 500 bars on charts. when  the white  x sign on the red histogram that is sell signals. when the white x sign on the blue  histogram that is sell signals. this indicator does not guarantie the win.price can make mowement on direction opposite the signals. this is multi tim
The indicator compares pattern found on chart history with the current price movement. Since history repeats itself, then, by comparing the two patterns, indicator can predict the further movement of the price. The indicator allows you to overlay highlighted history pattern with current movement and you will visually see this movement and will be able to compare the past and the present. To compare two patterns, you need: It is necessary to find and highlight a pattern on the history chart of a
Introduction This indicator detects volume spread patterns for buy and sell opportunity. The patterns include demand and supply patterns. You might use each pattern for trading. However, these patterns are best used to detect the demand zone (=accumulation area) and supply zone (=distribution area). Demand pattern indicates generally potential buying opportunity. Supply pattern indicates generally potential selling opportunity. These are the underlying patterns rather than direct price action. T
BALOGUN SMC ELITE — Professional Smart Money Concepts Indicator KEY FEATURES: Strict BUY/SELL Alternation — Only 1 BUY followed by 1 SELL (no signal spam) Non-Repainting Signals — Signals confirmed on closed bars only Zone-Limited NO TRADE Markers — Clear visual zones showing when NOT to trade Multi-Factor Confluence Scoring — 0-100% quality score per setup Professional Dashboard — Real-time trend, confluence, and signal status Multi-Channel Alerts — Popup, Push, Email, and S
Retracement Hunter This Indicator based on powerfull daily  levels . support and resistance, Buy / Sell entries which is more based on low risk  and high reward and winning ratio, Enter trade  when you get popup alert , book profit on target1, target 2, target3 levels, most of the trending days it will hit target3, but its always safe  to book partial at target1 or target2 Buy best entry when rule 1) look for Buy 2) Emas aligned less than 0.25 3) Main Ema aligned Buy , it will alert when all th
Harmonic Trading is now much easy than ever before with Harmonic Master Scanner Pro you can now scan time frames from 5m to 1w for 17 harmonic patterns on all bares at the same time. Harmonic Master Scanner Pro works based on original MetaTrader4 Zigzag indicator and the standard harmonic patterns elements. This software send alert and email to you when a harmonic pattern is detected on any charts. If you want the scanner to draw the pattern just switch the time frame to the alert time frame. Th
Fibonacci calculator is used with Elliot Waves, it can generate remarkable results. A trader could use these levels or ratios to find high probability trades with very small stop loss. You may also use these ratios to find Elliott Waves extensions and to book profit near those levels. For Elliot Wave experts, Fibonacci calculator is a highly useful tool that can assist them in calculating Fibonacci extension and retracement levels for the market price. The indicator proves itself as a useful one
Fibonacci colores
Carlos Augusto Cedeno Rocha
Fibonacci por color en niveles para aplicar estrategia profesional inicialmente se coloca en el punto mas alto del dia y mas bajo con esto es para ubicar operaciones a una distancia exacta con lo cual se busca generar ganancias residuales internas en el mismo dia con esto las lineas fusias es para colocar las entrdas sell y las lineas verdes amarillas van los buy
No idea why demo is not working. you can check the GIF to see how it works. Features With this scanner you can detect Candles which are below/above yesterday high/low lines. A pair's rectangle turns RED in dashboard if it is above the yesterday high, and rectangle turns GREEN in dashboard if it is below the yesterday low. It gives alerts in every 15m candle close. Contains a Dashboard which will help you to see all market pair's. It is possible to disable this sorting through to make it easier
This indicator draws Fibonacci level automatically from higher high to lower low or from lower low to higher high. With adjustable Fibonacci range and has an alert function. How to use Fibonacci Risk Reward Ration (R3) into trading strategy Forex traders use Fibonacci-R3 to pinpoint where to place orders for market entry, for taking profits and for stop-loss orders. Fibonacci levels are commonly used in forex trading to identify and trade off of support and resistance levels. Fibonacci retracem
Range Bot v2
Marcelo Jose Patino Vargas
1 (1)
Range Bot V2 es un sistema de trading automático diseñado especialmente para Indices Bursátiles americanos ( Us30, Us100 y Us500). Sistema capacitado para susperar challenges en cualquier compañia de fondeo que permita el uso de EAs ya que no es MG ni Grid. Tampoco es Tickscalp. Viene optimizado para US30 en horario NY. Modifique unicamente su riesgo porcentual por operacion
New York AM Session Profile NY AM Session Profiling Framework | Non-Repainting | Real-Time | FX & Index Presets | MT5 Version Available Full Setup Guide & Strategy Playbook: https://www.mql5.com/en/blogs/post/771380 MT5 Version: https://www.mql5.com/en/market/product/180798 Indicator Overview The New York AM Session Profile framework is a   professional market-structure visualization tool   designed for traders who study liquidity, session behaviour, and institutional price delivery. Instead
This indicator Super Channel Pro indicator.Indicator displays trend movement. Indicator calculates automatically line. Features FiltPer - displays indicator channel period. deviation - displays indicator channel deviation. deviation2 - displays indicator channel deviation. How to understand the status: If the arrow is green, trend is up. If the arrow is red, trend is down. ///////////////////////////////////////////////////////////////////////////////////////////////////////////////////////////
このプロダクトを購入した人は以下も購入しています
SR Liquidity は、市場の流動性が集中し、価格が最も強く反応する「隠れたゾーン」を可視化するために設計されたトレーディング指標です。こうした流動性の高いエリアは強力なサポート(支持)およびレジスタンス(抵抗)レベルとして機能し、市場が反転する可能性が最も高いポイントを明確に示してくれます。 単なる一般的なサポートラインやレジスタンスラインを描画するのではなく、「SR Liquidity」は実際の価格変動を分析し、売りと買いの圧力が集中するゾーンを特定します。これらは、市場の真の動きを牽引する「流動性のプール(溜まり場)」そのものです。それらをチャート上に直接可視化することで、価格が実際に反応する前に、その動きを予測することが可能になります。つまり、このインジケーターは価格の方向性が変わる可能性を予測するのです。生のプライスアクションを、市場の重要な水準(転換点となり得るポイント)を示す、明確で実用的なロードマップへと変換してくれます。 このインジケーターは、FX、株価指数、貴金属、仮想通貨など、あらゆる銘柄や時間足で使用可能です。 ご購入後、取引手順や無料の優れた追加インジケ
Trend SniperX MT4
Sarvarbek Abduvoxobov
5 (2)
Trend Sniper X は、トレーダーがトレンドの方向性と潜在的な反転ポイントを明確かつ正確に特定できるように設計された、MetaTrader 5 用のマルチタイムフレーム・トレンドフォロー指標です。 MT5版はこちら: https://www.mql5.com/en/market/product/181101 価格情報: 現在の価格はプロモーション価格であり、今後のアップデートや新機能の追加に伴い変更される場合があります。 Code2Profit チャンネル マルチタイムフレーム分析で市場をマスターしよう! Trend Sniper Xで勝率を最大化する方法:ルールとセッションのコツ 技術仕様 プラットフォーム MetaTrader 5 インジケータータイプ マルチタイムフレーム・トレンドインジケーター 動作タイムフレーム すべてのチャート時間足(上位足M1~MN1を独立して選択可能) 主要対象銘柄 為替(Forex)、ゴールド(XAUUSD)、その他のCFD 推奨口座 すべての口座タイプ ビジュアル表示 トレンドカラーローソク足(買い/売り/弱い/変化)+ 買い/売りシグナル
M1 Sniper
Oleg Rodin
4.97 (29)
M1 SNIPER は使いやすいトレーディングインジケーターシステムです。M1時間足向けに設計された矢印インジケーターです。M1時間足でのスキャルピングのためのスタンドアロンシステムとして、また既存のトレーディングシステムの一部としても使用できます。このトレーディングシステムはM1時間足での取引に特化して設計されていますが、他の時間足でも使用できます。元々、この手法はXAUUSDとBTCUSDの取引用に設計しましたが、他の市場においても役立つと考えています。 インジケーターのシグナルは、トレンドの方向と逆方向に取引できます。インジケーターのシグナルを利用して両方向に取引するのに役立つ特別な取引テクニックをご紹介します。この手法は、特別な動的なサポートとレジスタンスの価格帯を利用することに基づいています。 ご購入後、M1 SNIPER矢印インジケーターをすぐにダウンロードできます。さらに、M1 SNIPERツールのすべてのユーザーに、以下のスクリーンショットに表示されているApollo Dynamic SRインジケーターを無料で提供しています。この2つのインジケーターを組み合わせることで
現在30%OFF! 初心者やエキスパートトレーダーのためのベストソリューション! このダッシュボードソフトウェアは、28の通貨ペアで動作しています。それは私達の主要な指標(高度な通貨の強さ28と高度な通貨インパルス)の2に基づいています。それは全体の外国為替市場の大きい概観を与えます。それは、すべての(9)時間枠で28の外国為替ペアのための高度な通貨の強さの値、通貨の動きの速度と信号を示しています。チャート上で1つのインディケータを使用して市場全体を観察し、トレンドやスキャルピングの機会をピンポイントで見つけることができたら、あなたのトレードがどのように改善されるか想像してみてください。 このインディケータには、強い通貨と弱い通貨の識別、潜在的な取引の識別と確認がより簡単になるような機能が搭載されています。このインディケータは、通貨の強さや弱さが増加しているか減少しているか、また、すべての時間枠でどのように機能しているかをグラフィカルに表示します。 新機能として、現在の市場環境の変化に適応するダイナミックなマーケットフィボナッチレベルが追加され、すでに当社のAdvanced
DayTrader PRO MT5:  https://www.mql5.com/en/market/product/186222 DayTrader PROは、ジョン・エリュース(John Ehlers)のラグuerreフィルターと強力な自動最適化エンジンを組み合わせた、高度なトレーディング・インジケーターです。固定されたパラメーターを使用するのではなく、直近の市場状況に基づいて最適な設定を自動的に検索するため、手動による絶え間ない調整をすることなく、変化する市場のボラティリティに適応できます。 本インジケーターは、明確な「買い(BUY)」および「売り(SELL)」シグナルを生成し、現在の市場ボラティリティから算出された適応型のストップロス(Stop Loss)およびテイクプロフィット(Take Profit)レベルを表示します。トレンド、効率レシオ(Efficiency Ratio)、ボラティリティ、およびローソク足フィルターが内蔵されており、精度の低いセットアップを排除し、シグナルの精度を向上させます。 リアルタイム・パフォーマンスパネルには、現在最適化されている設定、プロフィッ
通貨強さウィザードは、取引を成功させるためのオールインワン ソリューションを提供する非常に強力な指標です。このインジケーターは、複数の時間枠のすべての通貨のデータを使用して、このまたはその外国為替ペアのパワーを計算します。このデータは、使いやすい通貨インデックスと通貨パワーラインの形式で表され、特定の通貨のパワーを確認するために使用できます。 必要なのは、取引したいチャートにインジケーターを接続することだけです。インジケーターは、取引する通貨の実際の強さを示します。このインジケーターは、トレンドに合わせて取引するときに有利に利用できる売買高の圧力の極値も示します。このインジケーターには、フィボナッチに基づく可能なターゲットも表示されます。 このインジケーターは、PUSH 通知を含むあらゆるタイプのアラートを提供します。 購入後ご連絡下さい。私の取引のヒントをあなたと共有し、素晴らしいボーナスインジケーターを無料で提供します! 幸せで有益な取引をお祈りします。
トレンドトレーディング は、タイミングのプルバックとブレイクアウトにより、市場で起こっているトレンドから可能な限り利益を得るように設計された指標です。確立されたトレンドの中で価格が何をしているかを分析することにより、取引の機会を見つけます。 [ インストールガイド | 更新ガイド | トラブルシューティング | よくある質問 | すべての製品 ] 自信を持って効率的に金融市場を取引する むち打ちにならずに確立されたトレンドから利益を得る 収益性の高いプルバック、ブレイクアウト、早期の逆転を認識する この指標は、独自の品質とパフォーマンスを分析します 複数時間枠のダッシュボードを実装します インジケーターは再描画されていません 電子メール/音声/視覚アラートを実装します 確立されたトレンドは多くの取引機会を提供しますが、ほとんどのトレンド指標はそれらを完全に無視しています。インジケーターの解釈はかなり簡単です: (1) トレンドの変化 (2) トレンドの方向への後退 (3) トレンドの方向へのブレイクアウト 赤いダッシュ は下降トレンド中の修正です 青いダッシュ は上昇トレンド中
この製品は 2026 年の市場向けに更新され、最新の MT5 ビルドに最適化されています。 価格更新のお知らせ: Smart Trend Trading System は現在 $99 で提供されています。 次の 30 件の購入 後、価格は $199 に上がります。 特別オファー: Smart Trend Trading System を購入後、私にプライベートメッセージを送ることで、 Smart Universal EA を無料 で受け取り、Smart Trend のシグナルを自動売買に変えることができます。 Smart Trend Trading System は、リペイントなし、再描画なし、遅延なしの完全なトレーディングシステムです。よりクリーンなシグナル、より明確なトレンド方向、そしてより整理された取引方法を求めるトレーダー向けに作られています。 Online course , manual and [download presets] . このシステムは、トレンド検出、反転ゾーン、Smart Cloud、トレーリングストップロジック、サポートとレジスタンス、ローソク足の色分け
現在20%OFF! 初心者やエキスパートトレーダーに最適なソリューションです。 このインディケータは、エキゾチックペア・コモディティ・インデックス・先物など、あらゆるシンボルの通貨の強さを表示することに特化したインディケータです。金、銀、原油、DAX、US30、MXN、TRY、CNHなどの通貨の強さを表示するために、9行目にどのシンボルでも追加することができます。独自の機能を多数搭載し、新しい計算式を採用したため、ユニークで高品質、かつ手頃な価格のトレーディングツールとなっています。新しいトレンドやスキャルピングチャンスのトリガーポイントを正確に把握することができるため、あなたのトレードがどのように改善されるか想像してみてください。 ユーザーマニュアル:ここをクリック   https://www.mql5.com/en/blogs/post/708876 すべての時間枠に対応します。あなたはすぐにトレンドを見ることができるようになります! 新しいアルゴリズムに基づいて設計されているため、潜在的な取引の特定と確認がより簡単になります。これは、8つの主要通貨と1つのシンボルの強弱
All-in-One Trade Indicator (AOTI) は、14種類の通貨ペアの日次目標レベルを自動的に算出し、あらゆる取引銘柄に対応するテクニカル分析ツールを1つのウィンドウに統合します。トレンド判定のための Double Channel、Price Channel、MA Bands、Climax Bars 検出機能、フィボナッチレベル、サポート・レジスタンスのマイクロレベル、矢印による反転シグナルを搭載しています。MetaTrader 4 プラットフォームで動作します。 日次レベルは、EURUSD、EURJPY、GBPUSD、USDCHF、EURGBP、EURCAD、EURAUD、AUDJPY、GBPAUD、GBPCAD、GBPCHF、GBPJPY、AUDUSD、および USDJPY に対して算出されます。その他のすべてのモジュールは、あらゆる取引銘柄で使用できます。 購入後、無料の AOTI-EA-Assistant を受け取るには、私に直接ご連絡ください。これは補助型の Expert Advisor(EA)であり、AOTI の日次レベルに基づく Simplest L
Gann Made Easy は、ミスター・ギャンの理論を使用した取引の最良の原則に基づいた、プロフェッショナルで使いやすい外国為替取引システムです。 W・D・ガン。このインジケーターは、ストップロスとテイクプロフィットレベルを含む正確な買いと売りのシグナルを提供します。 PUSH通知を利用して外出先でも取引可能です。 ご購入後、取引方法の説明と優れた追加インジケーターを無料で入手するには、私にご連絡ください! おそらく、ギャンの取引手法についてはすでに何度も聞いたことがあるでしょう。通常、ギャンの理論は初心者のトレーダーだけでなく、すでにある程度の取引経験がある人にとっても非常に複雑なものです。なぜなら、ギャンの取引手法は理論的にはそれほど簡単に適用できるものではないからです。私はその知識を磨き、最良の原則を私の外国為替インジケーターに組み込むために数年を費やしました。 このインジケーターは非常に簡単に適用できます。必要なのは、それをチャートに添付し、簡単な取引推奨事項に従うだけです。このインジケーターは常に市場分析の仕事を行い、取引の機会を探します。適切なエントリーポイントを検出す
Price & Time Market Structure Indicator A professional market structure tool that analyzes waves through both price and time — not price alone. Main Description NeoWave PRO is a professional market structure indicator for MetaTrader 4 designed for traders who want to move beyond traditional one-dimensional wave tools such as ZigZag, swing indicators, and basic high/low systems. Most wave indicators analyze only one thing: Price. But a real market wave is not only a price movement. A true wave de
CRT Candle Range Theory HTF MT4.   Ultimate CRT Indicator: Advanced ICT Concepts and Malaysian SnR Trading System Master the Market Maker's Footprints with the Most Advanced Candle Range Theory Indicator Unlock the true power of  Smart Money Concepts (SMC)  and trade precisely like the institutions with the  Ultimate CRT Indicator . Built exclusively for serious traders, this indicator automates the highly effective  Candle Range Theory (CRT) , a core pillar of  ICT Concepts (Inner Circle Trader
PRO Renko Systemは、特別にRENKOチャートを取引するために設計された高精度の取引システムです。 これは、様々な取引商品に適用することができる普遍的なシステムです。 システムは効果的に正確な逆転信号へのアクセスを与えるいわゆる市場の騒音を中和する。 表示器は非常に使いやすく、信号の生成に責任がある1つの変数だけがあります。 あなたは簡単にお好みの任意の取引ツールとレンコバーのサイズにツールを適応させることができます。 私はいつもあなたが私のソフトウェアで収益性の高い取引を支援するために余分なサポートを提供する準備ができています! 私はあなたに幸せで収益性の高い取引をしたいです! ご購入後にご連絡ください! 私はあなたに私のレンコチャートジェネレータを送信します。 私はまた、私の個人的な推奨事項やシステムの他のモジュールを無料で共有します!
このインディケータは、異なる期間のフラクタルの価格構造を調べて、市場で起こり得る反転ポイントを決定し、すでに基本的または技術的な評価モデルを持っているポジショントレーダーにタイミングを提供します。弟の リバーサルフラクタル とは異なり、このインジケーターは選択された期間のためにリバーサルを逃すことはなく、ジグザグ形式でリバーサルフラクタルを見つけます。 [ インストールガイド | 更新ガイド | トラブルシューティング | よくある質問 | すべての製品 ] ターニングポイントは長いトレンドを開始できます インジケーターは再描画されていません あらゆる種類のアラートを実装します カスタマイズ可能な色とサイズ フラクタルは奇数番目のバーのフォーメーションであり、フォーメーションの最上位または最下位の中間バーであり、フラクタル内のすべてのバーが閉じるとインディケーターが描画されるため、このインジケーターはリアクティブまたは遅れ信号です。ただし、既存の方向バイアスを持つトレーダーは、この指標が非常に有用であり、早期のエントリポイントを取得します。 このインディケーターは、ボイルダウンされた
Reversal Master は、現在の値動きの方向を読み取り、チャート上で反転が起きそうなポイントを見つけるのに役立ちます。エントリーを決める前に相場状況をよりはっきり把握したいトレーダー向けです。単体のツールとして、既存の売買システムへの追加として、あるいは自作ストラテジーの土台として使えます。 反転ポイントを見つけるため、Reversal Master は複数の相場条件を同時に評価します。単一の要素だけよりも、組み合わせて見るほうが全体像がはっきりするからです。指標は Price Action のパターン、出来高、その銘柄の平均的な値幅、買われすぎ/売られすぎの水準を分析し、反転が形成されつつある地点をマークします。 購入後は直接ご連絡ください。例つきの詳しいガイドと、ご自身の EA で指標を正しく呼び出す方法をお渡しします。 主な機能 チャート上のトレンド反転ポイントの候補を自動で検出します。 2つの動作モードを内蔵:Mode-1(クラシックなアルゴリズム)と Mode-2(新しい反転検出アルゴリズム)。 統計機能を内蔵:ヒストリー上で各ポジションの潜在的な結果を表示します(
このインジケーターは、反転ポイントと価格戻りゾーンを正確に表示します。     主要プレーヤー 。新たなトレンドが形成される場所を把握し、最大限の精度で意思決定を行い、すべての取引をコントロールします。 TREND LINES PRO インジケーターと組み合わせることで、その潜在能力を最大限に発揮します。 VERSION MT5 インジケーターが示す内容: 新しいトレンドの始まりに活性化する反転構造と反転レベル。 リスクと報酬の比率を最小限に抑えた利益 確定 と 損失停止の レベルの表示     RR 1:2   。 インテリジェントな削減ロジックによるストップロス。 指定されたインジケーターから 2 つのトレンド タイプの反転パターンを表示します。 指標: トレンドを追う   TREND LINES PRO   (世界的なトレンドの変化) TREND PRO   (クイックトレンド変更) シンプルで効果的   スキャナー   リアルタイムトレンド(新機能)。 マルチタイムフレームのインストゥルメント フィルタリング。 画面   利益     LOGIC AI信号の後。 当日プラス方
Oversold and Overbought Candles, Trendlines, and BUY-SELL arrows in the single Indicator. Built from 8 default MT4 Indicators. Stochastic,RSI,SAR,CCI,RVI,DeMarker,WPR and MA. It is " NON REPAINT " indicator. All buffers do not repaint.  Double Trendline buffers that can also be used to identify sideway market and support resistance area.  Any timeframes and any currency pairs. Parameters: Show Trend . TRUE/FALSE to show trendlines on the chart Follow Trend. If TRUE , Dapitrend will show only
ボリューム ブレイク オシレーターは、オシレーターの形で価格変動とボリューム トレンドを一致させるインジケーターです。 私はボリューム分析を戦略に統合したいと思っていましたが、OBV、マネー フロー インデックス、A/D、ボリューム加重 Macd など、ほとんどのボリューム インジケーターにいつもがっかりしていました。 そのため、このインジケーターを自分で作成し、その有用性に満足したので、市場に公開することにしました。 主な機能: ボリュームの増加 (ブレイク) によってサポートされる方向に価格が動くフェーズを強調します。 ボリュームの増加が止まり、市場が縮小するフェーズを強調します。 特に時間枠 (<=15 分) のデイトレードでは、価格もボリュームも動かないため、市場が将来の動きに備えられるフェーズを強調します。 ボリュームの増加によってサポートされていない場合、他のエキスパート アドバイザーからの誤ったシグナルをフィルターします。 トレンドとレンジ フェーズを非常に簡単に視覚化できます 入力パラメーター: 計算設定: 計算タイプ: FAST、NORMAL、SLOW。同じ
お気に入りのインジケーターで、すべての銘柄とすべての時間軸を1つのチャートから監視できます。Ultimate Indicator Dashboardは、マルチ銘柄・マルチインジケーター・マルチ時間軸のビューをすべて1つのすっきりとしたドラッグ可能なパネルにまとめて提供します。 チャートを切り替える手間はもう不要です。RSI、MACD、Bollinger Bands、Ichimoku、ATR、ボリュームなど、すべての銘柄を一目で確認できます。カラーコードされたシグナルが機会のある場所を正確に示し、スマートアラートが条件の変化をお知らせするので、セットアップを見逃すことはありません。 ダッシュボードにないインジケーターを使用していますか? メッセージを送る と、追加できるか確認します! === トレーダーがこのダッシュボードを愛する理由 === • 1つのチャートで最大30銘柄・8インジケーターを同時に表示 • 各列は独立して設定可能 — 任意のインジケーターを任意の時間軸で選択 • カラーコードされたセルが強気・弱気・買われすぎ・売られすぎの状態を即座にハイライト • セルごと・列ごと
Advanced Supply Demand
Bernhard Schweigert
4.91 (302)
現在30%オフ 初心者にもエキスパートトレーダーにも最適なソリューション このインジケーターは独自の機能と新しい公式を多数内蔵しており、ユニークで高品質かつ手頃な取引ツールです。このアップデートでは、2つの時間枠ゾーンを表示できるようになります。より長いTFだけでなく、チャートTFとより長いTF(ネストゾーンを表示)の両方を表示できます。すべてのSupply Demandトレーダーの皆さんのお気に召すはずです。:) 重要情報の公開 Advanced Supply Demandの可能性を最大化するには、 https://www.mql5.com/ja/blogs/post/720245 にアクセスしてください。   エントリーまたはターゲットの正確なトリガーポイントを正確に特定できれば取引がどのように改善されるか想像してみてください。新しい基盤となるアルゴリズムに基づいて構築されているため、買い手と売り手の間の潜在的な不均衡をさらに簡単に特定できます。これは、最も強い需要と供給のゾーンと、過去のパフォーマンス(古いゾーンを表示)がグラフィカルに表現されるためです。これらの機能は、最適な
BlueDigitsFx公式エコシステムへのアクセス インフラ更新情報、トレーディングリソース、製品リリース情報、およびBlueDigitsFx公式エコシステムへのアクセスを取得できます。 Telegramエコシステム ウェブサイト MT5版 BlueDigitsFx Easy 123 System — MT4向け高性能な反転・ブレイクアウト検出システム 市場の反転とブレイクアウトを見つけるためのオールインワン非リペイントシステム — 構造的な分析、明確なシグナル、確認ベースのトレードを重視するトレーダー向けに開発されています。 BlueDigitsFx Easy 123 Systemは、MT4向けのビジュアルインジケーターおよびアラートシステムであり、市場構造の変化、ブレイクアウト、トレンド反転をシンプルかつ明確に識別するのに役立ちます。 このインジケーターは、構造化された「123」パターンに基づいて動作します。 ステップ 1 :潜在的な相場の失速ポイントで大きな矢印を表示し、新高値または新安値を識別します。 ステップ 2 :市場構造のブレイクを検出し、トレンド反転の可能性を確
M1 アロー スキャルピング - M1 期間のシグナルを表示し、エントリ ポイントを再描画せず、すべての主要通貨ペア + 金属 (金/銀) で機能します。この指標は、価格パターンを決定するためのアルゴリズムを使用して市場を分析し、チャート上の価格反転ポイントをトレーダーに示します。赤い点は価格が下がることを示し、青い点は価格が上がることを示します。インジケーターは、PUSH 通知の形式で信号も電話に送信します。したがって、24 時間 PC の近くに座る必要はありません。あなたはあなたのビジネスに取り掛かることができますが、価格の逆転の瞬間があると、インジケーターはあなたの電話に通知を送信します.このようなインジケーターは、インターネット上で無料で見つけることはできません。異なる通貨ペアでの指標シグナルの精度は 71 ~ 94% です。このインジケーターは M1 期間で機能しますが、H1 や H4 などの大きな期間で取引する場合、インジケーターはそれらのシグナルもよく示します。 インジケーターの利点: 91 から 94% の通貨ペアに応じたシグナルの精度 その信号を再描画しません M
The Storm Prices indicator is trendy, arrow family. It is easy to work and understand when the first red arrow appears, you need to buy, when the first blue arrow appears, sell. The indicator is used for scalping and pipsing. The indicator makes calculations based on several technical indicators. Determines the direction of the trend and gives a fairly clear indication of the position. The indicator allows you to determine the opportunities for entering the market for a short time. There is a sw
TPSproTrend PRO     これは、市場を自動的に分析し、トレンドとその変化に関する情報を提供するとともに、取引のエントリーポイントを表示するトレンド指標です。     描き直しなしで!       新バージョン     トレンドラインズPRO       ―侵入点検出アルゴリズムの改善、信号フィルタリングの追加、および視覚化機能の更新。 説明書(ロシア語)       -   説明書     英語       -     MT5 VERSION 主なメリット 再描画なしで信号を送信する。     すべての信号は固定されています。 矢印が表示された場合 -         それはもう変化したり消滅したりすることはないだろう。 誤ったシグナルのリスクなしに、安定したデータに基づいて取引判断を行うことができます。 既成の売買エントリーポイント このインジケーターは、取引を開始する最適なタイミングを自動的に判断し、チャート上に矢印で表示します。 推測や主観的な分析は一切不要。明確なシグナルのみ。 自動ストップロスおよびテイクプロフィットゾーン 信号の直後に表示されるもの:
KURAMA GOLD SIGNAL PRO MT4版 ゴールドのサインに、目で見えるトレード計画を。 ゴールドのサインが出た。利確はどこか。損切りはどこか。エントリー前に何を確認すべきか。 KURAMA GOLD SIGNAL PROは、その判断材料をチャートに集約します。XAUUSDのM5、M15向けに、売買サイン、自動計算TP/SL、3段階のサイン評価、注意すべき相場条件を知らせるMARKETパネルを搭載。 セットアップ、決済目安、相場の注意点を一か所で確認。情報を集める手間を減らし、トレードの判断に集中できます。 買い切り購入者限定特典 AI Zone Radar MT5版と完全PDFマニュアルを無料プレゼント。 ご購入後にMQL5でメッセージをお送りください。買い切り購入が対象です。レンタルは対象外です。 AI Zone Radarを見る サインから、具体的なトレード計画へ SMA 13、21、75、100へのタッチを使ったセットアップを検出。各サインに売買方向と対象MAを表示するため、浅い押し目、戻りと深い調整を区別して確認できます。 チャートとパネルには、次の情報を表示し
Prop Firm Sniper MT4  is a professional market structure indicator that automatically identifies high-probability BUY and SELL opportunities using BOS and CHoCH analysis. Recommended Timeframes: For backtesting, use the indicator on   M5 or M15   for Gold (XAUUSD), and   M15 or H1   for more volatile Forex pairs such as   GBPUSD, USDJPY, EURGBP , and similar markets. CONTACT ME AFTER PURCHASE TO CLAIM YOUR FREE BONUSES! Prop Firm Sniper  is a professional market structure indicator designed t
Dynamic Forex28 Navigator - 次世代の Forex 取引ツール。 現在 49% オフ。 Dynamic Forex28 Navigator は、長年人気のインジケーターを進化させたもので、3 つの機能を 1 つにまとめています。 Advanced Currency Strength28 インジケーター (レビュー 695 件)  + Advanced Currency IMPULSE with ALERT (レビュー 520 件) + CS28 コンボ シグナル (ボーナス)。 インジケーターの詳細 https://www.mql5.com/en/blogs/post/758844 次世代の Strength インジケーターが提供するもの  オリジナルで気に入っていたすべての機能が、新機能と精度の向上によって強化されました。 主な機能: 独自の通貨強度計算式。 すべての時間枠でスムーズかつ正確な強度ライン。 トレンドの特定と正確なエントリーに最適です。 ダイナミックマーケットフィボナッチレベル (マーケットフィボナッチ)。 このインジケーターに固有
Legacy of Gann
Pavel Zamoshnikov
4.83 (12)
The indicator very accurately determines the levels of the possible end of the trend and profit fixing. The method of determining levels is based on the ideas of W.D.Gann, using an algorithm developed by his follower Kirill Borovsky. Extremely high reliability of reaching levels (according to K. Borovsky  - 80-90%) Indispensable for any trading strategy – every trader needs to determine the exit point from the market! Precisely determines targets on any timeframes and any instruments (forex, met
Pinpoint は、 xauusd の正確な売買シグナルのために設計された、再描画せずに遅延することなく、非常に効率的な取引指標です。 この指標は、急速に変化する市場で、リアルタイムで、迅速かつ正確かつ視覚的なソリューションを必要とするトレーダーのために設計されています。 この指標は既製の取引戦略として機能します。 これは、組み込みのアルゴリズムに従って資産の価格の動作を分析し、理想的なエントリポイントを決定するだけでなく、利益をロックする場所を示しています。 潜在的な変化をより正確に識別するために、指標には、現在の市場の状況に応じて動的に調整するインテリジェントなトレンドラインツールが組み込まれています。 標準的なライン設定に従って: 緑-イニシアチブを購入します。 赤は販売イニシアチブです。 オレンジ-以前のイニシアチブを傍受することは可能です。 Pinpoint mt5 Pinpoint Blog Pinpoint にはさまざまなフィルタが含まれており、誤った信号を減らし、入力の品質を向上させるのに役立ちます。 デフォルトの設定は、 TF m15、m30、および1時間の
作者のその他のプロダクト
Gold Beast MT5
Sindhu Bairavim
5 (2)
GOLD BEAST MT5 EA Gold Beast MT5はXAUUSDのために開発された自動取引EAです。 ローンチ成功 : 39米ドルの最初の10本はすぐに完売しました! 現在、第2バッチを販売中です。 89ドルでの販売は残り4本(全5本)のみです。次の価格: 149ドル。 EAを1つのXAUUSD H1チャートに適用し、正しいSETファイルを読み込み、自動売買(AutoTrading)をオンにして、MT5を接続したままにしてください。 EAはエントリー、リカバリートレード、ロットサイズ設定、バスケット利益目標、保護ルール、および決済を処理します。 SETファイル 推奨されるSETファイルを 提供されたリンク からダウンロードし、開始点として使用してください。 1. チャート設定 シンボル : XAUUSD / GOLD 時間足 : H1 EA : Gold Beast MT5 - 1つのXAUUSD H1チャートを開き、Gold Beast MT5を適用します。 - 複数のチャートや時間足でEAを稼働させる必要はありません。 以下をアクティブに保ってください: - MT5の
Peak Pips MT5 Zero-Repainting Trend Signals, Peak-Pips Tracking and Multi-Timeframe Scanning Peak Pips MT5 is a powerful trend-analysis indicator designed to help traders identify fresh BUY and SELL opportunities for scalping, intraday and swing trading, all from one chart. Backed by 23 years of testing with Dukascopy 100% tick data, the indicator combines a protected signal algorithm, confirmed zero-repainting signals, live peak-pips tracking and a built-in multi-timeframe scanner in one trader
Ninja X3 MT5 EA Special Launch Offer: Only 9 copies left at 39 USD. Once this limit is reached, the price will increase to 89 USD. Ninja X3 MT5 is an Expert Advisor developed specifically for USDJPY on the H1 timeframe. The strategy focuses on identifying structured market opportunities using dynamic support and resistance, trend direction and price confirmation before allowing an entry. A selective automated USDJPY trading system designed for traders who prefer controlled trade frequency rather
Avatar Fibo MT5 EA Special Launch Offer: Only 9 copies left at 39 USD. Once this limit is reached, the price will increase to 89 USD. Avatar Fibo MT5 is an Expert Advisor developed specifically for XAUUSD on the M15 timeframe . Fibonacci retracement is widely used in trading, but the difficult part is deciding which retracement zone, confirmation method, and market condition should actually qualify as an entry. Three independent Fibonacci retracement strategies combined into one automated Gold t
Live Risk Dashboard MT4 EA Monitor your account risk clearly and trade within your limits Live Risk Dashboard MT4 EA is a practical account-monitoring utility for MetaTrader 4. It displays your most important trading and risk information directly on the chart, helping remove the "math anxiety" of managing open positions. Instead of repeatedly checking different MT4 windows or manually calculating floating profit, drawdown usage, and remaining limits, you can view everything in one clean, compact
FREE
Wyckoff Phase Matrix Pro MT5 Wyckoff Phase Analysis, Trade Levels and Performance Statistics in One Dashboard Wyckoff Phase Matrix Pro MT5 is a structured market-analysis indicator that brings Wyckoff phase reading, setup bias, Entry/TP/SL levels, win-rate data, statistics and an equity curve into one clean MetaTrader 5 dashboard. It is designed to help traders understand current market structure more clearly, reduce chart-reading confusion and plan trades with defined levels instead of relying
Live Risk Dashboard MT5 EA Monitor your account risk clearly and trade within your limits Live Risk Dashboard MT5 EA is a practical account-monitoring utility for MetaTrader 5. It displays your most important trading and risk information directly on the chart, helping remove the "math anxiety" of managing open positions. Instead of repeatedly checking different MT5 windows or manually calculating floating profit, drawdown usage, and remaining limits, you can view everything in one clean, compact
FREE
Wyckoff Phase Matrix Pro MT4 Wyckoff Phase Analysis, Trade Levels and Performance Statistics in One Dashboard Wyckoff Phase Matrix Pro MT4 is a structured market-analysis indicator that brings Wyckoff phase reading, setup bias, Entry/TP/SL levels, win-rate data, statistics and an equity curve into one clean MetaTrader 5 dashboard. It is designed to help traders understand current market structure more clearly, reduce chart-reading confusion and plan trades with defined levels instead of relying
Fibonacci Pips MT4 Instant Fibonacci Levels, Prices and Pip Distances Fibonacci Pips MT4 is a practical Fibonacci measurement tool for MetaTrader 4. It displays each Fibonacci level together with its exact price and pip distance, helping traders plan pullbacks, profit targets and stop-loss levels without manual calculations. Instead of seeing only percentages such as 38.2%, 50.0% or 61.8%, traders can immediately understand: The Fibonacci level The exact market price The pip distance from the re

Session Clock MT4 Know Which Forex Session Is Active – Without Manual Time Calculations Session Clock MT4 is a clean trading-time dashboard for MetaTrader 4. It displays the four major Forex market sessions – Sydney, Tokyo, London, and New York – together with their opening times, closing times, live status, and the countdown to the next session. Forex market activity changes throughout the day. Some periods are quiet, while others bring faster price movement and higher volatility. Session Clock
Ninja X3 MT4 EA Special Launch Offer: Only 10 copies left at 39 USD. Once this limit is reached, the price will increase to 89 USD. Ninja X3 MT4 is an Expert Advisor developed specifically for USDJPY on the H1 timeframe. The strategy focuses on identifying structured market opportunities using dynamic support and resistance, trend direction and price confirmation before allowing an entry. A selective automated USDJPY trading system designed for traders who prefer controlled trade frequency rathe
Fibonacci Pips MT5 Instant Fibonacci Levels, Prices and Pip Distances Fibonacci Pips MT5 is a practical Fibonacci measurement tool for MetaTrader 5. It displays each Fibonacci level together with its exact price and pip distance, helping traders plan pullbacks, profit targets and stop-loss levels without manual calculations. Instead of seeing only percentages such as 38.2%, 50.0% or 61.8%, traders can immediately understand: The Fibonacci level The exact market price The pip distance from the re
Session Clock MT5 Know Which Forex Session Is Active – Without Manual Time Calculations Session Clock MT5 is a clean trading-time dashboard for MetaTrader 5. It displays the four major Forex market sessions–Sydney, Tokyo, London, and New York – together with their opening times, closing times, live status, and the countdown to the next session. Forex market activity changes throughout the day. Some periods are quiet, while others bring faster price movement and higher volatility. Session Clock M
フィルタ:
レビューなし
レビューに返信