PullBack Velocity Indicator

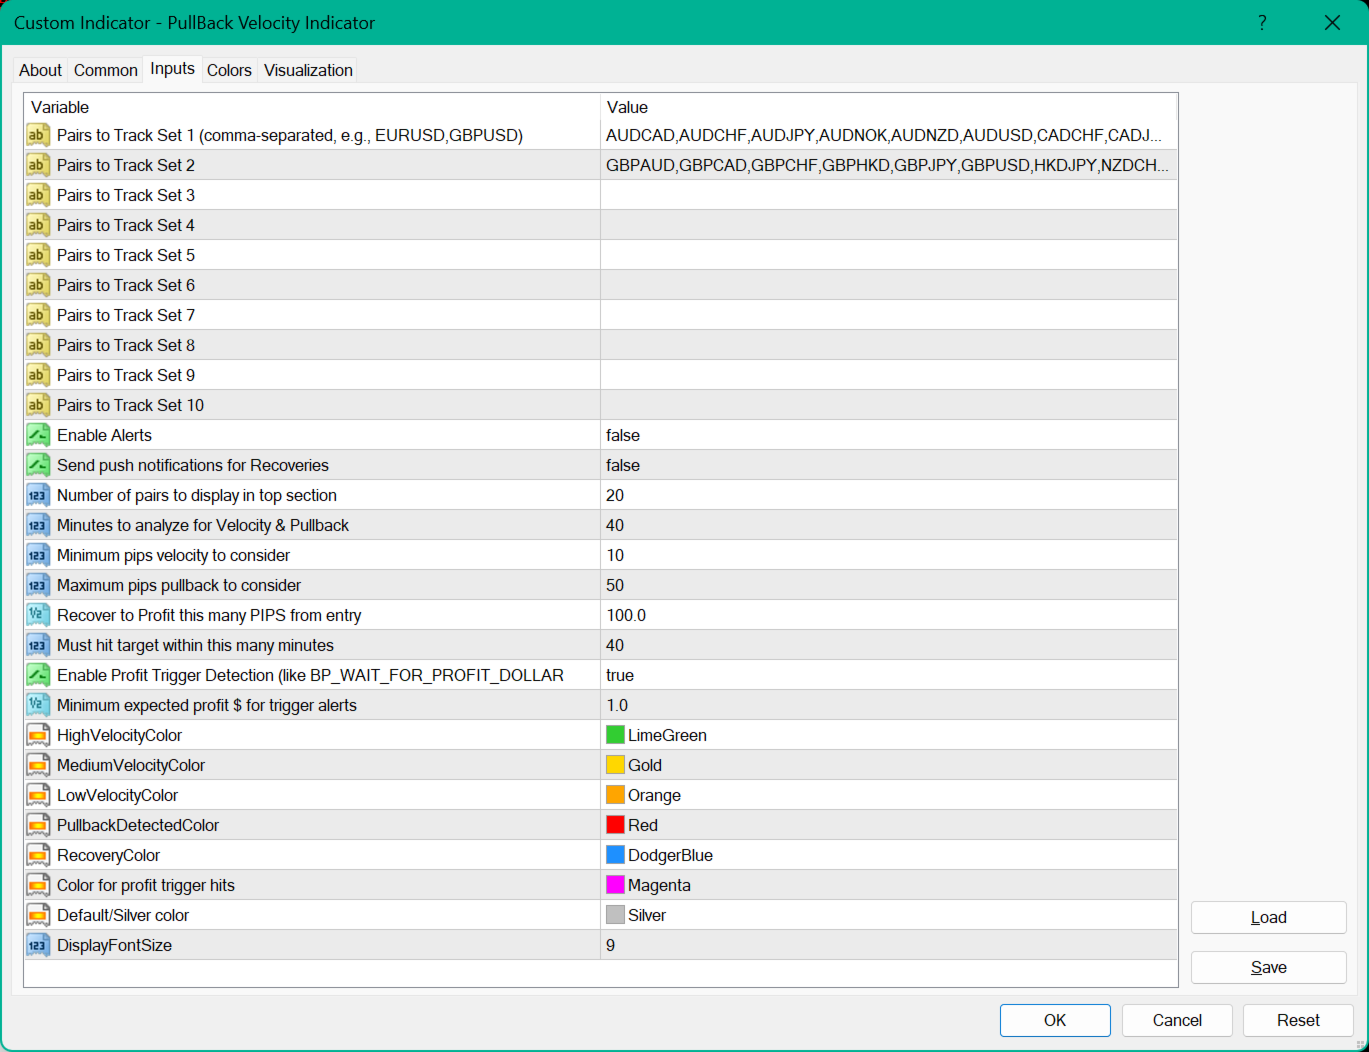
Turn market pullbacks into profitable recovery trades with the PullBack Velocity Indicator. This tool identifies when a currency pair is in a pullback phase and calculates its velocity to project potential recovery profits. By analyzing the depth and duration of a pullback against the pair's current momentum, the indicator provides a clear "Expected Profit" in pips and dollars, along with an estimated recovery time. It actively alerts you to "HIGH POTENTIAL RECOVERY" scenarios, giving you a quantifiable edge in mean-reversion and pullback trading.

Key Features:
Pullback Detection: Automatically identifies pullbacks from recent peaks (for long entries) and troughs (for short entries), measuring depth in pips and dollars.
Velocity Calculation: Measures price velocity in pips-per-minute and dollars-per-minute to gauge momentum.
Profit Projection Engine: Calculates expected profit for a recovery move based on pullback depth (Pips), velocity (Pips/min), and duration (minutes), using dynamic multipliers.
Real-time Status: Classifies each symbol's status as "PULLBACK ACTIVE," "RECOVERING," or "NO PULLBACK."
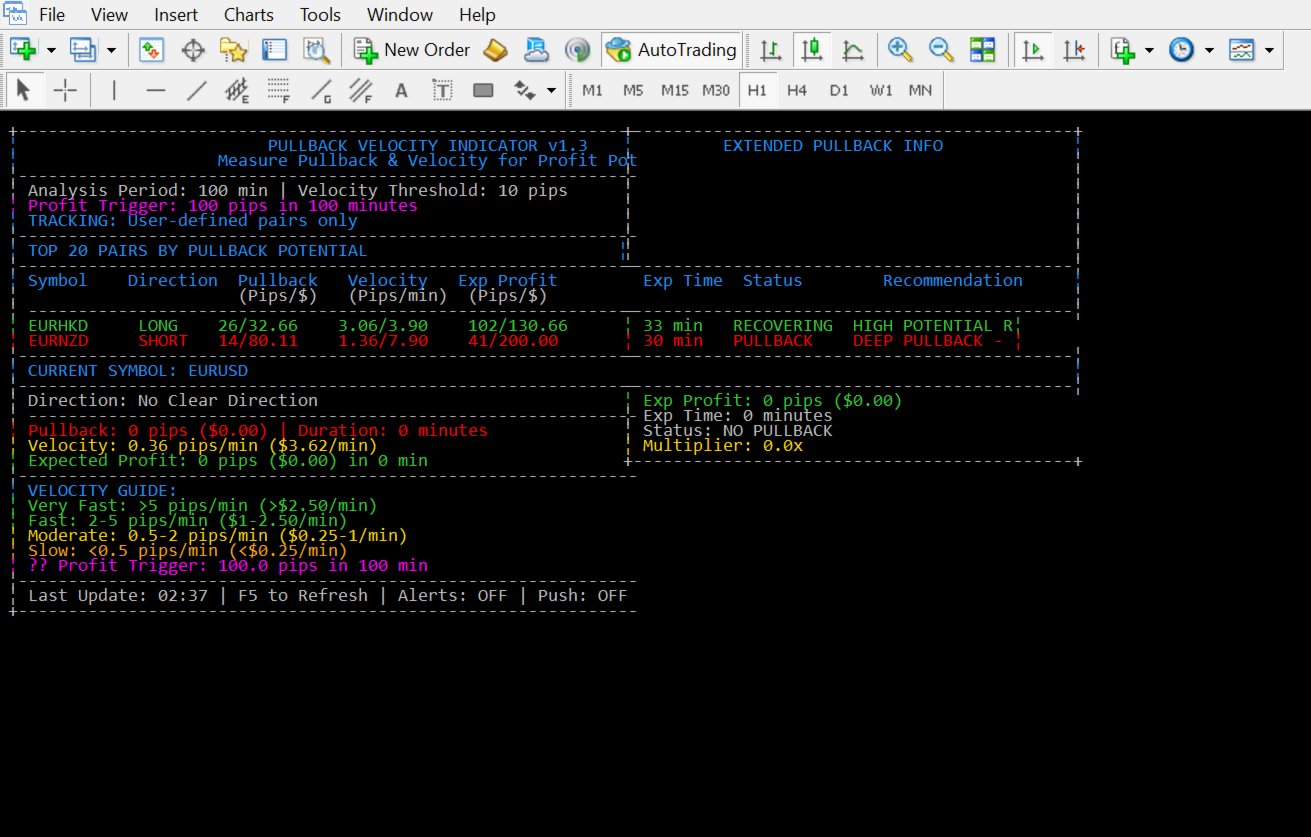
Visual Dashboard: A dual-column display shows top pairs by potential, including direction (LONG/SHORT), pullback stats, velocity, and expected profit.
Push Notifications & Alerts: Sends desktop alerts and mobile push notifications when a "HIGH POTENTIAL RECOVERY" is detected.

Effective Uses:
Mean-Reversion Entries: Use the indicator to find pullbacks within a trend. When the status changes to "RECOVERING," enter in the direction of the original trend.
Scaling In/Out: Add to existing positions during a healthy pullback, using the "Expected Profit" as a dynamic target for scaling out.
Risk/Reward Estimation: Before entering a pullback trade, check the `PullbackPips` (risk) vs. the `ExpectedProfitPips` (reward) to ensure a favorable ratio.
Alert-Driven Trading: Set up the indicator to run across multiple charts and receive notifications, so you never miss a high-probability recovery setup.
おすすめのプロダクト
Introducing the Range Predictor : Your Ultimate Guide to Future Trading Ranges! Imagine having the power to see into the future of market moves— Range Predictor brings this dream to life. Designed to deliver real-time, predictive support and resistance levels , this tool goes beyond standard indicators, offering trend direction insights and precise range forecasts . Whether you're a day trader or a swing trader, the Range Predictor is your all-in-one toolkit for mastering the markets. MT5 Ver
This unique multi-currency strategy simultaneously determines the strength of trends and market entry points, visualizing this using histograms on the chart. The indicator is optimally adapted for trading on the timeframes М5, М15, М30, Н1. For the convenience of users, the indicator renders the entry point (in the form of an arrow), recommended take profit levels (TP1, TP2 with text labels) and the recommended Stop Loss level. The take profit levels (TP1, TP2) are automatically calculated for
El indicador "MR BEAST ALERTAS DE LIQUIDEZ" es una herramienta avanzada diseñada para proporcionar señales y alertas sobre la liquidez del mercado basándose en una serie de indicadores técnicos y análisis de tendencias. Ideal para traders que buscan oportunidades de trading en función de la dinámica de precios y los niveles de volatilidad, este indicador ofrece una visualización clara y detallada en la ventana del gráfico de MetaTrader. Características Principales: Canal ATR Adaptativo: Calcula
VR Cub
Vladimir Pastushak
VR Cub は、質の高いエントリーポイントを獲得するためのインジケーターです。このインジケーターは、数学的計算を容易にし、ポジションへのエントリーポイントの検索を簡素化するために開発されました。このインジケーターが作成されたトレーディング戦略は、長年にわたってその有効性が証明されてきました。取引戦略のシンプルさはその大きな利点であり、初心者のトレーダーでもうまく取引することができます。 VR Cub はポジション開始ポイントとテイクプロフィットとストップロスのターゲットレベルを計算し、効率と使いやすさを大幅に向上させます。取引の簡単なルールを理解するには、以下の戦略を使用した取引のスクリーンショットを見てください。 設定、設定ファイル、デモ版、説明書、問題解決方法は、以下から入手できます。 [ブログ] レビューを読んだり書いたりすることができます。 [リンク] のバージョン [MetaTrader 5] エントリーポイントの計算ルール ポジションをオープンする エントリーポイントを計算するには、VR Cub ツールを最後の高値から最後の安値までストレッチする必要があります。 最初
Forex Gump
Andrey Kozak
2.4 (5)
Forex Gump is a fully finished semi-automatic trading system. In the form of arrows, signals are displayed on the screen for opening and closing deals. All you need is to follow the instructions of the indicator. When the indicator shows a blue arrow, you need to open a buy order. When the indicator shows a red arrow, you need to open a sell order. Close orders when the indicator draws a yellow cross. In order to get the most effective result, we recommend using the timeframes H1, H4, D1. There
WPR by Profile, or WPR for Professionals Geo_WprPro is one of the well-known currency profile indicators. It simultaneously displays two WPR indicators with different parameters in the matrix form on all timeframes of multiple currency pairs forming the currency profile . As follows from the description, " WPR is a leading indicator that often goes ahead of the price chart. The oscillator frequently reaches extreme values before the price reversal as if anticipating that event: it almost always
プロトレーダーおよび評価型アカウント(Prop)向けリスク管理・制限監視インジケーター 本ツールは、リスク管理と各種リミットに関する情報をチャート上に表示するのみで、より集中した意思決定をサポートします。インジケーターはポジションの新規/決済/変更を行わず、エキスパートアドバイザー(EA)と干渉しません. 機能 日次および累計ドローダウンの監視 残高(Balance)または有効証拠金(Equity)を基準に日次/累計DDを計算・表示(設定可能)。 設定したリミットまでの残り割合を表示。 チャート上のクリーンでプロフェッショナルなパネル サマリー表:Balance、Equity、現在のP/L、日次/累計DD、アラート閾値。 判断に集中できる読みやすいUI。 リスクに基づくポジションサイズ パーセンテージ/固定金額のリスクと設定したストップロスに基づき概算ロットを算出。 R:R(リスクリワード)比とエントリー、SL、TPをチャートに表示。 アラートと通知 日次/累計DDの閾値に近づいた際にアラート(閾値は設定可能)。 価格がSL/TPに到達、またはその他の定義済みイベント発生時に通知。
需給ゾーンの主要価格指標 背景 システムはKライン上の需要と供給の領域を自動的に検索し、リアルタイムの主要価格ラインを描画します。トレーダーは価格取引ラインに基づいて取引を行うことができます。 主な特徴 システムはKライン内の供給エリアと需要エリアを自動的に検索します。このシステムはリアルタイムの主要価格ラインも描画し、トレーダーは価格取引ラインに基づいて取引を行うことができます。したがって、需要と供給ゾーン戦略を使用するトレーダーは、需要と供給エリアの兆候を探すのに時間を費やす必要がなくなります。代わりに、需要と供給の領域と主要な価格に対する価格の反応に焦点を当て、自分に合った取引戦略を立てることができます。 ただし、需給ゾーン戦略自体はボラティリティが高い時期に効果を発揮する戦略であるため、市場が強いトレンドを示している場合には注意して使用するか、インジケーターが提供する示唆をトレンドの方向に活用する必要があります。 範囲 ShowZones: 供給ゾーンと需要ゾーンを表示するかどうか DrawLines: 主要価格を表示するかどうか SupplyZoneLineColor:
Reversal Pattern AI is a groundbreaking advancement in indicator development, combining artificial intelligence algorithms, multi-level market analysis, and classical technical analysis methods. It not only detects reversal patterns but also evaluates market inefficiencies, generating highly accurate trading signals.Thanks to its hybrid model, which utilizes price action analysis, volume, volatility, VWAP, and Volume AVG %, the indicator easily adapts to any market conditions. Reversal Pattern A
これは、従来のMACDよりも正確で使いやすいユニークなMACD指標です。 それはあらゆるチャートサイクルに適しており、あらゆる市場の種類に適しています。 赤い列は(Buy)バンドの信号、青い列は(Sell)バンドの信号です。 黄色と緑色の線は傾向線で、2本の線は交差しません。 購入する:青い列で、真ん中の0軸を通る緑色の線を見てください。 売り:赤い列で、真ん中の0軸の下の黄色い線を見てください。 MACDの形態信号からの偏差は99%正確です。 購入フォームからの逸脱:バンドの価格がバンドより低く、インディケータのインデックスがますます高くなっていますこの場合、すぐに買い注文をすることができます。 売りからの逸脱:バンドの価格がバンドより高く、インディケータのインデックスが小さくなってきているこの場合、売りシングルはすぐに実行できます。 注:指標の五芒星は、価格の変動により変化します。
PipFinite Exit EDGE
Karlo Wilson Vendiola
4.83 (115)
Did You Have A Profitable Trade But Suddenly Reversed? In a solid strategy, exiting a trade is equally important as entering. Exit EDGE helps maximize your current trade profit and avoid turning winning trades to losers. Never Miss An Exit Signal Again Monitor all pairs and timeframes in just 1 chart www.mql5.com/en/blogs/post/726558 How To Trade You can close your open trades as soon as you receive a signal Close your Buy orders if you receive an Exit Buy Signal. Close your Sell orders if
Quantum Falcon Signal Free is a smart visual trading indicator for MetaTrader 4 designed for Forex and Gold traders. The indicator combines: • Trend analysis • RSI momentum confirmation • MACD momentum filtering • ATR volatility filtering • Higher timeframe confirmation • Smart exit signal detection Main Features: • Smart Buy and Sell signals • Exit Buy / Exit Sell alerts • Real-time dashboard on chart • Professional candle arrows • Multi-timeframe trend confirmation • ATR market volatility filt
FREE
Borders Arrow Signals MT4 The Ultimate Non-Repainting Smart Arrow Trading Indicator Borders Arrow Signals MT4 is a professional-grade MetaTrader 4 indicator designed for traders who demand precision, reliability, and high-probability trade entries. Built for the MT4 trading platform, it delivers intelligent Buy and Sell signals based on advanced market analysis while maintaining exceptional speed and efficiency. Unlike conventional arrow indicators that repaint historical signals and create fals
This product is a part of  ON Trade Waves Patterns Harmonic Elliot Wolfe you can test free version on EURJPY from this link  Wolf Waves Indicator ウルフウェーブを発見しよう - あなたの究極の取引ツール! どんな時間軸でも簡単にウルフウェーブを見つけるための強力なツールを探していますか?もう探す必要はありません!私たちのウルフウェーブインジケーターは、その仕事を簡単にこなします。なぜこのインジケーターがあなたにぴったりか、以下でご紹介します。 主な特徴: 自動検出: ウルフウェーブインジケーターは、複雑なアルゴリズムを使用して、チャート上のキーポイントを自動的に見つけ、対応するラインを描画します。手動でパターンを探す手間が不要です。 使いやすさ: このインジケーターはシンプルなデザインで、経験豊富なトレーダーからウルフウェーブ初心者まで、誰でも簡単に利用できます。 高精度: 数多くのウルフウェーブインジケーターの中で、当社のものは完璧さの
The Smart Strategy Indicator is a trading system that allows you to analyze the market in terms of several aspects of technical analysis. The first of them is a price channel, which is built automatically and allows the trader to see the main direction of price movement. It also makes it possible to analyze the market using a channel strategy (breakout and rebound from channel lines). Block 2 is the SAR system, which gives general information about the micro-movements in the market and this is
Gioteen Volatility Index (GVI)   - your ultimate solution to overcoming market unpredictability and maximizing trading opportunities. This revolutionary indicator helps you in lowering your losing trades due to choppy market movements. The GVI is designed to measure market volatility, providing you with valuable insights to identify the most favorable trading prospects. Its intuitive interface consists of a dynamic red line representing the volatility index, accompanied by blue line that indicat
AWキャンドルパターンインジケーターは、強力なキャンドルパターンスキャナーと組み合わせた高度なトレンドインジケーターの組み合わせです。これは、最も信頼性の高い30のローソク足パターンを認識して強調表示するための便利なツールです。さらに、それは色付きのバーに基づく現在の傾向分析器です。     サイズ変更と配置が可能なプラグインマルチタイムフレームトレンドパネル。トレンドフィルタリングに応じてパターンの表示を調整する独自の機能。 利点: キャンドルパターンを簡単に識別 結果を再描画しません 内蔵のマルチタイムトレンドパネル 無効なパターンタイプ(1、2、3キャンドル) パターン表示時のトレンドフィルタリングの調整 MT5 version - >   HERE   / Instructions and description  -> HERE 表示されるパターンのリスト: ハンマーパターン ピンアップ/ピンダウン 弱気なハラミ/強気なハラミ 弱気のハラミクロス/強気のハラミクロス ピボットポイント反転アップ/ピボットポイント反転ダウン ダブルバーローとハイクローズ/ダブルバーローとロークロ
The FFx Dashboard MTF alerter will show you on a single chart all the timeframes (M1 to Monthly) with their own status for the indicator. 2 Alert Options: Single timeframe: each selected timeframe alert separately when a signal occurs Multi timeframes: all selected timeframes must agree for an alert to be triggered Both options have an input to select the timeframes to be used for the alert(s). How to understand the status: Green/Red square: MA pointing Up/Down Green square + Red border: MA po
Price Magnet — Price Density and Attraction Levels Indicator Price Magnet is a professional analytical tool designed to identify key support and resistance levels based on statistical Price Density. The indicator analyzes a specified historical period and detects price levels where the market spent the most time. These zones act as “magnets,” attracting price action or forming a structural base for potential reversals. Unlike traditional Volume Profile tools, Price Magnet focuses on price-time d
フィボナッチリトレースと拡張ラインツール DiNapoliポイント取引方法とゴールデンセクション取引を使用するトレーダーにとって理想的なMT4プラットフォームのフィボナッチリトレースと拡張ラインツール 主な特長: あなたはフィボナッチリトレースメントの複数のセットを直接描くことができ、重要なリターンポイント間の関係は一目瞭然です。 2.フィボナッチ拡張を描画することができます。 3.フィボナッチフォールドバックとラインの延長は、簡単な観察と数値表示のために左右に動かすことができます。 4.チャートは非常に爽やかな 5.数字キーでサイクルを切り替えることができます。 ファンクションキー: 1。 [戻るを押す、要求に応じて描画する、最大8つのグループにする 2。拡張]を描くには[押す] 3。 \を押すと、現在のサイクルの下にあるすべての拡張機能と折り畳みが削除されます 4。フォールドバックを移動して削除して展開する (1)最初のフォールドバックセットのF5行をクリックします。 一度クリックすると(黄色に変わります)、キーボードのDeleteキーを押すと、フォーカ
フラットとトレンドを決定するための指標。 価格が2つのヒストグラムと2つの線(赤と青)のいずれかを下回っている場合、これは売りゾーンです。 このバージョンのインジケーターを購入するときは、1つの実際のアカウントと1つのデモアカウント用のMT4バージョン-ギフトとして(受け取るには、プライベートメッセージを書いてください)! 価格が2つのヒストグラムと2つの線(赤と青)のいずれかを上回っている場合、これは購入ゾーンです。 MT4バージョン: https//www.mql5.com/en/market/product/3793 価格が2つの線の間、またはいずれかのヒストグラムのゾーンにある場合、市場に明確な傾向はありません。簡単に言えば、市場は横ばいです。 インジケーターの動作は、スクリーンショットでより明確に示されています。
Indicator which identifies Trend and also buy/sell opportunities. Use for entries aligned to the Trend.  Although Diamond Trend is very accurate identifying entry points, it is always recommended to use a support indicator in order to reconfirm the operation. Remind to look for those Assets and Timeframes which best fit to your trader behavior/need... Valid for Scalping and Long Term operations. Please, set up a Bars Chart to be able to visualize the indicator properly...  ...And remind to give
MajorAlert - is a professional trading indicator for MetaTrader 4 that combines two distinct market analysis approaches into one powerful tool. By integrating a counter‑trend entry logic (upper block) with a trend‑following filter (lower block), the indicator generates high‑probability signals on the chart with clearly separated arrow colors. Key Features Fully self‑contained   – no external indicators required; all calculations are built‑in. Versatile inputs   – adjust all parameters to suit a
Noize Absorption Index - is the manual trading system that measures the difference of pressure between bears forces and bulls forces. Green line - is a noize free index that showing curent situation. Zero value of index shows totally choppy/flat market.Values above zero level shows how powerfull bullish wave is and values below zero measures bearish forces.Up arrow appears on bearish market when it's ready to reverse, dn arrow appears on weak bullish market, as a result of reverse expectation. S
PipFinite Breakout EDGE
Karlo Wilson Vendiola
4.93 (488)
The Missing Edge You Need To Catch Breakouts Like A Pro. Follow a step-by-step system that detects the most powerful breakouts! Discover market patterns that generate massive rewards based on a proven and tested strategy. Unlock Your Serious Edge Important information here www.mql5.com/en/blogs/post/723208 The Reliable Expert Advisor Version Automate Breakout EDGE signals using "EA Breakout EDGE" Click Here Have access to the game changing strategy that will take your trading to the next l
これはほぼ間違いなく、MetaTraderプラットフォームで見つけることができる最も完全な調和価格形成自動認識インジケーターです。 19種類のパターンを検出し、フィボナッチプロジェクションをあなたと同じように真剣に受け止め、潜在的逆転ゾーン(PRZ)を表示し、適切なストップロスとテイクプロフィットレベルを見つけます。 [ インストールガイド | 更新ガイド | トラブルシューティング | よくある質問 | すべての製品 ] 19の異なる調和価格形成を検出します プライマリ、派生および補完フィボナッチ投影(PRZ)をプロットします 過去の価格行動を評価し、過去のすべてのパターンを表示します この指標は、独自の品質とパフォーマンスを分析します 適切なストップロスとテイクプロフィットのレベルを表示します ブレイクアウトを使用して適切な取引を通知します すべてのパターン比をグラフにプロットします 電子メール/音声/視覚アラートを実装します スコット・M・カーニーの本に着想を得て、この指標は最も純粋で急を要するトレーダーのニーズを満たすように設計されています。ただし、トレードを容易にする
Stratos Pali
Michela Russo
4.43 (7)
Stratos Pali Indicator   is a revolutionary tool designed to enhance your trading strategy by accurately identifying market trends. This sophisticated indicator uses a unique algorithm to generate a complete histogram, which records when the trend is Long or Short. When a trend reversal occurs, an arrow appears, indicating the new direction of the trend. Important Information Revealed Leave a review and contact me via mql5 message to receive My Top 5 set files for Stratos Pali at no cost! Dow
Was: $249  Now: $99   Market Profile defines a number of day types that can help the trader to determine market behaviour. A key feature is the Value Area, representing the range of price action where 70% of trading took place. Understanding the Value Area can give traders valuable insight into market direction and establish the higher odds trade. It is an excellent addition to any system you may be using. Blahtech Limited presents their Market Profile indicator for the MetaTrader community. Ins
This indicator is another variant of the famous powerful indicator Fibonacci-SS https://www.mql5.com/en/market/product/10136 but has different behaviour in placing Pending Order and TP Line. Automatically places Fibonacci retracement lines from the last highest and lowest visible bars on the chart with: An auto Pending Order (Buy/Sell). Taking Profit 1, Taking Profit 2 is pivot point and Taking Profit 3 for extended reward opportunity. The best risk and reward ratio. Simple and powerful indicat
Crypto_Forex MT4用インジケーター「 RSI SPEED 」は、優れた予測ツールで、リペイント機能はありません。 - このインジケーターの計算は物理学の方程式に基づいています。RSI SPEEDはRSI自体の1次導関数です。 - RSI SPEEDは、主要トレンドの方向にスキャルピングエントリーするのに適しています。 - 適切なトレンドインジケーター(例えばHTF MA(画像参照)など)と組み合わせて使用​​してください。 - RSI SPEEDインジケーターは、R​​SI自体がどれだけ速く方向転換するかを示します。非常に敏感です。 - モメンタムトレード戦略にはRSI SPEEDインジケーターの使用をお勧めします。RSI SPEEDインジケーターの値が0未満の場合は価格モメンタムが下降し、RSI SPEEDインジケーターの値が0を超える場合は価格モメンタムが上昇します。 - インジケーターにはモバイルとPCのアラートが組み込まれています。 高品質のトレーディングロボットとインジケーターをご覧になるにはここをクリックしてください! これは、このMQL5ウェブサイトで
このプロダクトを購入した人は以下も購入しています
Neuro Poseidon is a new indicator by Daria Rezueva. It combines precise trading signals with adaptive TP/SL levels - creating best possible trades as a result! Message me and get  Neuro Poseidon Assistant  as a gift to automize your trading process! What makes it stand out? 1. Proven profitability on all assets and timeframes 2. Only confirmed BUY and SELL signals present on the chart 3. Adaptive TP & SL levels generated by the software for each trade 4. Easy to understand - suitable for all
I have been trading for some time now and always find it a difficulty remembering the timing of the various market opening hours at the other part of the world (especially, when it comes to daylight saving), but could not find any decent indicator online that could help. And it is for this reason that gives birth to this indicator, which I have spent much time, effort and thinking. As many already know that opening of a certain marketplace, depending on which currency pair, has an impact on the

このインジケーターは、反転ポイントと価格戻りゾーンを正確に表示します。     主要プレーヤー 。新たなトレンドが形成される場所を把握し、最大限の精度で意思決定を行い、すべての取引をコントロールします。 TREND LINES PRO インジケーターと組み合わせることで、その潜在能力を最大限に発揮します。 VERSION MT5 インジケーターが示す内容: 新しいトレンドの始まりに活性化する反転構造と反転レベル。 リスクと報酬の比率を最小限に抑えた利益 確定 と 損失停止の レベルの表示     RR 1:2   。 インテリジェントな削減ロジックによるストップロス。 指定されたインジケーターから 2 つのトレンド タイプの反転パターンを表示します。 指標: トレンドを追う   TREND LINES PRO   (世界的なトレンドの変化) TREND PRO   (クイックトレンド変更) シンプルで効果的   スキャナー   リアルタイムトレンド(新機能)。 マルチタイムフレームのインストゥルメント フィルタリング。 画面   利益     LOGIC AI信号の後。 当日プラス方
現在30%OFF! 初心者やエキスパートトレーダーのためのベストソリューション! このダッシュボードソフトウェアは、28の通貨ペアで動作しています。それは私達の主要な指標(高度な通貨の強さ28と高度な通貨インパルス)の2に基づいています。それは全体の外国為替市場の大きい概観を与えます。それは、すべての(9)時間枠で28の外国為替ペアのための高度な通貨の強さの値、通貨の動きの速度と信号を示しています。チャート上で1つのインディケータを使用して市場全体を観察し、トレンドやスキャルピングの機会をピンポイントで見つけることができたら、あなたのトレードがどのように改善されるか想像してみてください。 このインディケータには、強い通貨と弱い通貨の識別、潜在的な取引の識別と確認がより簡単になるような機能が搭載されています。このインディケータは、通貨の強さや弱さが増加しているか減少しているか、また、すべての時間枠でどのように機能しているかをグラフィカルに表示します。 新機能として、現在の市場環境の変化に適応するダイナミックなマーケットフィボナッチレベルが追加され、すでに当社のAdvanced
KURAMA GOLD SIGNAL PRO MT4版 ゴールドのサインに、目で見えるトレード計画を。 ゴールドのサインが出た。利確はどこか。損切りはどこか。エントリー前に何を確認すべきか。 KURAMA GOLD SIGNAL PROは、その判断材料をチャートに集約します。XAUUSDのM5、M15向けに、売買サイン、自動計算TP/SL、3段階のサイン評価、注意すべき相場条件を知らせるMARKETパネルを搭載。 セットアップ、決済目安、相場の注意点を一か所で確認。情報を集める手間を減らし、トレードの判断に集中できます。 買い切り購入者限定特典 AI Zone Radar MT5版と完全PDFマニュアルを無料プレゼント。 ご購入後にMQL5でメッセージをお送りください。買い切り購入が対象です。レンタルは対象外です。 AI Zone Radarを見る サインから、具体的なトレード計画へ SMA 13、21、75、100へのタッチを使ったセットアップを検出。各サインに売買方向と対象MAを表示するため、浅い押し目、戻りと深い調整を区別して確認できます。 チャートとパネルには、次の情報を表示し
Presenting one-of-a-kind Gann Indicator for XAUUSD IQ Gold Gann Levels is a non-repainting, precision tool designed exclusively for XAUUSD intraday trading. It uses W.D. Gann’s square root method to plot real-time support and resistance levels, helping traders spot high-probability entries with confidence and clarity. William Delbert Gann (W.D. Gann) was an exceptional market analyst whose trading technique was based on a complex blend of mathematics, geometry, astrology, and ancient calculation
Dynamic Forex28 Navigator - 次世代の Forex 取引ツール。 現在 49% オフ。 Dynamic Forex28 Navigator は、長年人気のインジケーターを進化させたもので、3 つの機能を 1 つにまとめています。 Advanced Currency Strength28 インジケーター (レビュー 695 件)  + Advanced Currency IMPULSE with ALERT (レビュー 520 件) + CS28 コンボ シグナル (ボーナス)。 インジケーターの詳細 https://www.mql5.com/en/blogs/post/758844 次世代の Strength インジケーターが提供するもの  オリジナルで気に入っていたすべての機能が、新機能と精度の向上によって強化されました。 主な機能: 独自の通貨強度計算式。 すべての時間枠でスムーズかつ正確な強度ライン。 トレンドの特定と正確なエントリーに最適です。 ダイナミックマーケットフィボナッチレベル (マーケットフィボナッチ)。 このインジケーターに固有
Beast Super Signal
Florian Zuercher
4.73 (89)
収益性の高い取引機会を簡単に特定するのに役立つ強力な外国為替取引インジケーターをお探しですか?ビースト スーパー シグナル以外に探す必要はありません。 この使いやすいトレンドベースのインジケーターは、市場の状況を継続的に監視し、新しいトレンドを検索したり、既存のトレンドに飛びついたりします。ビースト スーパー シグナルは、すべての内部戦略が一致し、互いに 100% 合流したときに売買シグナルを発するため、追加の確認は不要です。シグナル矢印アラートを受け取ったら、単に売買します。 購入後、プライベート VIP グループに追加されるようにメッセージを送ってください! (完全な製品購入のみ)。 購入後、最新の最適化されたセット ファイルについてメッセージを送ってください。 MT5バージョンは こちらから入手できます。 Beast Super Signal EA は こちらから 入手できます。 コメント セクションをチェックして、最新の結果を確認してください。 ビースト スーパー シグナルは、1:1、1:2、または 1:3 のリスクと報酬の比率に基づいて、エントリー価格、ストッ
IQ FX Gann Levels a precision trading indicator based on W.D. Gann’s square root methods . It plots real-time, non-repainting support and resistance levels to help traders confidently spot intraday and scalping opportunities with high accuracy. William Delbert Gann (W.D. Gann) was an exceptional market analyst, whose trading technique was based on a complex blend of mathematics, geometry, astrology, and ancient mathematics which proved to be extremely accurate. We don't offer free or bonus indic
Super Signal – Skyblade Edition プロ仕様のノンリペイント / ノーラグ・トレンドシグナルシステム。卓越した勝率を実現 | MT4 / MT5 対応 1分足、5分足、15分足などの低い時間足で最も効果を発揮します。 主な特徴: Super Signal – Skyblade Edition は、トレンド取引に特化したスマートなシグナルシステムです。マルチレイヤーのフィルターロジックを用いて、明確な方向性と実際のモメンタムに支えられた強力なトレンドのみを検出します。 このシステムは 天井や底を予測するものではありません 。次の3つの条件がすべて満たされた場合にのみシグナルを発生させます: 明確なトレンド方向 モメンタムの増加 健全なボラティリティ構造 市場セッションに基づく流動性分析と組み合わせることで、シグナルの精度とタイミングがさらに向上します。 シグナルの特性: すべての矢印シグナルは 100% 非リペイント / 遅延なし 一度出現したシグナルは固定され、点滅・消失しません チャート上の矢印、情報パネル、ポップアップ通知、音声アラート、プッシュ通知
BTMM State Engine Pro by G-Labs — Beat The Market Maker indicator for MetaTrader 4. Asian session range, London and New York kill zones, level progression (L1/L2/L3), peak formation detection (PFH/PFL), entry signals, and a multi-pair scanner from one chart. Stop scanning charts one pair at a time. The State Engine tracks the BTMM daily cycle automatically — Asian box, room boundaries, level blocks, peak formations, and filtered entries — while the scanner dashboard shows level, peak status,
Miraculous Indicator – ガン・スクエア・オブ・ナインに基づく100%非リペイントのFXおよびバイナリーツール この動画では、FXおよびバイナリーオプションのトレーダー向けに特別に開発された、非常に正確で強力な取引ツールである Miraculous Indicator を紹介しています。このインジケーターがユニークなのは、伝説的な ガン・スクエア・オブ・ナイン と ガンの振動の法則 に基づいている点で、現代の取引で利用できる最も正確な予測ツールの一つとなっています。 Miraculous Indicatorは 完全に非リペイント であり、ローソク足が確定した後にシグナルが変化したり消えたりすることはありません。つまり、見たものがそのまま利用できます。これにより、トレーダーは自信を持ってエントリーおよびエグジットを行うための信頼性と一貫性のある根拠を得ることができます。 主な特徴: ガン・スクエア・オブ・ナインとガン理論に基づいて構築 100%非リペイントのシグナルシステム すべての時間枠(M1、M5、H1、H4、日足、週足)で機能 FXおよびバイナリーオプション取引
このインジケーターは実践的なトレードに最適な自動波動分析のインジケーターです! 場合... 注:   Tang Lun (Tang Zhong Shuo Zen) の命名規則の影響で、私は波のグレーディングに西洋の名前を使用することに慣れていません。基本的な波を ペン 、二次波のバンドを セグメント と名付けました。同時に、 セグメント にはトレンドの方向が指定されます (この命名方法は将来のノートで使用されます。最初に言っておきます)。ただし、アルゴリズムは曲がりくねった理論とはほとんど関係がないため、付けるべきではありません。これは、私の市場分析 によって要約された、絶えず変化する複雑な運用ルール を反映しています。 バンドは標準化され、人によって異なることがないよう定義されており、市場参入を厳密に分析する上で重要な役割を果たす人為的な干渉の描画方法が排除されています。 このインジケーターを使用することは、取引インターフェイスの美しさを改善することと同等であり、元の K ライン取引を放棄し、取引の新しいレベルに連れて行きます。また、宣伝の観点から顧客の認識も向上します。 イ
Gold Channel is a volatility-based indicator, developed with a specific timing algorithm for the XAUUSD pair, which consists of finding possible corrections in the market. This indicator shows two outer lines, an inner line (retracement line) and an arrow sign, where the theory of the channel is to help identify overbought and oversold conditions in the market. The market price will generally fall between the boundaries of the channel. If prices touch or move outside the channel it is a tradi
CVD ダイバージェンス検出 - 高度なボリュームデルタ分析   我々が解決する問題 ほとんどのトレーダーは価格アクションのみに依存し、真の市場センチメントを明らかにする重要なボリュームフロー情報を見逃しています。従来の指標は価格の動きに遅れをとり、エントリーが遅れ、リスク管理が不十分になります。CVD ダイバージェンス検出は、価格とボリュームデルタモメンタムの関係を分析することでこれを解決し、大きな市場の動きの前に早期警告信号を提供します。   CVD ダイバージェンス分析の利点   早期市場反転検出   - 価格チャートに現れる前にモメンタムシフトを発見   スマートマネー追跡   - 機関投資家がいつ蓄積または配布しているかを確認   偽シグナル削減   - ボリュームが価格の動きを確認し、より高い確率のセットアップを提供   マルチタイムフレームの優位性   - スキャルピングからスイングトレーディングまで全ての時間枠で機能   汎用的な応用   - FX、株式、商品、暗号通貨に対応   4つの市場フェーズ - 実際のトレーディングストーリ
Binary Booster
Yaroslav Varankin
5 (1)
Binary Options Trading Indicator: A Reliable Tool for Your Trades This indicator is specifically designed for binary options trading and has proven its high quality, reliability, and adequate accuracy, depending on the dynamics of the chart. Key Points: Signal Interpretation: When a blue cross signal appears, it indicates a potential entry into a trade, though it is considered a weak signal on its own. However, if the blue cross is accompanied by an arrow, it is considered a more reliable buy s
Enigmera
Ivan Stefanov
5 (9)
ENIGMERA: 市場の中心 重要:MQL5.comのデモはStrategy Testerで実行されており、Enigmeraの機能を完全には反映していない場合があります。詳細については、説明、スクリーンショット、ビデオをご確認ください。質問があれば、遠慮なくメッセージを送ってください! インジケーターのコードは完全に書き直されました。バージョン3.0は新機能を追加し、インジケーターの開始以来蓄積されたバグを修正しました。 紹介 このインジケーターとトレーディングシステムは、金融市場への注目すべきアプローチです。ENIGMERAはフラクタルサイクルを使用して、サポートとレジスタンスのレベルを正確に計算します。真の蓄積フェーズを示し、方向と目標を提供します。トレンドでも修正でも機能するシステムです。 動作方法 インジケーターのほとんどの機能は、チャートの左側にあるボタンで制御され、市場の状況に迅速に対応できるようになっています。 ボタン ON/OFF – インジケーター全体を表示または非表示にします。 Channel – サポートチャネルを有効にし、許容範囲の偏差を示します。 Dev
Owl smart levels
Sergey Ermolov
4.26 (38)
トレンドに沿ってトレードする際の主な難しさは、レベルを見つけることではなく、どこが実際に有効なエントリーポイントなのかを理解することにあります。 価格はしばしばレベルに反応しますが、動きが継続しないことが多く、その結果、誤ったエントリーや機会損失につながります。 Owl Smart Levels は単にレベルを表示するだけではなく 、市場構造とプルバックに基づいてゾーンを形成します。これにより、エントリーポイントを異なる視点で評価でき、一部の誤シグナルを回避できます。 Owl Smart Levels システムに含まれるもの Owl Smart Levels は単なるレベルの表示ではなく、各要素が連携する 完全なトレードモデル です。 内容は以下の通りです: Owl Smart Levels(インジケーター) トレンド方向、プルバックゾーン、事前定義されたエントリー・StopLoss・TakeProfitレベルを表示 システムガイド 実際のトレードでのシグナルの扱い方を解説:どの状況を考慮し、どれを回避し、どのようにトレードを管理するか トレード判断チェックリスト シグナルを迅
RelicusRoad Pro: 定量的市場オペレーティングシステム 【期間限定】無制限アクセス 70% OFF - 2,000人超のトレーダーと共に なぜ多くのトレーダーは「完璧な」インジケーターを使っても失敗するのでしょうか? それは、文脈を無視して 単一の概念 だけでトレードしているからです。文脈のないシグナルは単なるギャンブルです。勝ち続けるには、 根拠の重なり(コンフルエンス) が必要です。 RelicusRoad Proは単なる矢印インジケーターではありません。完全な 定量的市場エコシステム です。独自のボラティリティモデリングを用いて、価格が推移する「適正価値の道(Fair Value Road)」をマッピングし、ノイズと真の構造的ブレイクを判別します。 推測はやめましょう。機関投資家レベルの「ロード・ロジック」でトレードを。 コアエンジン:「Road」アルゴリズム システムの中心となる Road Algo は、市場環境にリアルタイムで適応するダイナミックなボラティリティチャネルです。 安全ライン(平衡点) と、価格が数学的に反転しやすい 拡張レベル を投影します。 Si
TrendMaestro
Stefano Frisetti
4 (4)
Attention: beware of SCAMS, TRENDMAESTRO is only ditributed throught MQL5.com market place. note: this indicator is for METATRADER4, if you want the version for METATRADER5 this is the link:  https://www.mql5.com/it/market/product/108106 TRENDMAESTRO ver 2.5 TRENDMAESTRO recognizes a new TREND from the start, he never makes mistakes. The certainty of identifying a new TREND is priceless. DESCRIPTION TRENDMAESTRO identifies a new TREND in the bud, this indicator examines the volatility, volumes a
現在30%OFF! このダッシュボードは、複数のシンボルと最大9つのタイムフレームで動作するソフトウェアの非常に強力な部分です。 このソフトは、弊社のメインインジケーター(ベストレビュー:Advanced Supply Demand)をベースにしています。    Advanced Supply Demand ダッシュボードは、素晴らしい概要を提供します。それは示しています。  ゾーン強度評価を含むフィルタリングされた需給値。 ゾーン内/ゾーンへのPips距離。 ネストされたゾーンがハイライトされます。 選択されたシンボルの4種類のアラートを全ての(9)時間枠で提供します。 それはあなたの個人的なニーズに合わせて高度に設定可能です。 あなたの利益! すべてのトレーダーにとって最も重要な質問です。 市場に参入するのに最適なレベルはどこか? 成功のチャンスとリスク/リターンを得るために、強力な供給/需要ゾーン内またはその近くで取引を開始します。 損切りの最適な位置はどこですか? 最も安全なのは、強力な供給/需要ゾーンの下/上にストップを置くことです。 最適な利益
多くの矢印インジケーターは、シグナルだけを表示して、その後の判断はすべてトレーダー任せです。KT Alpha Hunter Arrows は、最初から完成されたトレードプランを提供します。 各シグナル矢印が表示されると、エントリーライン、ストップロス、4つのテイクプロフィット水準、そして現在の銘柄と時間足を今トレードする価値があるかを示すリアルタイムのエッジ判定が、チャート上にまとめて描画されます。付属の Trade Manager EA は、手動でエントリーした後の管理をサポートし、相場が荒れて感情が揺れやすい場面でも、トレードの規律を保ちやすくします。リペイントなし。確定足のみでシグナルを表示。Forex、ゴールド、指数、その他あなたが取引するあらゆる銘柄向けに設計されています。 主な機能 リペイントしない買い・売り矢印。シグナルは足が確定した後にのみ表示されます。 各シグナルにエントリーライン、構造的なストップロス、4つのテイクプロフィット水準を表示。 Edge Dashboard が、現在のチャート上で買いと売りのセットアップを個別に評価。 判定システム:No Edge、Ma
There is always a need to measure if the market is "quiet" or it is volatile. One of the possible way is to use standard deviations, but the issue is simple : We do not have some levels that could help us find out if the market is in a state of lower or higher volatility. This indicator is attempting to do that : •           values above level 0 are indicating state of higher volatility (=GREEN buffer) •           values below level 0 are indicating state of lower volatility (=RED buffer)
Quant Direction
Georgios Kalomoiropoulos
Quant Direction は、3次元の市場分析ツールです。完全に客観的なアルゴリズムベースの市場分析を提供し、様々なパラメータにわたる正確なパーセンテージ偏差を同時に算出します。高度なAI搭載モデリングツールで開発され、厳密なテストを経て開発されたこのアルゴリズムは、かつてない精度で市場を分析するように設計されています。プラットフォーム上では、あらゆる通貨ペアや金融商品を分析できます。 短期取引、デイトレード、スイングトレードなど、どのような取引スタイルに も、Quant Directionは最適な選択肢です。 オペレーターの本当の利点 Quant Directionの真の利点は、感情、眼精疲労、過剰分析を完全に排除できる点にあります。方向性を探るために何十ものチャートを手作業で精査したり、自分の好みを常に疑ったりする必要がなくなります。このシステムは、8つの時間間隔(5ヶ月から月単位まで)をミリ秒単位で処理します。あらゆる瞬間に市場を支配している主体を正確に明らかにし、常に成功確率が最も高い方向で取引できるようにします。 市場分析の3つの側面 このアルゴリズムは市場を3つの
このインジケーターは、エリオット波動理論と組み合わせて作動し、2つの方法で使用されます: 自動モード: このモードでは、インジケーターがチャート上の全ての5つのモーティブ波を自動的に検出し、予測とポテンシャルな逆転ゾーンを提供します。また、アラートやプッシュメッセージを生成する能力も備えています。この自動機能により、エリオット波動パターンの識別と分析のプロセスが効率化されます。 手動モード: このオプションは、エリオット波動理論を手動で扱いたいトレーダー向けです。9つの段階を使用して波を描画することができます。各段階は、表示された後に描画されたラインを調整して個別に定義できます。この機能により、手動で波を描画するプロセスがより効率的になります。重要な点として、すべての描画データが将来の参照のためにプラットフォームのデータフォルダに保存されることに注意してください。 パラメータ: Name: インジケーターの名前。 Use_System_Visuals: インジケーターのテーマを有効または無効にして、取引プラットフォーム全体の外観に合わせます。 Explain_Comment: 波の番号
Built-in multi-symbol scanner — traffic-light grid for up to 30 pairs across four timeframes. No separate scanner file required. BUY, SELL, WAIT cells with confluence score and recent structure event. Full alignment with AI Trade Idea — current chart cell reads live engine data so scanner, dashboard, and AI panel always show the same verdict, score, and reason. Per-cell explain popup — four-section breakdown of what is happening, how the score was built, what to look for, and what to watch out
Gannスクエアインジケーターは、W.D. Gannによって執筆された「市場予測のための数学的な式」の記事に基づく強力な市場分析ツールです。このツールは、解析に数学的な概念を応用し、Gann理論に基づいています。それは、144、90、52のスクエアや9のスクエアなど、Gannの関連テクニックの要素を取り入れています。さらに、の方法を組み込んでおり、9のスクエアとその関連性についてのチャネルやスターパターンに焦点を当てています。 ユーザーマニュアルと使用方法: このインジケーターを使用する前に、ユーザーマニュアルを読んで疑問点を解決するためにお問い合わせいただくことをお勧めします。ユーザーマニュアルの完全版は、当社のウェブサイトで入手できます。 MT5の完全版は購入できますし、MT4の無料版も試すことができます。両方のバージョンへのリンクを提供していますので、ご利用ください。 主な機能と機能: Gannスクエアインジケーターは、市場分析のための完全なツールセットを提供し、幾何学的な概念とGann理論に基づいて的確な判断を行う手助けをします。以下に主な機能を示します。 9のスクエアの分析:
Congestioni
Stefano Frisetti
5 (1)
This indicator is very usefull to TRADE Trading Ranges and helps identify the following TREND. Every Trader knows that any market stay 80% of the time in trading ranges and only 20% of the time in TREND; this indicator has been built to help traders trade trading ranges. Now instead of waiting for the next TREND, You can SWING TRADE on trading ranges with this simple yet very effective indicator. TRADING with CONGESTIONI INDICATOR: The CONGESTIONI Indicator identify a new trading range and ale
Trend Breakout Arrows Indicator The Trend Breakout Arrows Indicator is a momentum-based signal tool designed to identify potential bullish and bearish breakout opportunities. It displays clear arrow signals directly on the price chart, helping traders quickly recognize possible trend changes and continuation setups. Up Arrow (Buy Signal) A magenta up arrow appears below a candle when bullish momentum begins to strengthen. This signal indicates that buying pressure may be overtaking selling press
An extremely convenient indicator that truly makes the process of making money on the exchange easy. It is based on the scientifically rigorous theory of the market developed by the author, the beginning of which is presented here .                The full algorithm of this indicator operation is presented in the article .               The indicator calculates the most probable price movement trajectory and displays it on the chart. Based on the predicted price movement trajectory
作者のその他のプロダクト
An advanced equity protection and trade management script. It monitors individual trade P&L and closes positions when floating equity targets (profit or loss) are met. It features "skip closing hours" for high volatility, wide spreads, or price instability times . Features: Closes trades at a target profit (`MAX_FLOATING_EQUITY`) or maximum loss (`MAX_FLOATING_LOSS`). Includes a `FORCE_CLOSE_AT_MAX_EQUITY` level that bypasses all exit protection checks. "SKIP_CLOSING_HOURS" input to pause loss
FREE
Close Time
Frank William Jr Colbert
A simple, time-based execution utility that closes all open trades at a specific hour and minute each day. It operates continuously, checking every tick for the designated closing time. Features: Inputs for `CloseHour` (0-23) and `CloseMinute` (0-59). Independent controls for closing Buy and Sell orders. Once the current time equals or exceeds the set time, all eligible orders are closed. Effective Uses: Daily Cut-off: Automatically close all intraday trades at the end of your trading session
FREE
Description: An advanced equity protection and trade management script. It monitors individual trade P&L and closes positions when floating equity targets (profit or loss) are met. It features "skip closing hours" for high volatility, wide spreads, or price instability   times . Features: Closes trades at a target profit (`MAX_FLOATING_EQUITY`) or maximum loss (`MAX_FLOATING_LOSS`). Includes a `FORCE_CLOSE_AT_MAX_EQUITY` level that bypasses all exit protection checks. "SKIP_CLOSING_HOURS" inpu
FREE
Close at Friday
Frank William Jr Colbert
A position management utility designed to automatically close all trades and stop further trading on Friday evenings before the market closes for the weekend. This helps traders avoid weekend gap risk. Features: Activates on Friday based on the broker’s server time. User-definable exit time (e.g., 22:00). Can close Buy orders only, Sell orders only, or both. Includes a flag (`tradingStopped`) to prevent new trades after the Friday exit is triggered. Effective Uses: Weekend Gap Protection: Clo
FREE
Project profits with precision. Equity Master Projection is a comprehensive trade management and analytics dashboard that goes beyond simple equity tracking. It analyzes both open positions and historical trades across multiple symbols and magic numbers, applying powerful filters to isolate your best-performing strategies. With unique features like a "Cut Mode" for profit capping and dynamic HTML/CSV reporting with equity curve charts, this tool transforms raw trading data into a clear, actiona
Have patterns that drive your trading success or failure. The Equity Performance Analyzer breaks down your trade history by symbol, day of the week, and hour of entry to identify exactly when your strategies perform best and worst. It ranks every possible trading pattern (e.g., "EURUSD-BUY-Mon-14") by Net Profit, Win Rate, Return/Drawdown, and a Monte Carlo Proxy. More than just an analytics tool, it generates ready-to-use input parameters for your EAs and a crucial "Worst Patterns to Avoid" se
Ensure your trading strategy's future performance by trading only on stable, reliable pairs. The Pair Stability Indicator analyzes the velocity and volatility of any symbol to determine if it can support consistent strategy execution. It calculates critical metrics like Pips per Second, Dollars per Pip, and Dollars per Second of movement, scoring each pair from 0-100%. By identifying highly stable instruments (e.g., EURUSD) and flagging unstable ones (e.g., XAGAUD), this indicator acts as a cru
Speed Trade Master filters your trade history and open positions to find only the fastest, most efficient trades—winners that hit profit targets quickly and losers that are cut short with minimal drawdown. By applying strict filters for Max MAE ($ and time) and Max MFE (time), it isolates "Lightning Trades." The tool then projects future performance and analyzes weekly patterns, providing a free, essential dashboard for any trader looking to optimize for speed and efficiency. Key Features: Tri
Day Trade Close
Frank William Jr Colbert
An advanced profit-taking EA that closes only *profitable* trades at the end of the day (Monday-Friday) and on Friday, while allowing losing trades to continue running or be handled by other logic. Features: Closes profitable trades at a user-defined "ProfitCloseTime". Separate profit thresholds for regular weekdays (`PROFIT_CLOSE_MG`) and Fridays (`PROFIT_CLOSE_FD`). Includes the full "ExitOnFriday" logic to close *all* trades after a specific Friday time. Can filter by Magic Number, only clo
A time-based position expiration system that moves trades to a "watch list" after they reach a certain age. It does not close them immediately but waits for them to hit a profit target (or loss target) before exiting. Features: Global and Magic-specific expiration periods (format: HH:MM:SS). Tracks expired trades separately and only closes them when a `MIN_PROFIT_CLOSE` target is met (or loss target if "Close Only Profitable" is false). Includes a manual control and statistics reporting functi
Trading tool combining a sophisticated equity stop-loss, dynamic take-profit management (Breakeven & Trailing), and symbol-group-based closing logic. It is a complete risk management and trade supervision tool. Features: All features of `Equity Master Stop v1` (floating profit/loss limits, exit protection, skip hours). Take-Profit Override: Can force a TP on any order to lock in a `MAX_FLOATING_PROFIT`. Step Breakeven: Locks in increasing amounts of profit as a trade moves favorably (e.g., aft
Open Trade EA
Frank William Jr Colbert
A basic entry and position management EA that opens trades on multiple currency pairs at specific times. It includes its own internal trailing stop and take-profit logic, as well as integrated "end-of-day" and "Friday" profit-close features from the other scripts. Features: Opens trades on user-defined `PairsSet1` through `Set6` at specific `TradeTime` inputs. Configurable position sizing (`Lots`), Stop Loss, and Take Profit. Includes its own `TrailOrders` function that trails both SL and TP b
Open Round Level
Frank William Jr Colbert
A Expert Advisor that automatically opens trades when price crosses predefined pip-based round levels. Unlike simple round number EAs that only trade on psychological levels like 1.1000 or 1.2000, this EA allows you to define up to five independent pip intervals simultaneously, each with its own Magic Number for separate tracking and management. The EA functions as a complete trading system, combining automated entry based on price crossing round levels, directional control, integrated trailin
Echo Simulator Trader is a powerful hybrid simulation-to-live EA that runs thousands of pure price-action simulated trades in parallel with your live account. It opens simulated LONG and SHORT positions at regular intervals on multiple pairs, meticulously tracks their performance using your exact risk rules, and only activates real trading once simulated strategies pass your custom performance filters (Net Profit, Profit Factor, Win Rate, Drawdown, etc.). Built for complete control and proof-of
Echo Simulator Trader v2 expands the simulation engine of v1 hybrid simulation-to-live EA that runs thousands of pure price-actions simulated trades in parallel with specified day and time. It opens simulated LONG and SHORT positions at regular intervals on multiple pairs, meticulously tracks their performance using your exact risk rules, and only activates real trading once simulated strategies pass your custom performance filters (Net Profit, Profit Factor, Win Rate, Drawdown, etc.). Built fo
Echo Simulator Trader v3 expands the simulation engine of v2 with 5 independent Property Sets (P1–P5). Each set can run on its own timeframe, magic number, position limits, and pip-interval grid logic — allowing you to test and run completely different strategies simultaneously within one EA. Simulated trades feed into a unified performance analyzer that decides which strategies graduate to real trading. With enhanced multi-magic support, pip-based round-level entries (mean reversion or breakou
Project profits with precision. Equity Master Projection is a comprehensive trade management and analytics dashboard that goes beyond simple equity tracking. It analyzes both open positions and historical trades across multiple symbols and magic numbers, applying powerful filters to isolate your best-performing strategies. With unique features like a "Cut Mode" for profit capping and dynamic HTML/CSV reporting with equity curve charts, this tool transforms raw trading data into a clear, actiona
A time-based position expiration system that moves trades to a "watch list" after they reach a certain age. It does not close them immediately but waits for them to hit a profit target (or loss target) before exiting. Features: Global and Magic-specific expiration periods (format: HH:MM:SS). Tracks expired trades separately and only closes them when a `MIN_PROFIT_CLOSE` target is met (or loss target if "Close Only Profitable" is false). Includes a manual control and statistics reporting functi
Trading tool combining a sophisticated equity stop-loss, dynamic take-profit management (Breakeven & Trailing), and symbol-group-based closing logic. It is a complete risk management and trade supervision tool. Features: All features of `Equity Master Stop v1` (floating profit/loss limits, exit protection, skip hours). Take-Profit Override: Can force a TP on any order to lock in a `MAX_FLOATING_PROFIT`. Step Breakeven: Locks in increasing amounts of profit as a trade moves favorably (e.g., aft
Open Trade MT5
Frank William Jr Colbert
A basic entry and position management EA that opens trades on multiple currency pairs at specific times. It includes its own internal trailing stop and take-profit logic, as well as integrated "end-of-day" and "Friday" profit-close features from the other scripts. Features: Opens trades on user-defined `PairsSet1` through `Set6` at specific `TradeTime` inputs. Configurable position sizing (`Lots`), Stop Loss, and Take Profit. Includes its own `TrailOrders` function that trails both SL and TP b
Have patterns that drive your trading success or failure in MT5. The Equity Performance Analyzer breaks down your trade history by symbol, day of the week, and hour of entry to identify exactly when your strategies perform best and worst. It ranks every possible trading pattern (e.g., "EURUSD-BUY-Mon-14") by Net Profit, Win Rate, Return/Drawdown, and a Monte Carlo Proxy. More than just an analytics tool, it generates ready-to-use input parameters for your EAs and a crucial "Worst Patterns to Av
A Expert Advisor that automatically opens trades when price crosses predefined pip-based round levels. Unlike simple round number EAs that only trade on psychological levels like 1.1000 or 1.2000, this EA allows you to define up to five independent pip intervals simultaneously, each with its own Magic Number for separate tracking and management. The EA functions as a complete trading system, combining automated entry based on price crossing round levels, directional control, integrated trailin
Echo Simulator Trader is a powerful hybrid simulation-to-live EA that runs thousands of pure price-action simulated trades in parallel with your live account. It opens simulated LONG and SHORT positions at regular intervals on multiple pairs, meticulously tracks their performance using your exact risk rules, and only activates real trading once simulated strategies pass your custom performance filters (Net Profit, Profit Factor, Win Rate, Drawdown, etc.). Built for complete control and proof-of
Echo Simulator Trader v2 expands the simulation engine of v1 hybrid simulation-to-live EA that runs thousands of pure price-actions simulated trades in parallel with specified day and time. It opens simulated LONG and SHORT positions at regular intervals on multiple pairs, meticulously tracks their performance using your exact risk rules, and only activates real trading once simulated strategies pass your custom performance filters (Net Profit, Profit Factor, Win Rate, Drawdown, etc.). Built fo
Echo Simulator Trader v3 expands the simulation engine of v2 with 5 independent Property Sets (P1–P5). Each set can run on its own timeframe, magic number, position limits, and pip-interval grid logic — allowing you to test and run completely different strategies simultaneously within one EA. Simulated trades feed into a unified performance analyzer that decides which strategies graduate to real trading. With enhanced multi-magic support, pip-based round-level entries (mean reversion or breakou
フィルタ:
レビューなし
レビューに返信